This hub asks when an apparent microbial pattern in this corpus reflects biology, and when it instead reflects which organisms and samples happened to be collected, what a classifier or reference database could represent, how the statistical unit was defined, or how the analysis was built. Most projects here mine public collections that were not assembled for the questions put to them: genome catalogues, phenotype databases, metagenome archives and occurrence atlases. The corpus addresses the problem unusually directly because several projects stress-tested their own results. They held out whole studies, refit clusters without the tested taxa, dropped genome-rich species, or reanalysed with a different genome set, and they recorded where the signal survived 1,2,3,4.
Literature Context
Shotgun metagenomics reviews note that microbes are often difficult to culture, which can confound cataloguing community members. Both mapping-based and assembly-based profiling struggle in high-complexity samples and in environments containing organisms with limited similarity to sequenced genomes (PMID 28898207). Instruments also shape what is visible. An in silico evaluation of 175 primers and 512 primer pairs against the SILVA reference showed that the accuracy of 16S amplicon surveys depends strongly on primer choice (PMID 22933715). Gut–brain work found metagenome interpretation hampered by a lack of dedicated reference databases (PMID 30718848). A second strand documents reagent contamination. Contaminating DNA is ubiquitous in extraction kits, varies between kits and batches, and critically affects low-biomass samples, so concurrent sequencing of negative controls is strongly advised (PMID 25387460). A later review proposed the RIDE checklist of minimal experimental criteria (PMID 30497919). Confounding recurs as a study-design theme (PMID 27770110). Examples include antidepressant use in a cohort of n = 1,054 (PMID 30718848) and drug treatment in 218 atherosclerotic cardiovascular disease cases versus 187 controls (PMID 29018189).
The corpus’s cultivation-gap findings are consistent with this literature: genomes come disproportionately from culturable strains, and the endophyte shortfall is read as a cultivation gap rather than an ecological absence. The classifier result extends the reference-database concern from functional annotation to taxonomic detection. GOTTCHA2 found eukaryotic reads where prokaryote-restricted Kraken2 and Centrifuge databases returned approximately 0 Eukaryota, which parallels the primer-coverage argument (classifier-database-compatibility-in-taxonomic-quantification). The contamination literature also bears on one corpus interpretation. The corpus reads the plastid-dominated eukaryotic signal as co-sampled environmental DNA, but by its own account that reading is untested. The hub does not report whether negative controls were sequenced. If they were not, the contamination literature implies that reagent-derived DNA could not be excluded in any matrices with low microbial biomass (PMID 25387460).
The sharpest contrast concerns transfer across studies. A meta-analysis of eight fecal shotgun studies of colorectal cancer (n = 768) controlled for several confounders and identified 29 enriched species at FDR < 1 × 10⁻⁵, where FDR is the false discovery rate. Single-study signatures kept their accuracy in other studies (PMID 30936547). An atherosclerosis integration of 6 microbiome datasets reported good leave-one-study-out performance, though its authors caution about dataset heterogeneity and only preliminary diagnostic value (PMID 40785047). The corpus stands in tension with this optimism for environmental metagenomes. Biomes were approximately 80–100% nested within single studies. Under held-out-study validation, the environment-only model of the logit-transformed eukaryotic fraction gave R²=−0.30, and environment plus sequencing gave R²=−0.39. Detection AUC (area under the receiver-operating curve) was 0.56, approximately chance (study-batch-confounding-of-environmental-associations). The settings differ: the literature cases are human disease cohorts, while the corpus result concerns environmental metadata. The contrast therefore suggests that study-level transfer must be shown for each design rather than assumed.
The corpus’s confound-free within-substudy meta-analysis of inflammatory bowel disease (IBD) follows the confounder-controlled cross-study logic of PMID 30936547. Separately, its leakage diagnostics forced the retraction of a 33-species list. That list had been tested against clusters fitted on those same species (selection-on-outcome-leakage).
What the Corpus Shows
Collections decide which organisms and traits are visible. Available genomes come disproportionately from culturable, described strains 5. In plant-associated work, only 7,995 of 293,059 genomes (2.7%) carried plant-associated annotations. Endophytes (n=29 species) fell below the 30-species threshold, so their missing compartment is a cultivation gap, not a demonstrated ecological absence 3. Occurrence atlases show the same problem: sequenced-genome coverage correlated with inferred metal-type diversity (r = 0.35, p = 2.6×10⁻¹⁹) 6.
Phenotype databases thin out unevenly. Of 97,334 BacDive strains, 37,368 (38.4%) matched a pangenome species (a species’ pooled gene repertoire across its genomes) and metal score. Only 8 H₂S-negative species remained, making an effect size of d = -0.87 unreliable 7 (phenotype-database-coverage-bias, cultivation-collection-bias-in-ecological-genomics).
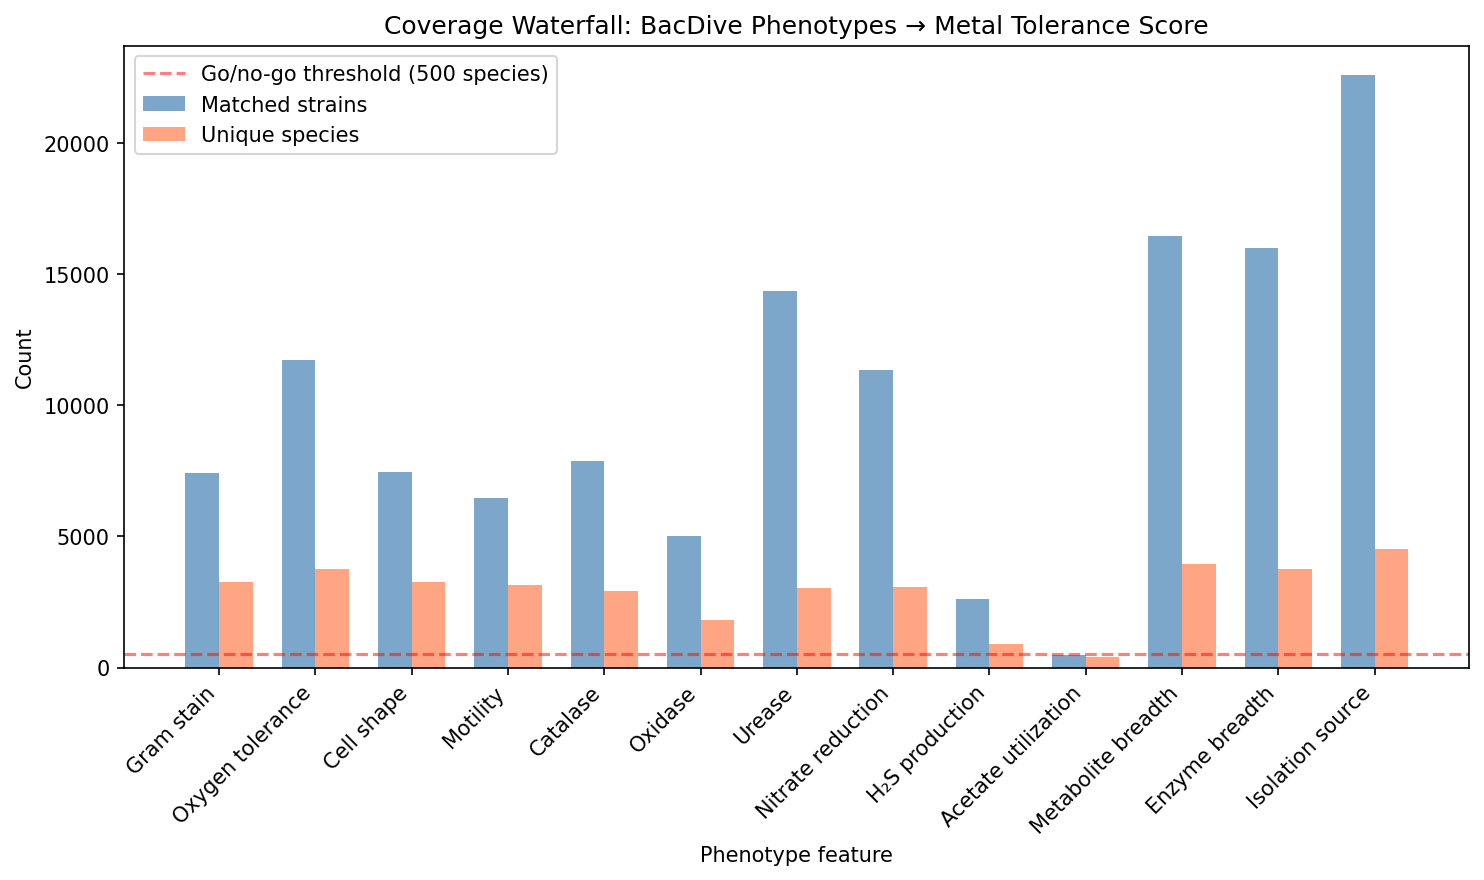 Coverage waterfall. From bacdive_phenotype_metal_tolerance.
Geography is uneven too. A Genomic Discovery Index (GDI: richness of operational taxonomic units, OTUs, divided by mean genome completeness plus one) ranks forest (902.36) and cropland (890.82) jointly highest. Frontier areas with GDI > 1000 had mean pH 6.74 against 5.94 in mapped areas, suggesting the hypothesis that alkaline soils are under-sampled 8 (genomic-under-representation).
Among metagenome-assembled genomes (MAGs, genomes reconstructed from metagenomic reads), the strongest apparent metal-resistance hotspot, Atacama/Andean, had odds ratio (OR) 9.83 and n=101 MAGs. Whether it is an expedition-level artefact is untested, and the proposed log(n_MAGs) sampling-effort correction was not reported 9 (spatial-sampling-effort-confounding).
The instrument sets the measurable space. Across 2,759 National Microbiome Data Collaborative (NMDC) runs from 9 studies, GOTTCHA2 detected eukaryotic reads in 77% of runs (median fraction 2.7%). Kraken2 and Centrifuge returned approximately 0 Eukaryota because their reference databases were prokaryote-restricted; a database that cannot represent a taxon cannot show it is absent 1 (classifier-database-compatibility-in-taxonomic-quantification). Plastid (plant or algal chloroplast) DNA made up a median 100% of detectable eukaryotic signal. Freshwater showed 99.5% detection with a plastid share of 1.00, soil 55.7% with 0.43, roots 100% with 0.03. Reading this as co-sampled environmental DNA rather than contamination is an interpretation, not a test 1 (eukaryotic-dna-admixture-in-prokaryotic-metagenomes).
Taxonomic bridging adds its own filter. Of 1,392 ENIGMA genera, 530 mapped to pangenome clades and 862 did not. The strict and relaxed mapping modes retained a mean mapped-abundance fraction of 0.343, while the species-proxy mode retained 0.031 10 (taxonomic-resolution-dependent-functional-inference).
The statistical unit and the study are part of the design. In the NMDC data, 1,067 of 2,759 runs were pooled from multiple biosamples, so the run was the unit. Each pooled run inherited its label from MIN(biosample_id), which introduces predictor label noise wherever pooled biosamples differ in local metadata; the report calls this a conservative bias 1 (pooled-run-pseudoreplication-and-metadata-label-noise). Counting non-independent metagenomes as independent pushed all 83 genera to q<0.05 (q is a false-discovery-rate, FDR, adjusted p-value), many at q~1e-70, so those values are uncalibrated 11.
Biomes were approximately 80–100% nested within single studies. Under GroupKFold, a cross-validation that holds out whole studies, models of the logit-transformed eukaryotic fraction gave R²=−0.30 for environment and R²=−0.39 for environment plus sequencing, and out-of-study detection AUC (area under the receiver-operating curve) was 0.56, approximately chance 1 (study-batch-confounding-of-environmental-associations).
Analysis choices can manufacture or erase signal. In an inflammatory bowel disease (IBD) project, latent Dirichlet allocation (LDA) ecotypes, sample clusters fitted on species abundances, were then used to test those same species. Held-out-species Jaccard overlaps were E1 = 0.230 and E3 = 0.064, below the < 0.3 “leakage dominates” bound, and the 33-species list was retracted. In a confound-free within-IBD-substudy meta-analysis of Crohn’s disease (CD) versus non-IBD controls, C. scindens was genuinely CD-increased (pooled CLR-Δ = +1.18, FDR = 1e-8; CLR is the centred log-ratio transform) 2,12 (selection-on-outcome-leakage). A plant compartment effect of R² = 0.527 fell to R² = 0.072 after excluding three genome-rich species per compartment, an 86% loss 3.
SHAP (per-feature credit assignment for model predictions) on 4,305 KEGG Orthology groups (KOs, ortholog families) split credit across correlated blocks, and a 63-feature genome-scale axis dominated when training sets were small. Fitness Browser concordance was only 1.19×, a single-project result 13 (feature-attribution-with-correlated-genomic-features). Sampling depth also moves estimates. Using all genomes with AlphaEarth embeddings (learned numerical representations of location context), up to 3,505 per species instead of at most 250, gave a median partial correlation (environment–gene-content association after removing covariates) of 0.081 against 0.003; absolute values are not comparable across the methods 4 (sampling-depth-and-downsampling-effects).
Nulls must be read for what the design could detect. Predeclared genus-level contamination–defense tests were null in both mapping modes (relaxed_all_clades rho = 0.0587, q = 0.862; strict_single_clade rho = 0.0682, q = 0.849), robust to four contamination-index definitions 10. Clinical sampling bias was real but did not explain the weak ecotype signal: a one-sided Environmental > Human-associated Mann–Whitney test gave U=1536, p=0.83, with the difference running the opposite way 4. Pangenome openness (whether a species’ gene repertoire keeps growing as genomes are added) showed no detectable correlation with environment effects (rho = -0.05, p = 0.54) or phylogeny (evolutionary-relatedness) effects in the available overlap; this one summary did not predict the measured effect sizes 14 (confirmatory-exploratory-ecological-association-discordance).
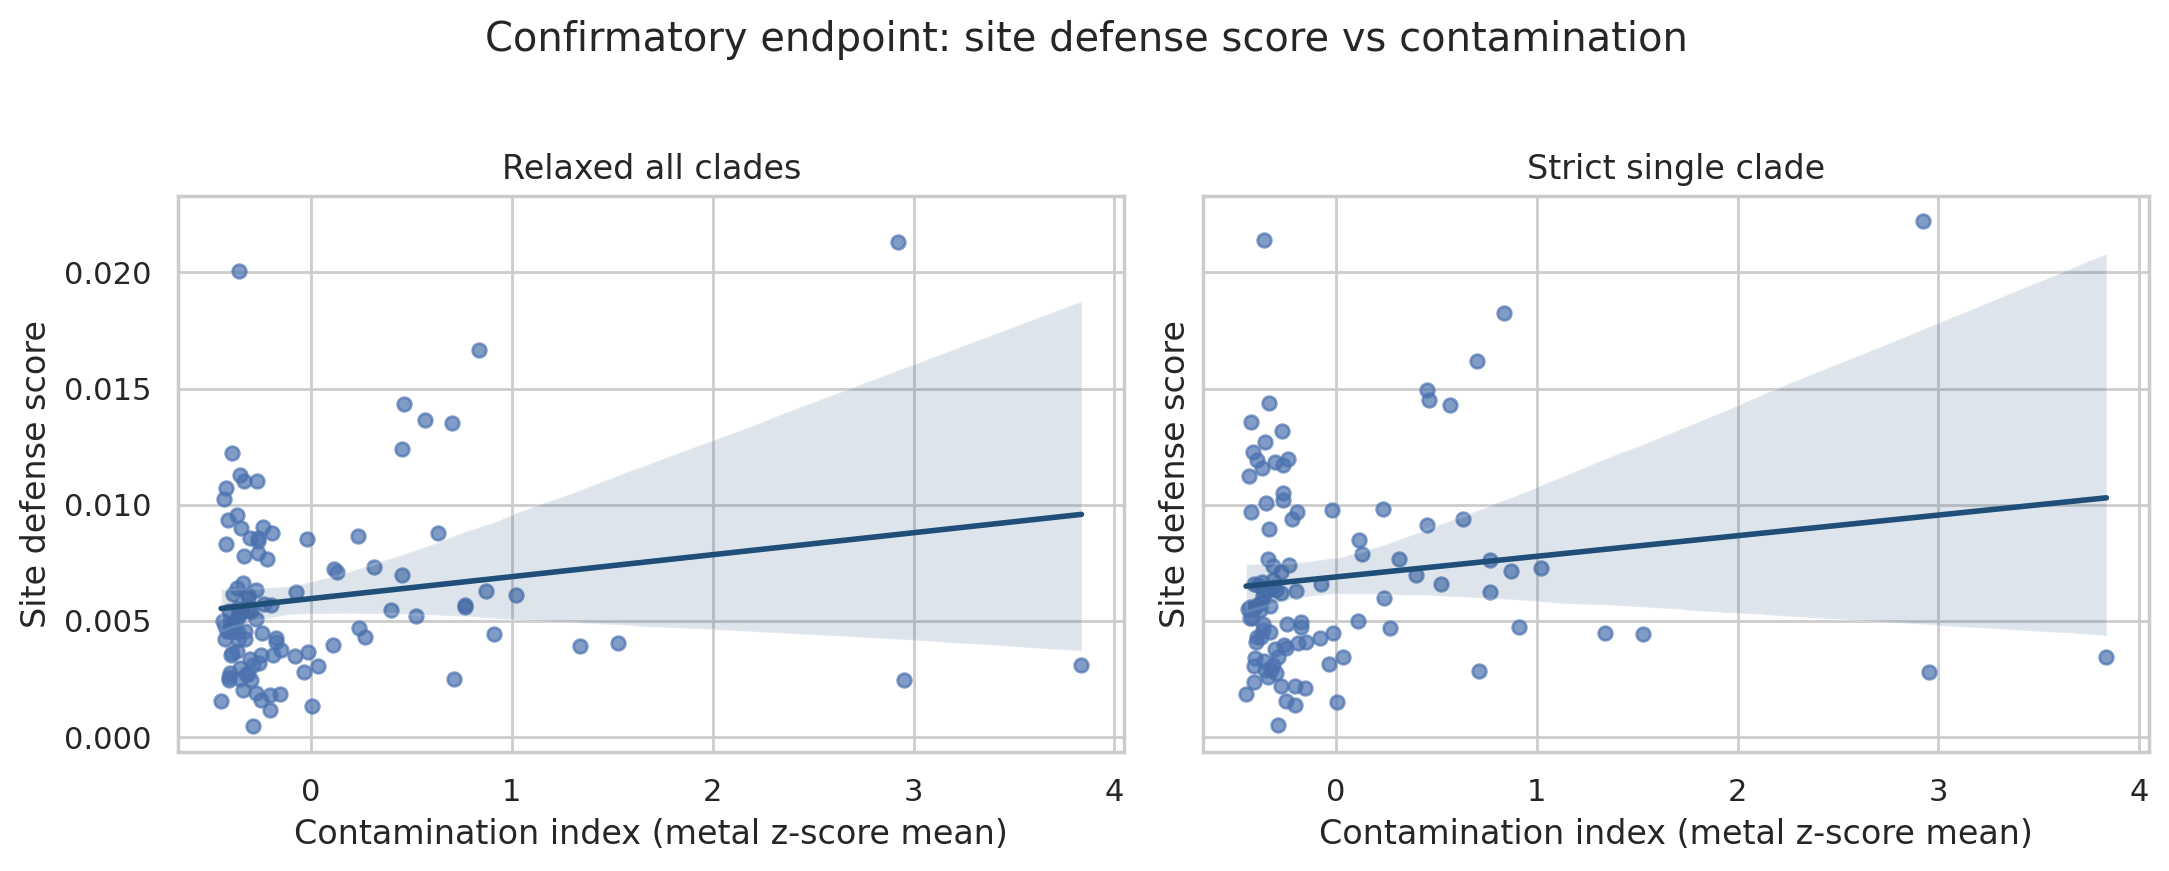 Confirmatory defense score vs contamination index by mapping mode. From enigma_contamination_functional_potential.
Some nulls are uninformative by construction. With n=3 per group, pairwise Mann–Whitney tests have a p-value floor of 0.10 and pairwise PERMANOVA (permutational multivariate analysis of variance) p~0.10, so per-OTU nulls are uninformative; the factorial M2 PERMANOVA (n=12 for Round 2) reached p=0.002 for R1 history and p=0.018 for R2 carbon source 15. Among 513 species with ≥20 genomes spanning ≥3 years (post-1990), none showed a significant temporal trend in antimicrobial-resistance (AMR) gene count after Benjamini–Hochberg correction. Only 70% of genomes had parseable dates, and the claim that trends are hidden remains a hypothesis 16 (null-results-under-limited-statistical-resolution).
Tensions and Caveats
- Correlation magnitude across ecotype pipelines. The reanalysis reports 0.081 against an original 0.003, while the original states a median environmental partial correlation of 0.0025. Genome sets and procedures differ, so the gap is a comparability problem, not a biological contradiction 4,17. See conflicts/conflict—classifier-database-compatibility-in-taxonomic-quantification—2b613a7b, conflicts/conflict—confirmatory-exploratory-ecological-association-discordance—c1d44874, conflicts/conflict—selection-on-outcome-leakage—c66707fc.
- Phylogeny versus environment. Among 172 species with sufficient data, phylogeny dominated in 60.5% and 90.7% showed no significant environmental effect 17. Classifier-derived eukaryotic fractions differed strongly by matrix (H=77.8, p=1.3×10⁻¹⁷) but did not transfer across studies 1. See conflicts/conflict—classifier-database-compatibility-in-taxonomic-quantification—8df7057b. Separately, 170 of 257 COG (Clusters of Orthologous Groups) tests were significant between ecotypes, without within-species phylogenetic controls 18. See conflicts/conflict—phenotype-database-coverage-bias—539e6d8e.
- Missingness, openness and spatial structure. Environmental species lose data more often, yet dropping them did not strengthen the signal 4. AlphaEarth location embeddings show stronger geographic structure for environmental samples 19, yet environmental species did not show stronger environment–gene-content correlations 4. See conflicts/conflict—sampling-depth-and-downsampling-effects—8542320b, conflicts/conflict—sampling-depth-and-downsampling-effects—cd13abd8, conflicts/conflict—sampling-depth-and-downsampling-effects—e2e1ad79.
- NMDC report inconsistency. It says environment explained no more variance than
study_id, yet random cross-validation on the logit-transformed fraction gave R²=0.35 for environment against 0.24 forstudy_idalone; its argument rests on nesting and held-out-study failure 1. - BacDive framing. The discoveries digest presents BacDive as validating genome-based prediction, but the direct test used 24 records and was non-significant (p=0.14) 20,5. See conflicts/conflict—phenotype-database-coverage-bias—40968e6d.
- Rank and resolution. Some signals appear only at coarse ranks, while community analyses warn genus aggregation can mask finer effects 21,10. See conflicts/conflict—taxonomic-resolution-dependent-functional-inference—d921d3c1, conflicts/conflict—taxonomic-resolution-dependent-functional-inference—326d40ea, conflicts/conflict—taxonomic-resolution-dependent-functional-inference—4b4aa6ed.
- Other unresolved records. Shared-coordinate filtering trades removing institutional artefacts against losing real field sites 19 (conflicts/conflict—spatial-sampling-effort-confounding—f75b7c12). A “54 %” Kuehl overlap is quoted on two denominators 2,20 (conflicts/conflict—classifier-database-compatibility-in-taxonomic-quantification—eb662e56). Whether the 1.19× concordance comes from the completed test is unclear 13.
- Load-bearing limitations. GOTTCHA2 fractions are ordinal, not calibrated 1. GDI bootstrap confidence intervals are pending 8. The attribution and eukaryotic-admixture evidence each come from a single project 13,1.
Where to Go Deeper
- study-batch-confounding-of-environmental-associations — the clearest demonstration of how random and held-out-study validation diverge.
- sampling-depth-and-downsampling-effects — clinical skew, missingness and the ecotype magnitude dispute in full.
- selection-on-outcome-leakage — the leakage diagnostics and the retraction they forced.
- confirmatory-exploratory-ecological-association-discordance — how predeclared nulls coexist with exploratory signals.
- classifier-database-compatibility-in-taxonomic-quantification — why cross-study taxonomic quantities need compatible reference databases.
- phenotype-database-coverage-bias — attrition through the BacDive–pangenome bridge.
- null-results-under-limited-statistical-resolution — telling uninformative nulls from informative ones.
Key entities: alph-aearth, gtdb, kbase-ke-pangenome, kescience-fitnessbrowser, ncbi-environment-metadata, benjamini-hochberg-fdr.
Reports: Metadata Correlates of Eukaryotic Contamination in NMDC Prokaryote-Targeted Metagenomes, Ecotype Reanalysis — Environmental vs Human-Associated Species, Ecotype Correlation Analysis, Metagenome-Prioritized Phage Cocktails for Crohn’s Disease and IBD, Plant Microbiome Ecotypes — Compartment-Specific Functional Guilds and Their Genetic Architecture, Global Biogeography of Environmental Bacterial Metal Resistance, Contamination Gradient vs Functional Potential in ENIGMA Communities.