Raw report: ecotype_analysis Feeds into: adaptive-versus-housekeeping-functional-differentiation, classifier-database-compatibility-in-taxonomic-quantification, confirmatory-exploratory-ecological-association-discordance, cultivation-collection-bias-in-ecological-genomics, ecotype-clustering-validity, ecotype-environment-gene-content, environment-embedding-geography, environmental-resistome, gene-cooccurrence-ecological-guilds, genome-wide-versus-locus-specific-ecological-adaptation, lab-field-fitness-concordance, pangenome-integration, phb-granule-ecology, phenotype-database-coverage-bias, phylogenetic-confounding-of-pangenome-associations, sampling-depth-and-downsampling-effects, selection-on-outcome-leakage, study-batch-confounding-of-environmental-associations
Overview
This analysis evaluated 172 bacterial species with sufficient environmental and phylogenetic data to test whether environmental similarity or phylogenetic similarity better predicts gene-content similarity. It found that phylogeny generally dominates, while environmental effects are weak and often statistically non-significant. 1
Key Findings
- The median partial correlation for environment was 0.0025, compared with 0.0143 for phylogeny. Partial correlation measures the association between two variables while accounting for another variable. 1
- Phylogeny dominated the gene-content signal in 60.5% of species, whereas environment dominated in 39.5% of species. 1
- A significant positive environment effect (p<0.05) was detected in 12 species (7.0%), a significant negative environment effect in 4 species (2.3%), and no significant effect in 156 species (90.7%). 1
- Free-living “environmental” bacteria, for which latitude/longitude is more meaningful, did not show significantly stronger environment effects than host-associated bacteria (p=0.66), a null result. Host-associated geographic coordinates may represent collection sites rather than the organisms’ actual microenvironments. 1
- The report concludes that, for most bacterial species, phylogenetic history is a stronger predictor of gene content than environmental similarity. From this it suggests, but does not directly establish, two hypotheses: that vertical inheritance dominates the gene-content signal, and that environmental adaptation may act on specific gene subsets rather than the whole genome. It also suggests the hypothesis that AlphaEarth embeddings do not fully capture ecologically relevant environmental variation. 1
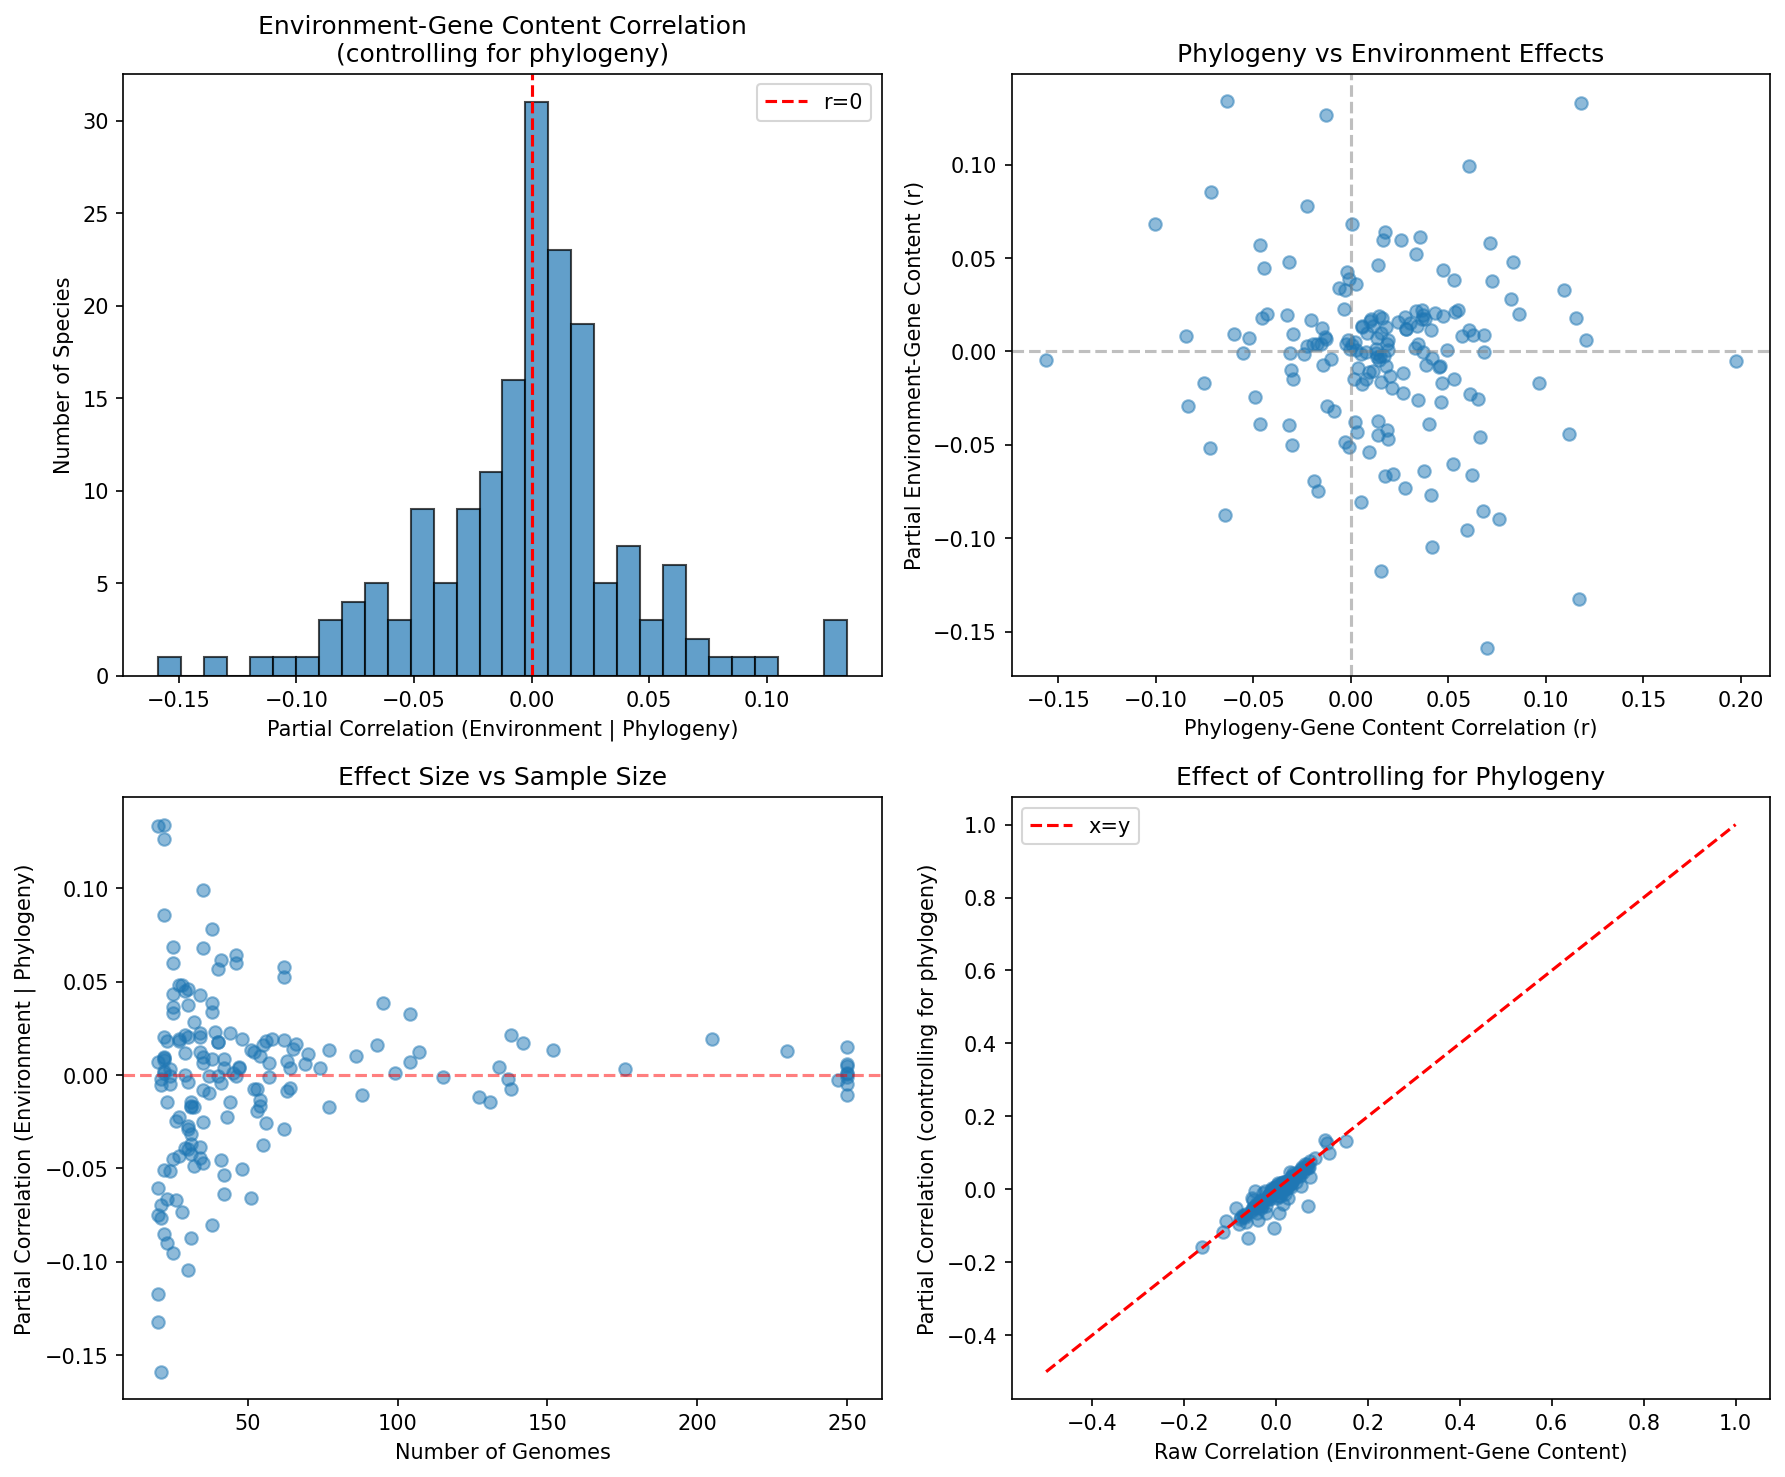 Ecotype correlation summary. From ecotype_analysis.
Analysis and Data
The analysis queried the kbase_ke_pangenome database. Its alphaearth_embeddings table supplied environmental embeddings for geographic coordinates, and its ncbi_env table supplied NCBI environmental and isolation-source metadata. Genome metadata and taxonomy, pangenome composition and gene-cluster presence/absence profiles were also queried. The generated file target_genomes_expanded.csv held 13,381 genomes across 224 species with metadata, and the output file ecotype_correlation_results.csv contains correlation results for all 172 analyzed species. 1
The supporting analyses used one notebook to extract embeddings, average nucleotide identity (ANI) distances, and gene clusters for 224 target species, and a second notebook to calculate correlations and generate visualizations. 1
The report cites Garud et al. (2019) and Shapiro et al. (2012) as consistent with its phylogeny-dominant result. Both studies show that clonal ancestry shapes genome-wide within-species variation more than ecological niche does. This is supporting context from the literature, not an extra result of the analysis. The report also links its weak genome-wide environmental effects to Polz et al. (2013), who argue that horizontal gene transfer shapes population structure at specific loci rather than genome-wide. The gene-subset reading remains a hypothesis that this analysis did not test directly. 1
Caveats
- AlphaEarth embeddings covered only 28.4% of genomes, limiting the environmental signal available for analysis. 1
- Geographic coordinates in NCBI metadata were often missing or imprecise, reducing the quality of environmental associations. 1
- Partial correlations assume linear relationships between distance matrices and may not capture nonlinear ecological effects. 1
- Geographic coordinates are less biologically meaningful for host-associated organisms because they generally describe collection sites rather than the organisms’ actual microenvironments. 1
Future Directions
- Test whether specific COG (Clusters of Orthologous Groups, a functional classification of gene families) functional categories, including V-Defense and L-Mobile, show stronger environmental effects than whole-genome gene content. 1
- Evaluate alternative embedding distances and direct environmental metadata as predictors. 1
- For species with identified ecotypes, compare gene content between ecotype clusters. 1
Figures
ecotype_correlation_summary.png: a 4-panel summary covering correlation distributions, environment versus phylogeny effects, sample-size effects, and raw versus partial correlations.environmental_vs_host_comparison.png: comparison of effects between environmental and host-associated bacteria.ecotype_by_category.png: box plots comparing environment and phylogeny effects by ecological category.ecotype_scatter_by_category.png: scatter plot of environment versus phylogeny effects, colored by category.embedding_diversity_distribution.png: distribution of environmental embedding diversity across species. 1
Slots Into
- pangenome-integration — The comparison of environmental and phylogenetic distances against pangenome gene-content similarity provides evidence about how ecological context and ancestry structure bacterial accessory genomes. 1
- ecotype-environment-gene-content — the core result that environment partial correlations are weak and mostly non-significant while phylogeny dominates in most species. 1
- phylogenetic-confounding-of-pangenome-associations — phylogeny as the stronger predictor of gene content, and the suggested dominance of vertical inheritance. 1
- genome-wide-versus-locus-specific-ecological-adaptation — the hypothesis that environmental adaptation acts on gene subsets rather than whole genomes. 1
- environment-embedding-geography — AlphaEarth coverage limits and the weak meaning of coordinates for host-associated organisms. 1
- confirmatory-exploratory-ecological-association-discordance — the null free-living versus host-associated comparison and the mostly non-significant environment effects. 1
- sampling-depth-and-downsampling-effects — limited embedding coverage constraining the available environmental signal. 1
- cultivation-collection-bias-in-ecological-genomics — missing or imprecise NCBI coordinates weakening environmental associations. 1