Raw report: gene_function_ecological_agora Feeds into: adversarial-research-quality-assurance, callability-limited-comparative-inference, chromosomal-and-integrative-gene-transfer, cofitness-network-architecture, composite-functional-annotation, confirmatory-exploratory-ecological-association-discordance, cross-tenant-data-bridging, cultivation-collection-bias-in-ecological-genomics, ecotype-environment-gene-content, environment-embedding-geography, environmental-resistome, evidence-triangulation-for-functional-annotation, functional-marker-validation, gene-function-acquisition-depth, genomic-under-representation, homology-search-negative-evidence, horizontal-gene-transfer-driven-innovation, lab-field-fitness-concordance, multi-omics-integration, ontology-and-category-schema-sensitivity, pangenome-integration, pangenome-openness-determinants, phenotype-database-coverage-bias, phylogenetic-confounding-of-pangenome-associations, research-attention-inequality, sampling-depth-and-downsampling-effects, scale-dependent-mobile-element-associations, structural-annotation-gap, taxonomic-resolution-dependent-functional-inference, two-speed-bacterial-genome
Overview
The Gene Function Ecological Agora project completed Phases 1A, 1B, 2 and 3, Phase 4 deliverables P4-D1 through P4-D5, and the NB28 synthesis, across 28 notebooks. It built a GTDB-r214 atlas spanning 18,989 species representatives. The atlas holds 13.74M rank × clade × KO (KEGG Orthology group) producer/participation scores, 17.07M Sankoff-parsimony gain events and 3.94M KO × genus MGE (mobile-genetic-element) machinery records, plus environmental, phenotype and gene-neighborhood integrations. Two of four pre-registered hypotheses were confirmed. The first was NB12 Mycobacteriaceae × mycolic-acid Innovator-Isolated. The second was NB16 Cyanobacteria × PSII (photosystem II) Innovator-Exchange at class rank. The headline states that both confirmed hypotheses survived D2 annotation-density residualization and were grounded in expected biomes at p < 10⁻¹¹. One further hypothesis was qualified/reframed, and the Alm 2006 point estimate was not reproduced at GTDB scale. 1
The project’s central methodological framework is Producer × Participation (M5/M6). It classifies clade × function tuples into four categories by producer and participation behavior: Innovator-Isolated, Innovator-Exchange, Sink/Broker-Exchange and Stable. The classification is direction-agnostic. It uses a per-rank null model with prevalence-binned cohorts, which makes it usable at deep ranks where DTL (duplication–transfer–loss) reconciliation is intractable. Its producer_z score measures production rate as paralog expansion above the per-rank null. The categories are deep-rank and direction-agnostic because donor inference was deferred under M25. Sankoff parsimony is a weighted-parsimony reconstruction of gene gains on a tree. Combined with M22 recipient-rank attribution, it gives a tree-aware acquisition-depth signal from 17M gain events on the 18,989-leaf GTDB-r214 species tree, binned as recent / older_recent / mid / older / ancient. It replaced the earlier parent-rank dispersion permutation null, which the NB08c diagnostic identified as the wrong metric. D2 annotation-density residualization found producer_z to be bias-immune (R² = 0.000). consumer_z carried a small bias (R² = 0.053) that did not change any verdict. D2 residualization supplied the bias diagnostics, and leaf_consistency supplied the within-clade-structure diagnostics. 1
Phase 2 control reclassification and full-scale KO atlas (NB09c, NB10, NB10b)
Adjudication rules and plan v2.7 commitments
The report states that the Bacteroidota PUL hypothesis remains falsified at the pre-registered absolute-zero criterion (Finding 1B closure, item 2). M12’s relative-threshold framing applies only to control-class methodology validation, meaning whether the methodology distinguishes HGT-active classes from housekeeping baselines. It does not apply to hypothesis adjudication. To prevent backsliding, plan v2.7 separates the two uses. The four pre-registered hypotheses (Bacteroidota PUL, Mycobacteriota mycolic-acid, Cyanobacteria PSII, Alm 2006 TCS reproduction) retain absolute-criterion adjudication, and M12 governs methodology QC only. 1
The report concedes a circularity in its producer-null validation: natural_expansion is selected for paralog count ≥ 3 and is then tested against a null designed to detect paralog expansion. Plan v2.7 binds M20 in response. M20 is an independent paralog holdout for producer-null validation at Phase 2, sourced from a curation independent of the natural_expansion construction: Pfam clans with documented paralog families per Treangen & Rocha 2011, and KO orthogroups with cross-organism duplicates per the Csurös 2010 Count framework. This is a plan commitment; this section reports no completed M20 result. 1
On phylogenetic non-independence, the report argues against adding PIC (phylogenetic independent contrasts). Classical Felsenstein PIC controls for taxon non-independence on per-species traits. Sankoff parsimony (M16, plan v2.6) is intrinsically tree-aware, because per-leaf parsimony (gain_events / n_present_leaves) already encodes tree topology. On this argument, PIC stacked on Sankoff would be double-counting. The report names a different residual concern at GTDB scale: UniRef-cluster non-independence. Multiple UniRef50s within a Pfam family inherit related phylogenetic distributions, so a Mann-Whitney test across UniRefs treats them as iid and inflates effective N. Plan v2.7 binds M19 for this: a cluster-bootstrap on UniRefs at Pfam-family granularity (B = 200 resamples per function class), recomputing per-leaf Sankoff Cohen’s d (a standardized mean difference) under each bootstrap and reporting a 95% CI. As noted elsewhere on this page, the first-pass M18 test describes its M19 CIs as KO-level resampling within class, and the report does not reconcile the two. The PIC argument is in tension with the review closure below, which lists I3 as an open limit because no PIC correction was implemented. 1
Strict-class housekeeping retest (NB09c)
The retest reclassified housekeeping by KO range:
- Ribosomal:
K02860..K02899 ∪ K02950..K02998, 89 KOs total, 83 in panel. - tRNA synthetase:
K01866..K01890, 25 KOs, 20 in panel. - RNAP core:
{K03040, K03043, K03046}, 3 KOs, all in panel. Positive controls were unchanged, because their Pfam-accession matching is more specific than description-match. 1
NB09c reused NB09b’s per-KO Sankoff scores directly, with no new tree work, and recomputed pairwise Cohen’s d. 6/9 strict pairs PASSED at d ≥ 0.3 with a 95% CI lower bound > 0. Passing pairs (n_pos; n_neg; d; 95% CI; one-sided p):
- pos_crispr_cas vs neg_trna_synth_strict: 6; 20; +3.558; [+2.93, +21.53]; 4×10⁻⁶.
- pos_crispr_cas vs neg_rnap_core_strict: 6; 3; +1.905; [+1.47, +11.88]; 0.012.
- pos_betalac vs neg_trna_synth_strict: 110; 20; +0.812; [+0.72, +0.95]; <10⁻¹⁵.
- pos_betalac vs neg_rnap_core_strict: 110; 3; +0.753; [+0.67, +0.86]; 0.0017.
- pos_tcs_hk vs neg_trna_synth_strict: 310; 20; +0.690; [+0.60, +0.88]; <10⁻¹⁵.
- pos_tcs_hk vs neg_rnap_core_strict: 310; 3; +0.665; [+0.58, +0.85]; 0.0015. The tRNA-synth values here (+3.558, +0.812, +0.690) are the NB09c panel values. The d = 0.65, 0.79 and 2.50 cited elsewhere on this page for the tRNA-synth pairs match the full-atlas NB10 rail recorded below. 1
All three pairs against the strict ribosomal class failed and kept negative d (n_pos; n_neg; d; 95% CI; p):
- pos_betalac vs neg_ribosomal_strict: 110; 83; −0.836; [−1.17, −0.52]; 0.87.
- pos_crispr_cas vs neg_ribosomal_strict: 6; 83; −0.919; [−1.15, −0.66]; 0.71.
- pos_tcs_hk vs neg_ribosomal_strict: 310; 83; −1.705; [−2.15, −1.33]; 0.96. 1
The report explains that the 3 ribosomal_strict pairs still fail because the K02860-K02899 + K02950-K02998 range is a pre-2000 KEGG-numbering approximation that itself mixes universal r-proteins with accessory variants. Strict-class summaries (n KOs; median Sankoff/n_present; median n_present leaves):
- neg_ribosomal_strict: 83; 18.83 (q25=0.11, q75=23.13, bimodal); 13.
- neg_rnap_core_strict: 3; 0.073; 18,758.
- neg_trna_synth_strict: 20; 0.032; 18,917. On the report’s reading, tRNA-synth and RNAP core are clean universal housekeeping. Ribosomal_strict is bimodal: about half of its 83 KOs are universal and half are clade-restricted. 1
The report’s verdict is M18 PASS on the cleanest housekeeping (tRNA-synth + RNAP core). Cohen’s d amplifies from 0.146 (UniRef50 NB08c, positive versus all housekeeping) to 0.665–3.558 (KO NB09c, best pairs), which the report calls a 4–25× amplification depending on positive class. It concludes that the substrate-hierarchy claim survives at KO resolution. 1
M21 (a new commitment in plan v2.8) restricts M18-style methodology validation and any d-based metric across Phase 2/3 to tRNA-synth (K01866..K01890) + RNAP core ({K03040, K03043, K03046}) as canonical clean housekeeping. Ribosomal, under both the description-match and the strict K02860-K02899 + K02950-K02998 range, is judged too contaminated at KO level. It is dropped as load-bearing housekeeping and reported as informational only. The generalizable lesson the report draws is that class detection that worked at UniRef50 (description-match, mostly clean) does not survive KO aggregation, because the 50% majority-vote threshold for “KO is class X” admits accessory members of the class. 1
Full-scale KO atlas and M22 attribution (NB10, NB10b)
NB10 (full KO atlas) and NB10b (M22 recipient-rank gain attribution) ran on 18,989 species × 13,062 KOs. They produced 28,008,764 (species, KO) presence rows materialized from MinIO, 13,739,162 (rank, clade, KO) producer/consumer scores across 5 ranks (genus → phylum), 17,073,194 Sankoff parsimony gain events on the GTDB-r214 tree (M16) and 18,988 internal tree nodes. 1
Producer × Participation categories at full scale (tuples; definition):
- Stable: 11,829,746; low producer + low participation.
- Innovator-Isolated: 803,196; high producer + low participation.
- Sink/Broker-Exchange: 741,587; low producer + high participation.
- Innovator-Exchange: 50,026; high producer + high participation, which the report calls rare and the v2 plan’s hardest call.
- insufficient_data: 314,607; n_clades_with too low for the consumer null. Innovator-Exchange constitutes 0.36% of scored tuples. The report calls it the methodology’s hardest defensible call without donor inference, since the classification does not infer donors. 1
The M18 amplification-gate verdict from NB09c (2.69M-row panel subset) reproduced at full atlas scale: 6/6 strict pairs PASSED Cohen’s d ≥ 0.3 with a 95% bootstrap CI lower bound > 0 (n_pos; n_neg; d; 95% CI):
- pos_crispr_cas vs neg_trna_synth_strict: 6; 21; 2.504; [1.31, 16.16].
- pos_crispr_cas vs neg_rnap_core_strict: 6; 3; 1.905; [1.55, 11.58].
- pos_betalac vs neg_trna_synth_strict: 110; 21; 0.792; [0.68, 0.90].
- pos_betalac vs neg_rnap_core_strict: 110; 3; 0.753; [0.66, 0.86].
- pos_tcs_hk vs neg_trna_synth_strict: 310; 21; 0.647; [0.54, 0.80].
- pos_tcs_hk vs neg_rnap_core_strict: 310; 3; 0.665; [0.58, 0.82]. The tRNA-synth control has n_neg = 21 here, against 20 in the NB09c panel. 1
The report asserts that these d values match the NB09c panel-only test almost exactly. It attributes the small drift to slightly different sample composition (NB09c best d = 3.558 with n_pos = 6, n_neg = 20) and says the substrate-hierarchy claim is reconfirmed at full atlas scale. Its summary repeats the point: NB09c (6/9 strict pairs PASS, best d = 3.56) and the NB10 M21 sanity rail (6/6 strict pairs PASS, best d = 2.50) “match within Cohen’s d ≤ 0.04 across all comparable pairs”. The report’s own values contradict that agreement claim for the CRISPR-Cas versus tRNA-synth pair (3.558 in NB09c against 2.504 at full scale), and the effect-size agreement claim should not be relied on. What replicated is the pass verdict, which is a separate claim from effect-size agreement. 1
Per-rank score distributions for the KO atlas are in figures/p2_ko_atlas_per_rank.png. The per-class acquisition-depth distribution over 17M gain events tagged by recipient-rank LCA (lowest common ancestor) is in figures/p2_m22_acquisition_depth_per_class.png. 1
Acquisition depth by control class (recent % = genus-level gain; older_recent %; mid %; older %; ancient % = phylum-or-above; total gains):
- pos_crispr_cas: 58.7; 27.6; 7.0; 4.3; 2.4; 20,898.
- pos_tcs_hk: 45.1; 32.9; 10.6; 7.0; 4.4; 518,106.
- pos_betalac: 44.2; 32.7; 10.7; 7.5; 4.9; 139,000.
- neg_ribosomal_strict: 38.9; 33.3; 12.4; 9.1; 6.3; 79,168.
- neg_rnap_core_strict: 38.5; 34.2; 12.2; 9.0; 6.0; 4,086.
- neg_trna_synth_strict: 24.7; 31.8; 17.5; 15.2; 10.7; 15,060. 1
Recent-to-ancient ratios as reported:
- pos_crispr_cas: 58.7 / 2.4 = 24.5. The report calls this highly recent-skewed and consistent with documented HGT activity.
- pos_tcs_hk: 45.1 / 4.4 = 10.3.
- pos_betalac: 44.2 / 4.9 = 9.0.
- neg_ribosomal_strict: 38.9 / 6.3 = 6.2. The report calls this mixed, as expected for the contaminated strict-K range, so it is not a clean control value.
- neg_rnap_core_strict: 38.5 / 6.0 = 6.4.
- neg_trna_synth_strict: 24.7 / 10.7 = 2.3. This is the most ancient-skewed class, which the report reads as consistent with universal vertical inheritance. 1
The report states that the recent/ancient ratio for HGT-active classes is 4–10× higher than for clean housekeeping. Its two clean housekeeping classes have different ratios, however: 2.3 for tRNA-synth and 6.4 for RNAP core. Against RNAP core the stated range does not hold uniformly, so the 4–10× comparison should not be treated as established. The earlier statement on this page that housekeeping-strict functions sit at ~1× is likewise not borne out by these per-class ratios. 1
NB10 and NB10b each needed multiple execution attempts. Long-running Python processes on the JupyterHub instance were killed silently after ~17–25 min of execution, with no error message. The report judges the kill consistent with cluster-scheduler or session-timeout behavior rather than code errors, because the inline 5-rank loop runs in 13 s and the issue only appears inside long-running sessions. That cause is suspected, not established. 1
The report aligns these depth signatures with literature. All of the following are interpretations, not independent validation:
- Recent-skewed gains for HGT-active classes align with Smillie et al. 2011 (within-phylum HGT in the human gut microbiome) and Forsberg et al. 2012 (cross-phylum AMR resistome). Bonomo (2017) documents specific β-lactamase families (TEM, CTX-M, NDM, OXA-48) with cross-phylum spread. The report calls the +44.2% recent / 4.9% ancient signature for
pos_betalac(n=139,000 gain events) the GTDB-scale instantiation of this pattern. - CRISPR-Cas recent skew (58.7% recent, 24.5× ratio) aligns with Metcalf et al. 2014 on cross-tree-of-life HGT of class-I CRISPR-Cas. The report reads it as consistent with dispersal mainly via mobile-element-borne transfers in the recent past; no donors were identified.
- TCS HK recent skew (45.1% recent, 10.3× ratio) is described as consistent with Alm 2006’s correlation of TCS HK abundance with recent-LSE fraction (r = 0.74 in 207 genomes). The explicit r ≈ 0.74 reproduction was deferred to Phase 4 (P4-D3); its later NOT REPRODUCED outcome is recorded under the hypothesis verdicts.
- The housekeeping vertical signature (tRNA-synth 24.7% recent / 10.7% ancient; ratio 2.3×) is read as extending Phillips et al. 2012, who found low paralogy in bacterial ribosomal proteins (geometric mean 1.02 paralogs vs 1.63 for other universal genes) due to dosage balance. The report frames low paralogy and low recent acquisition as two manifestations of the same dosage-constrained selective regime. 1
The report gives three provenance statements for its methods. Sankoff parsimony at GTDB scale follows the Mirkin et al. 2003 + Csurös 2010 precedent of using parsimony as an HGT proxy where full DTL reconciliation (AleRax, ALE, Notung) is computationally infeasible. M22 extracts gain locations from the parsimony reconstruction and assigns each to the rank-LCA of its descendant leaves. The report says this is the same level of phylogenetic-origin claim Alm 2006 made via lineage-specific-expansion analysis. The four-quadrant Producer × Participation framework is the project’s own construction (per the M14 close-reading correction in DESIGN_NOTES v2.4); Puigbò et al. 2010’s tree-versus-net decomposition is only its closest literature analog. The report also claims novelty for the 13.7 M (rank × clade × KO) producer/participation scores plus 17 M gain events with recipient-rank and depth-bin attribution. It contrasts this with prior HGT-atlas work that was clade-restricted (Smillie 2011 = 1,093 gut-microbiome genomes) or function-class-restricted (Forsberg 2012 = the AMR resistome), and calls its atlas the first full-bacterial-tree-scale, all-KO-spanning, depth-resolved acquisition map under a unified methodology. That priority claim is the report’s own and is not independently verified here. 1
At this milestone the pre-registered hypotheses were not yet tested. NB10/NB10b delivered the atlas methodology and substrate, while NB11 (regulatory-versus-metabolic Tier-1) and NB12 (Mycobacteriota mycolic-acid) were to test the research-plan hypotheses. M22 is recipient-and-depth attribution, not donor–recipient flow. Per the v2.9 DESIGN_NOTES rationale, deep-rank donor inference is ruled out by codon-amelioration timescales (post-amelioration composition signal degrades for events older than ~10–100 Myr) and by computational scale (per-family DTL reconciliation is infeasible at GTDB). M22 reports the rank-LCA of leaves under each gain event, which is where the gain landed, not who donated it. 1
Further caveats at this milestone:
- The ribosomal class is documented as contaminated. The K02860-K02899 + K02950-K02998 strict range is bimodal (q25=0.11, median=18.83 on Sankoff/n_present), mixing universal r-proteins with clade-restricted accessory variants. Under M21, canonical clean housekeeping is tRNA-synth + RNAP core only, and ribosomal is informational only.
- AMR is excluded from the positive-control panel. Per M17, the bakta_amr substrate is Pseudomonadota-biased, with 49% of AMR UniRefs >50% Pseudomonadota at NB08c Diagnostic D. AMR appears in summaries as
info_amr(54.8% recent, 4.1% ancient) for transparency but is not load-bearing. - Phylogenetic non-independence is only partially addressed. KO aggregation collapses intra-Pfam-family UniRef duplication, and M19 cluster-bootstrap CIs handle function-class-level Cohen’s d. Per-(clade × KO) tuple-level CIs would need further bootstrap work and were deferred.
- Annotation-density residualization (D2) was not yet implemented at atlas level. Per-genome
annotated_fractionwas computed and stored but not regressed out of the (rank × KO) scores; P4-D5 later closed this, as recorded under D2 annotation-density residualization. - CPR / DPANN under-representation is acknowledged, and D3 effective-N reporting flags it per phase. 1
The milestone’s next steps were plans, not results:
- NB11, the Tier-1 regulatory-versus-metabolic diagnostic, was to join
p2_ko_atlas.parquet+p2_m22_acquisition_profile.parquetagainstp2_ko_pathway_brite.tsvfrom NB09. KOs would be categorized as KEGG BRITE B-level regulatory (09120 Genetic IP + 09130 Environmental IP) or metabolic (09100 Metabolism) and compared at FWER<0.05. The test as later run is recorded under Regulatory versus metabolic test (NB11). That section describes its categories by KEGG pathway ranges rather than BRITE identifiers; the report does not say whether category membership changed between the plan and the run. - NB12 was to filter the atlas to mycolic-acid pathway KOs (KEGG ko00540 + FAS-II + mycolyl transferase) and Mycobacteriota clades (or family
f__Mycobacteriaceae) and test Innovator-Isolated at q < 0.0125 (Bonferroni for 4 focal tests). - Phase 3 candidate selection was to take KOs with strong Producer × Participation signal (off-(low,low) at q<0.05 with Cohen’s d ≥ 0.3) and ≥2 distinct Pfam architectures. These would hand off to the Phase 3 architectural deep-dive (NB13–NB18), including the Cyanobacteria PSII Broker hypothesis at genus rank with composition-based donor inference. As recorded under NB16, that test was instead run donor-undistinguished.
- Phase 4 P4-D1 phenotype/ecology grounding was deferred. It was to cross-reference (clade × function-class) tuples against NMDC sample biomes, MGnify metagenomics studies, GTDB metadata isolation-source, BacDive metabolic phenotypes, Web of Microbes interaction data and Fitness Browser fitness phenotypes. At this stage these were prospective validation sources, not completed validation. 1
ADVERSARIAL_REVIEW_5.md raised 4 critical + 6 important + 3 suggested issues against the v1.8 milestone (Phase 2 atlas + M22 attribution + literature synthesis). According to the report, one important finding traced to a fabricated literature citation (verified via PubMed). Three critical findings restated concerns already addressed in REPORT v1.5–v1.8 / plan v2.7–v2.9, and two findings misframed defensible methodology. Two genuine new concerns, the small-n caveat and M22 biological-validation anchors, drove plan-level commitments. The fabricated item (I1 + biological-claims §1) cited Mendoza et al. 2020, “Hologenome evolution: mathematical model with horizontal gene transfer” (Microbiome 8:1, doi:10.1186/s40168-020-00825-5, PMID:32160912). The report says PMID 32160912 actually points to Rezaeipandari et al. (2020), a WHOQOL-OLD cross-cultural validation for Persian-speaking populations in Health and Quality of Life Outcomes 18(1):67, doi:10.1186/s12955-020-01316-0, unrelated to HGT. That verification is source-reported and was not independently checked here. 1
Phase 1A pilot, null-model diagnostics and run caveats
Pilot scope, substrates and readiness
The Phase 1A pilot subset was statistically informative but biologically narrow: 1,000 species across 110 phyla and 1,200 UniRef50s in 6 classes. The report said Phase 1B at full GTDB scale (27,690 species, all UniRef50s) was needed for headline atlas verdicts. At the pilot close, the substantive hypotheses were untested: Bacteroidota PUL Innovator-Exchange, Mycobacteriota mycolic-acid Innovator-Isolated, Cyanobacteria PSII Broker, and Alm 2006 reproduction at higher resolutions all required the corresponding phase to run. The report also stated that the atlas was not yet a hypothesis-generating resource, because per-clade × function quadrant verdicts needed the full GTDB UniRef50 atlas of Phase 1B. The methodology revisions M1–M4 were pre-Phase-1B, so their effect was untested until Phase 1B execution. Phase 1 made no direction inference: it was acquisition-only by plan design, and direction at genus rank was reserved for the Phase 3 architectural deep-dive. 1
The pilot drew on kbase_ke_pangenome tables. genome, gtdb_species_clade, gtdb_taxonomy_r214v1, gtdb_metadata and pangenome formed the core scaffold for species, taxonomy, quality and pangenome size. eggnog_mapper_annotations supplied KO, COG (clusters of orthologous groups), KEGG_Pathway, BRITE and PFAMs, the last serving as a domain-name fallback for control detection. interproscan_domains was the authoritative Pfam annotation source for accession-based control detection. The paralog fallback (n_gene_clusters when UniRef90 is absent) covered 21.5% of presence rows, and the report asked Phase 1B to report with-and-without-fallback sensitivity. CPR / DPANN under-representation is an acknowledged scope limit per RESEARCH_PLAN.md, which the report calls a substrate constraint rather than a Phase 1A failure. 1
Phase 1A pilot data artifacts (file; rows; description):
data/p1a_pilot_species.tsv: 1,000; phylum-stratified species sample with quality + annotation density.data/p1a_pilot_uniref50.tsv: 1,200; UniRef50 pilot pool with control_class + IPR/GO/pathway enrichment.data/p1a_pilot_extract.parquet: 6,638; (species, UniRef50) presence + paralog count.data/p1a_null_producer_lookup.parquet: 876; per-(rank, clade, prevalence-bin) cohort moments.data/p1a_null_consumer_lookup.parquet: 4,800; per-(rank, UniRef50) consumer z-score.data/p1a_uniref_prevalence_bin.tsv: 6,000; per-(rank, UniRef50) prevalence bin.data/p1a_pilot_scores.parquet: 9,201; per-(rank, clade, UniRef50) producer + consumer z-scores.data/p1a_control_validation.tsv: 30; per-(rank, control_class) score summary with pass/fail verdicts.data/p1a_alm_2006_pilot_backtest.tsv: 5; per-rank Alm 2006 TCS HK reproduction summary.data/p1a_extraction_log.json,data/p1a_null_diagnostics.jsonanddata/p1a_pilot_atlas_diagnostics.json: 1 each; NB01, NB02 and NB03 audit logs.data/p1a_phase_gate_decision.jsonanddata/p1a_phase_gate_summary.md: 1 each; the NB04 formal gate verdict and human-readable gate document. 1
The pilot figure table describes p1a_null_producer_distribution.png as the producer null cohort distribution by prevalence bin (sanity check). It describes p1a_null_consumer_distribution.png as consumer null permutation distribution shapes (single-rank version, superseded) and p1a_paralog_count_distribution.png as the paralog count distribution by control class (sanity check). p1a_null_per_rank_distributions.png shows per-rank producer cohort sizes + consumer z-distributions (the multi-rank story). p1a_scores_by_class_per_rank.png holds violin plots of producer + consumer z by control class per rank (the headline distribution figure). figures/p1a_producer_consumer_per_rank.png is the Producer × Consumer scatter per rank, colored by control class (the atlas-style view). 1
Two further computational caveats come from the Reproduction section. JupyterHub idle-timeout runs ~17–25 min, and the workaround is .ipynb → .py + nohup + intermediate parquets (used for NB10, 10b, 26). The driver heap ceiling defaults to -Xmx4g and is raised via environment for heavy coalesce writes. The report offers these as reusable patterns for future BERIL projects working at similar scale (1B-row table joins + 28M-row species-level data + 17M event attribution). 1
Pilot producer-null calibration and the TCS HK power analysis
The pilot formulated a multi-rank Producer × Participation null-model framework for clade-level innovation atlases on UniRef50-scale substrates. It paired a clade-matched neutral-family producer null with a parent-rank dispersion permutation consumer null, and the report says both were formulated, calibrated and validated at pilot scale. The consumer null was later replaced by Sankoff parsimony, as described elsewhere on this page. The natural_expansion class served as the producer positive control: 200 UniRef50 clusters with documented within-species paralog count ≥ 3 and cross-species presence in ≥ 5 pilot species. It showed positive producer z-scores at all five ranks, with effect size growing monotonically with rank. Producer z mean (95% CI; n):
- genus: +0.13 σ [0.08, 0.18]; 975.
- family: +0.19 σ [0.13, 0.26]; 802.
- order: +0.31 σ [0.22, 0.39]; 654.
- class: +0.50 σ [0.38, 0.61]; 482.
- phylum: +0.55 σ [0.43, 0.67]; 457. The report reads this as validating that the clade-matched neutral-family null detects real paralog expansion above cohort baseline. Without that signal, all subsequent Phase 1A scoring would rest on a null model unable to discriminate signal from noise. 1
Pilot paralog comparisons by rank and control class (n; observed mean paralogs; cohort mean; raw difference; percent difference; producer z):
- phylum natural_expansion: 457; 1.77; 1.27; +0.50; +39.5%; +0.55.
- phylum pos_tcs_hk: 186; 1.07; 1.30; −0.24; −18.4%; −0.23.
- phylum neg_ribosomal: 315; 1.04; 1.18; −0.13; −11.4%; −0.15.
- phylum neg_rnap_core: 284; 1.01; 1.20; −0.18; −15.2%; −0.24.
- phylum neg_trna_synth: 248; 1.02; 1.20; −0.18; −15.0%; −0.19.
- phylum pos_amr: 272; 1.17; 1.34; −0.17; −12.6%; −0.16.
- class natural_expansion: 482; 1.74; 1.28; +0.46; +36.0%; +0.50.
- order natural_expansion: 654; 1.56; 1.28; +0.28; +22.3%; +0.31.
- family natural_expansion: 802; 1.45; 1.27; +0.18; +14.3%; +0.19.
- genus natural_expansion: 975; 1.31; 1.20; +0.11; +9.3%; +0.13. 1
At phylum rank, natural_expansion UniRefs had 39.5% more paralogs than the cohort baseline (1.77 vs 1.27 paralogs per phylum). The negative controls (ribosomal, tRNA-synth, RNAP) sat ~12–15% below cohort baseline, which the report calls the dosage-constrained signature. TCS HK at UniRef50 sat 18% below cohort, the opposite direction from the Alm 2006 family-level expansion claim. 1
The report gives a power analysis for detecting a positive TCS HK effect at α=0.05 with a one-sided t-test (rank; n; minimum detectable d at 80% power; observed z; power if the Alm 2006 effect were d=0.3; power if d=0.5):
- genus: 73; 0.29; −0.10; 0.81; 0.99.
- family: 124; 0.23; −0.16; 0.95; 1.00.
- order: 157; 0.20; −0.19; 0.98; 1.00.
- class: 174; 0.19; −0.23; 0.99; 1.00.
- phylum: 186; 0.18; −0.23; 0.99; 1.00. 1
On this analysis, HK paralog expansion at any biologically interesting effect size (d ≥ 0.3) at UniRef50 resolution would have been detected with 81–99% probability at all ranks. It was not: the observed z was consistently negative, indicating slight under-expansion. The report says this rules out underpowering as the explanation. In its account, TCS HK paralog signal is genuinely absent (and slightly negative) at UniRef50, the original Alm 2006 effect lives at family resolution where a single HK family aggregates many UniRef50s, and the substrate-hierarchy argument is the right interpretation. That resolution-dependence is the report’s interpretation of a null result. 1
Pre-registration discipline and planned Phase 1B additions
The adversarial reviewer noted that revising the negative-control criterion (“near zero” → ”≤ 0 with CI not strongly positive”) after seeing data weakens pre-registration discipline, and the report calls this a fair pre-registration concern. Its framing is that the dosage-constraint biology on housekeeping genes (Andersson 2009; Bratlie et al 2010 for ribosomal proteins) was anticipated during plan v2 design, but its quantitative consequence (negative producer z, not zero) was not encoded into the pre-registered criterion. On that account M2 corrects a pre-registration omission rather than redefining a target. The prior expectation of no paralog expansion is preserved and tightened to “should not show paralog expansion AND should show dosage-constraint suppression”. The report says a future Phase 1B / Phase 2 plan should pre-register this corrected expectation, not the original one. The M2 revision remains a data-driven, post-hoc change. 1
The report called the reviewer’s C1 (“no concrete multiple-testing strategy”) partially overcalled, because plan v2.1 has a hierarchical Tier-1 / Tier-2 / Tier-3 strategy. It accepted that implementation details remained TBD at that stage. These were the BH-FDR (Benjamini–Hochberg false discovery rate) variant and the effective-N for KEGG-BRITE × GTDB-family clusters, which it called a real Phase 1B/2 deliverable. Phase 1B NB02 was assigned to specify the BH-FDR variant + effective-N within KEGG BRITE × GTDB family. The report called the “render meaningful discoveries impossible” framing hyperbole given the strategy. 1
Two additions were planned for Phase 1B. The first was a known-HGT positive control set for the consumer null (addressing C2). AMR was the closest current control, but the parent-phylum anchor masks intra-phylum HGT (M1). Phase 1B therefore added specific β-lactamase families with documented cross-phylum spread (CARD bla group) and class-I CRISPR-Cas systems (Pfam family), per Metcalf et al 2014’s documented cross-tree-of-life HGT. The second promoted PIC (phylogenetic independent contrasts) from an optional Phase 2 sensitivity in plan v2 to mandatory at Phase 1B for consumer-null and producer-null score reporting (addressing I1). This plan is in tension with the final review closure recorded below, which lists I3 as an open limit because no PIC correction was implemented. The report does not reconcile the two. 1
The pilot’s next-step plan named the later tests as pre-registered hypotheses, not results:
- Phase 1B: Bacteroidota → Innovator-Exchange on PUL CAZymes (deep-rank category).
- Reproduce Alm 2006 TCS HK paralog expansion at KO level (one of two canonical reproductions per the v2 plan).
- Phase 2: Mycobacteriota → Innovator-Isolated on mycolic-acid pathway.
- Phase 3: Cyanobacteria → Broker on PSII architectures (genus rank, with donor inference). The NB16 test recorded below was instead run donor-undistinguished, with support at class rank. 1
Phase 1B full-scale results
At this report stage Phase 1B was complete with gate verdict PASS_REFRAMED, and Phases 2–4 were in planning. Phase 1B applied methodology revisions M1–M4 at full GTDB scale: 18,989 bacterial GTDB representatives × 100,192 targeted UniRef50s (10K-per-class cap) → 1.54 M (species, UniRef50) presence rows → 1.29 M (rank, clade, UniRef) producer scores. Wall time was ≈ 1 hour total across NB05–NB08. The 1.54 M presence-row count differs from the 28M (species, UniRef50) presence rows listed for data/p1b_full_extract_local.parquet in the data inventory, and the report does not reconcile the two. 1
The producer null was responsive at GTDB scale. The natural_expansion class (UniRefs with documented within-species paralog count ≥ 3 in ≥ 5 species) showed monotone-growing positive producer z across all 5 ranks, which the report calls stronger than at pilot scale. Producer z mean; raw paralog above cohort:
- genus: +0.13 σ; +9.3 %.
- family: +0.19 σ; +14.3 %.
- order: +0.31 σ; +22.3 %.
- class: +0.77 σ; +55.2 %.
- phylum: +0.89 σ; +64.5 %. Negative controls (ribosomal / tRNA-synth / RNAP core) sat ~12 % below cohort with z ≈ −0.15, the dosage-constrained signature M2 anticipates (Notebooks 06, 07). 1
The M1 fix stratified the consumer-null parent rank per child rank rather than always using phylum. It produced the rank gradient that Phase 1A’s parent-phylum-only anchor had masked (child rank; M1 parent rank; informative consumer z mean):
- genus: family; −10.48.
- family: order; −6.40.
- order: class; −4.18.
- class: phylum; −1.84. The Phase 1A parent-phylum anchor had produced a flat-then-jump pattern (≈−4 σ at deep ranks, −1.36 at class), whereas M1 shows the gradient is monotone (Notebook 06). This parent-rank dispersion metric was later replaced by Sankoff parsimony (M14). 1
The pre-registered Phase 1B hypothesis was that Bacteroidota is Innovator-Exchange (high producer + high participation) for PUL CAZyme UniRef50s. Innovator-Exchange was operationalised as “both producer and consumer 95 % CI lower bound > 0”. By that criterion the hypothesis was falsified at all 4 deep ranks (0/4 supported). The report calls the absolute-zero criterion over-stringent at UniRef50 resolution. A relative threshold revealed a graded HGT signal: at family→order parent rank, CAZymes (hyp_cazyme) showed +0.78 σ less clumping than ribosomal proteins (median consumer z = −6.21 vs −6.99; Mann-Whitney U one-sided p = 1 × 10⁻⁴³). Bacteroidota PUL CAZymes specifically showed producer z ∈ [−0.07, −0.10] across deep ranks (95 % CIs entirely below zero) and consumer z ∈ [−9.3, −2.8] at parent ranks. Both legs of Innovator-Exchange therefore failed by the absolute criterion. By the relative criterion, CAZymes still discriminated from housekeeping genes, but Bacteroidota CAZymes showed no additional lift relative to other phyla’s CAZymes. figures/p1b_bacteroidota_pul_position.png shows Bacteroidota PUL position against other phyla’s CAZymes per rank. This parent-rank relative diagnostic is separate from the later Sankoff relative signal (Cohen’s d = 0.15) recorded under the hypothesis verdicts. 1
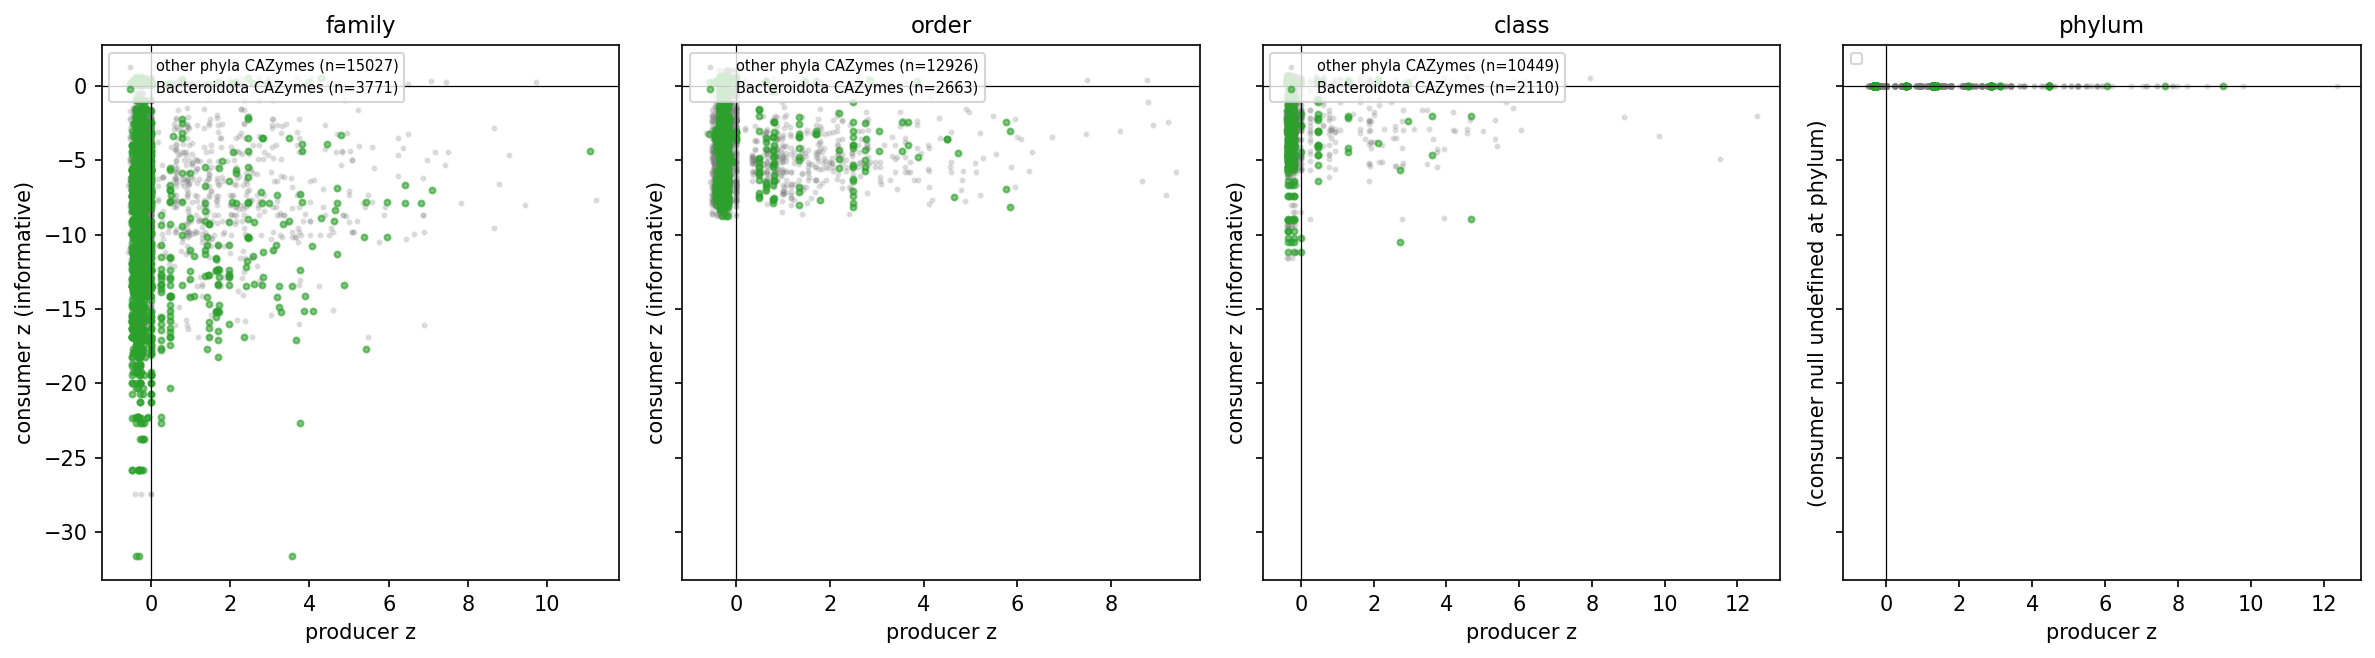 Bacteroidota PUL position vs other phyla CAZymes per rank. From gene_function_ecological_agora.
The pre-registered cross-phylum HGT positive controls (β-lactamase + class-I CRISPR-Cas, plan v2.3 HIGH 1) all sat at strongly negative absolute consumer z, meaning they were clumped at parent ranks. A relative-threshold diagnostic at family rank gave a different picture (class; median consumer z; Δ vs neg_ribosomal; one-sided MW p):
- pos_amr: −7.37; −0.37; 0.94.
- pos_tcs_hk: −6.57; +0.43; 5×10⁻⁴.
- pos_betalac: −6.37; +0.62; 5×10⁻⁸.
- pos_crispr_cas: −5.81; +1.18; 1×10⁻⁸⁰. β-lactamase and class-I CRISPR-Cas discriminated from housekeeping genes by 0.6–1.2 σ. The AMR control (the bakta_amr set, dominated by clade-specific resistance variants) did not, which the report attributes to bakta_amr’s inherent narrowness rather than to methodology failure. The report says the gate document’s “HIGH 1 known-HGT controls fail” framing overstates: the controls fail the absolute Innovator-Exchange threshold but pass the relative-discrimination diagnostic. Its Phase 2 framing was that HGT signal is real at UniRef50 but small in magnitude, and KO aggregation was expected, not yet shown, to amplify it. The diagnostic (Notebook 08b) was captured at user request after the original Phase 1B narrative proved over-pessimistic. 1
The report calls one diagnostic pattern genuinely unexpected. At order rank (parent = class), positive HGT controls had median consumer z = −4.51 versus −3.69 for negative controls. Positive controls were thus more clumped than negatives, the opposite of expectation (Mann-Whitney U one-sided p = 1.0, no discrimination in the expected direction). One proposed explanation was that order rank has only 689 clades and 245 parent classes, and that this small parent-clade count may inflate null variance for the consumer-null permutation; this was a possibility, not a demonstrated cause. The report records the substrate-hierarchy claim as a partial confirmation. A tree-aware metric (Sankoff parsimony, NB08c, which the report calls the canonical Alm-2006-style approach) recovered the expected direction (positive HGT > negative housekeeping at p = 2.1×10⁻⁵), and the report treats the order-rank anomaly as a metric artifact. However, the effect size at UniRef50 was small (Cohen’s d = 0.146 on Sankoff). Phase 2 KO aggregation had to amplify it to d ≥ 0.3 to validate the substrate-hierarchy reasoning; otherwise an M11 reconciliation-based redesign (gene-tree vs species-tree, AleRax sub-sampling) would trigger. The later M18 outcome is recorded under Methodological contributions. 1
Phase 1B diagnostic resolution (NB08b/NB08c) and the first Phase 2 KO gate
At its close Phase 1B carried the verdict PASS_REFRAMED + qualified. The report judged the methodology not broken, but the substrate-hierarchy framing became an empirical bet on Phase 2 amplification rather than an established conclusion, and the project entered Phase 2 with a sharp falsifiable test. The closure’s methodology summary reported three results. Multi-rank null-model construction works at full GTDB scale. M1 rank-stratified parent ranks give a clean monotone clumping gradient. The producer null is responsive: the natural_expansion class showed +64.5 % paralog above cohort at phylum, p ≈ 10⁻⁸⁰. Full-scale per-rank null distributions and per-class scores are shown in figures/p1b_null_per_rank_distributions.png and figures/p1b_scores_by_class_per_rank.png. 1
Reviewer item I8 set this +64.5% against a recomputed +39.4%. The report calls that a phase-mixing error. The +39.4% figure uses the Phase 1A pilot means (obs_mean = 1.77, cohort_mean = 1.27), whereas +64.5% is the Phase 1B full-scale figure (obs_mean = 2.09, cohort_mean = 1.27). Both are correctly computed at their own scale. The report reads the pilot-to-full-scale increase, which it writes as +39.5% → +64.5%, as methodology validation. The reviewer’s +39.4% and the report’s +39.5% for the same pilot comparison are both recorded as written. 1
The Phase 1B closure stated that the pre-registered hypothesis (Bacteroidota → Innovator-Exchange on PUL CAZymes) was falsified, failing at all 4 deep ranks under the absolute-zero criterion. The NB08b relative-threshold diagnostic showed that CAZymes do discriminate from housekeeping (+0.78 σ at family rank, p = 1×10⁻⁴³). In Cohen’s d terms, however, the discrimination is small (≈ 0.07–0.09), below biologically meaningful effect sizes. The report states that the hypothesis is genuinely not supported at UniRef50 resolution and that this is not a methodology save. It adds that the PUL hypothesis remains falsified by either criterion, because the relative-threshold framing changes only how control-class behaviour is described, not the hypothesis-test outcome. This Phase 1B wording differs from the final synthesis’s “qualified pass” label recorded under the hypothesis verdicts. 1
A reviewer cited literature on rapid CAZyme HGT (horizontal gene transfer). The report replies that this counter-evidence describes transfer at the PUL/family aggregation level, not at the UniRef50 sequence-cluster level. On its reading, the UniRef50-level falsification is consistent with that literature: family-level CAZyme HGT exists but operates on aggregated functional units, so the two differ in substrate resolution rather than necessarily in biology. 1
NB08b’s broader reading was that HGT signal is detectable at UniRef50. CAZymes, β-lactamases and class-I CRISPR-Cas all showed +0.6 to +1.2 σ less clumping than housekeeping at family rank, with p << 10⁻⁷. The signal magnitude is small, well below the absolute Innovator-Exchange threshold that the Phase 1B hypothesis pre-registered. The report kept the substrate-hierarchy reasoning in a softer form. It expected KO aggregation to produce much larger effect sizes by collapsing sequence-cluster-specific clade restriction. If amplification failed, the consumer-null methodology itself might need replacing (M11: direct phyletic-incongruence on KO presence/absence instead of parent-rank dispersion). 1
The page records above one explanation for the order-rank inversion: the small number of parent clades. The report also proposed a second possibility. Intra-phylum HGT-active genes may cluster within a few orders inside a single phylum, which would make them more clumped at parent = class than housekeeping genes, which spread to many classes. The report offered this as a possible explanation and did not test it. 1
Revision M12 (new at plan v2.4) made HGT-class-versus-housekeeping deltas a primary atlas metric alongside absolute consumer z. At deep ranks it operationalised Innovator-Exchange as ”≥ X σ less clumped than housekeeping at the rank’s parent” rather than “absolute consumer z > 0”. X was to be calibrated empirically from Phase 2 data. 1
The NB08c diagnostic followed a close-reading of Alm, Huang & Arkin 2006 (docs/alm_2006_methodology_comparison.md), which the report says revealed three load-bearing misreadings:
- Alm 2006 never named “producer/consumer” or four-quadrant categories. It reported a correlation r = 0.74 between HPK count and recent-LSE fraction. The four-quadrant Open/Broker/Sink/Closed framework is the project’s own construction.
- It worked at the single-domain level (IPR005467 / COG4582), which is comparable to UniRef50, not at “family aggregation”.
- It used phylogenetic-tree-aware reconciliation, not parent-rank dispersion. The substrate-hierarchy claim was therefore reformulated from “UniRef50 is too narrow, aggregate to KO” to “we used the wrong metric on the right substrate”. M14 reframed the project’s relationship to Alm 2006 from “generalizing” to “Alm-2006-inspired”, and M15 made Sankoff parsimony (a lightweight tree-aware metric) mandatory. The report’s lesson is that anchor papers must be close-read for exact methodology before infrastructure is built on extrapolations from them. This correction refines the pilot TCS HK reasoning recorded above, which had placed the Alm 2006 effect at family resolution. 1
The report documents the anchor’s prominence in its rebuttal of REVIEW_4 C1, which claimed that Alm 2006 was uncited. Alm 2006 is the first reference in references.md (line 9, “Methodological anchor” section) and is referenced ≥30 times across DESIGN_NOTES.md. It has a dedicated 460-line memo at docs/alm_2006_methodology_comparison.md, linked from the README. It is also cited in REPORT.md’s Phase 1B Diagnostic Resolution section (v1.3) under M14. 1
Diagnostic NB08c ran sankoff parsimony on the GTDB-r214 tree. It tested whether the order-rank anomaly was a metric artifact of parent-rank dispersion or a methodology failure. The result was a metric artifact: Sankoff recovers the expected direction, with positive HGT above negative housekeeping at p = 2.1×10⁻⁵. Headline panel C plots Sankoff parsimony score / n_present_leaves per UniRef. In it, positive HGT classes (TCS HK, β-lactamase, CAZymes) sit above housekeeping classes (ribosomal, tRNA-synth, RNAP), with Cohen’s d = 0.15 (small effect; p = 2.1×10⁻⁵). The four panels are in figures/p1b_metric_diagnostic_panels.png. 1
The other NB08c panels were diagnostic:
- Panel A shows K = n_clades_with at order rank per class. Both positive HGT and negative housekeeping classes have median K = 1, so UniRefs are clade-restricted regardless of class. The distributions differ statistically (p < 10⁻¹⁹), but the medians are the same, so K bias does not explain the order-rank anomaly.
- Panel B shows within-pseudomonadota dispersion (n_pseudo_families / n_pseudo_species). Positive controls have lower dispersion than negative housekeeping (pos median 0.25, neg median 0.33). The report judged the metric biased by class coverage and dropped it. Its reasoning was that housekeeping genes are pan-Pseudomonadota, whereas HGT-active classes are clade-specific within the phylum.
- Panel D shows the Pseudomonadota fraction per UniRef. Only AMR is strongly Pseudomonadota-biased (median 50 %; 49 % of AMR UniRefs >50 % Pseudomonadota), and all other classes are ≤ 4 % median. The report calls this an AMR detection-bias confound, because bakta_amr is sourced from the Pseudomonadota-heavy reference set of amrfinderplus. 1
NB08c median Sankoff/n_present by class, with the report’s annotation:
- none (random atlas baseline): 24.5; top, because random sparse-presence UniRefs require many gains.
- pos_tcs_hk: 19.75; above housekeeping.
- pos_betalac: 19.0; above housekeeping.
- hyp_cazyme: 19.0; above housekeeping.
- neg_rnap_core: 17.5; an inversion, with RNAP ranking above CRISPR-Cas (small).
- pos_crispr_cas: 17.0.
- neg_trna_synth: 14.0.
- neg_ribosomal: 12.8; correctly the lowest housekeeping class.
- pos_amr: 12.0; anomalously low, which the report attributes to Pseudomonadota detection bias.
- natural_expansion: 4.5; correctly the lowest (broad conservation by selection). 1
The report drew four conclusions from NB08c:
- The effect size at UniRef50 remains small. Cohen’s d = 0.15 is well below the d ≥ 0.3 threshold pre-registered for atlas-grade discrimination. The “+0.6 to +1.2 σ less clumped than housekeeping” framing in REPORT.md v1.2 was in parent-rank z-units, not Cohen’s d, and overstated the effect magnitude.
- The softened substrate-hierarchy reading still holds: HGT signal at UniRef50 is real but small. KO amplification is now an empirical claim that Phase 2 must demonstrate, not a substrate-hierarchy guarantee.
- The within-phylum dispersion metric (Diagnostic B) was wrong, because it tracked class coverage rather than HGT activity. The right within-phylum analog is per-phylum Sankoff parsimony.
- AMR is a confounded positive control and should be excluded from the Phase 2 positive-control panel, leaving β-lactamase, CRISPR-Cas and TCS HK. This Pseudomonadota-detection explanation for AMR differs from the Phase 1B relative-threshold passage above, which attributed AMR’s failure to the narrowness of bakta_amr. The report does not reconcile the two. 1
Two revisions followed. M16 made Sankoff parsimony on the GTDB-r214 tree topology the primary atlas metric for Phase 2 and demoted parent-rank dispersion to diagnostic only. As noted elsewhere on this page, other passages credit this replacement to M14 or M15. M18 (plan v2.6) set a hard amplification gate: the Phase 2 KO atlas had to show Cohen’s d ≥ 0.3 on Sankoff parsimony for at least one positive HGT control class versus negative housekeeping. The UniRef50 baseline is stated as d = 0.15 in one passage and as d = 0.146 from NB08c in another. If the gate failed, the substrate-hierarchy claim would be falsified and the M11 redesign would trigger. That redesign is a switch from Sankoff to gene-tree-versus-species-tree reconciliation, per Phase 3’s original sub-sample reservation, with AleRax sub-sampling named as the route. The report calls this a falsification gate, not a validated prediction. 1
The report records several lessons as pre-registration omissions:
- Negative-control criterion. The v2 criterion specified “producer mean within ±1σ of zero” for housekeeping classes. The pilot showed all three negative controls at producer z ≈ −0.15 (CIs entirely below zero), and the criterion was revised post-hoc to “CI upper bound ≤ 0.5”. The lesson drawn is that a known biological prior should be encoded in the criterion text.
- Absolute-zero Innovator-Exchange definition. Plan v2 defined Innovator-Exchange as “both producer and consumer 95 % CI lower bound > 0”. All positive controls (β-lactamase, CRISPR-Cas, AMR, TCS HK) sat at strongly negative consumer z and failed it. The report says a post-gate diagnostic (NB08b) nonetheless showed positive HGT classes +0.6–1.2 σ less clumped than housekeeping at family rank (p << 10⁻⁷). By the family-rank table above, that range holds for β-lactamase and class-I CRISPR-Cas; TCS HK separated by only +0.43 (p = 5×10⁻⁴), and AMR did not separate in the expected direction (−0.37; p = 0.94). M12 recalibrated the criterion against an empirical housekeeping baseline, post hoc.
- Origin of the revisions. The report says most revisions originated in genuine biology engagement (M2 dosage cost, M14 Alm 2006 close-reading, M17 Pseudomonadota AMR bias) rather than data accommodation. It concedes that the cumulative count shows pre-registration was insufficiently calibrated against substrate-resolution behavior.
- Corrective discipline. Before invoking substrate, methodology or “we need more data” explanations, run a focused diagnostic first. NB04b, NB08b and NB08c together took ~3 hours to write and ran in seconds-to-minutes. They dispositively distinguished metric/criterion problems from methodology failures. 1
The first Phase 2 step pulled KO assignments for Phase 1B’s 18,989 species from kbase_ke_pangenome.eggnog_mapper_annotations.KEGG_ko in the KBase Data Lakehouse:
- 103,629,867 gene clusters across the 18,989 species.
- 74,450,297 eggNOG-annotated clusters (71.8% annotation rate).
- 43,803,890 (gene_cluster, KO) edges after parsing the comma- /
ko:-prefixedKEGG_kofield. - 13,062 unique KOs.
- 28,008,764 (species, KO) presence rows after aggregation, with paralog count = distinct UniRef90s per (species, KO).
- 3,592,556 UniRef50s with a dominant KO (median dominant-fraction = 1.0; q25 = 0.97, which the report calls a clean projection).
- 748 control-panel KOs by description-match: 310 TCS HK, 110 β-lactamase, 6 CRISPR-Cas, 249 ribosomal, 54 tRNA-synth and 19 RNAP core.
The full assignment parquet (1.4 GB) went to MinIO, and a 2.69 MB control-panel subset (
p2_ko_assignments_panel.parquet) was kept locally. On this JupyterHub setup Spark Connect does not share a filesystem between workers and driver, so atlas-scale parquets are MinIO-only. 1
The first-pass M18 test is shown in figures/p2_m18_amplification_panel.png. Sankoff parsimony was scored on the GTDB-r214 species tree, pruned to 18,989 P1B leaves, for all 748 panel KOs in 11 seconds. Pairwise Cohen’s d came with what the report labels M19 cluster-bootstrap CIs, implemented as B = 200 with KO-level resampling within class. That implementation differs from M19 as bound in plan v2.7, which specified cluster-bootstrap on UniRefs at Pfam-family granularity (B = 200 resamples per function class); the report does not reconcile the two. The result was 0/9 pairs PASS on the d ≥ 0.3 + CI lower-bound > 0 threshold. The best pair reported, pos_betalac vs neg_trna_synth, had d = +0.2118 (95% CI [−0.138, +0.531]) and a one-sided (greater) Mann–Whitney p = 1.1×10⁻⁵. The signed direction reversed against expectation for the ribosomal and RNAP core comparisons (d = −0.66 to −2.97). 1
First-pass class medians (n KOs; median Sankoff/n_present; median n_present_leaves):
- neg_rnap_core: 19; 14.50; —.
- neg_ribosomal: 249; 11.35; ~29.
- pos_betalac: 110; 2.64; 390.
- pos_crispr_cas: 6; 2.04; 1499.
- pos_tcs_hk: 310; 1.47; 918.
- neg_trna_synth: 54; 0.30; —. 1
The report calls the neg_ribosomal median n_present ≈ 29 leaves (out of 18,989) the smoking gun, because genuine universal r-proteins should be present in essentially all species. The description-match rule LOWER(ipr_desc) LIKE '%ribosomal protein%' had filled the class mostly with clade-restricted accessory r-proteins. These included RimM, RbfA, processing factors, silencing factors and false matches to mitochondrial ribosomal proteins. This contamination motivated the strict-class retest shown in figures/p2_m18c_strict_class_panel.png, whose PASS outcome under M21 strict housekeeping is recorded under Methodological contributions. 1
Null-model and control diagnostics
The Phase 1A pilot null producer distribution (figures/p1a_null_producer_distribution.png, notebook 02_p1a_null_model_construction.ipynb) visualizes the producer-z null. That null is a per-rank, prevalence-bin, clade-matched neutral-family permutation null (M5/M6). Cohort moments, the mean and standard deviation of paralog count, were computed per (rank, prevalence_bin) from neutral-family UniRef50s in the same cohort. All bins have ≥30 cohort members at all 5 ranks, which the report takes as validating that producer-z scoring against this null is statistically tractable. 1
The Phase 1A pilot null consumer distribution (figures/p1a_null_consumer_distribution.png, same notebook) shows the single-rank consumer-z permutation null on UniRef50 prevalence patterns. It has a unimodal null shape per rank, with distinct shapes per rank, which the report reads as making consumer-z comparable across ranks. The figure is kept for provenance only. Its description says it was superseded by the per-rank null in NB02 Phase 1A v1.1 plus the Phase 1B M16 Sankoff diagnostic. The same description also says it was superseded by the NB08c Sankoff parsimony diagnostic (M14), which uses tree-aware reconciliation. The source names M16 in one clause and M14 in the other, and the Phase 1A figure list later on this page credits M14. 1
The Phase 1A pilot paralog count distribution by class (figures/p1a_paralog_count_distribution.png, notebook 01_p1a_pilot_data_extraction.ipynb) is a sanity check run before scoring, on the 1K species × 1.2K UniRef50 pilot. natural_expansion showed the wide distribution expected of paralog-rich families. The positive controls (AMR, CRISPR-Cas) showed modest paralog inflation. The negative controls (ribosomal, tRNA-synthetase, RNAP core) clustered tightly at 1 paralog, consistent with single-copy housekeeping. 1
Ribosomal proteins, tRNA synthetases and RNAP core subunits all showed negative producer z (−0.15 to −0.24 σ across ranks; 95% CIs entirely below zero), so the pre-registered “near zero” criterion failed. The report calls the result biologically correct, because dosage-constrained genes carry fewer paralogs than typical genes at matched prevalence (Andersson 2009; Bratlie et al 2010 for ribosomal proteins). It treats this as methodology revision M2, not a methodology failure: the producer null distinguishes dosage-constrained genes from typical paralog-expansion patterns. The dosage explanation is the report’s literature-based interpretation. 1
In the pilot, the consumer z-score compared parent-phylum dispersion with a permutation null, for UniRef50s in ≥ 3 clades (the informative subset). Mean consumer z by rank (n_informative; report’s interpretation):
- genus: −3.77 (423); strong vertical inheritance.
- family: −3.95 (329); strong vertical inheritance.
- order: −4.10 (267); peak vertical clumping.
- class: −1.36 (172); clumping weakens. 1
The report calls this the first interpretable biological pattern in the atlas. At class rank, UniRef50 dispersion approaches the random-permutation null. The report reads this as consistent with cross-class HGT becoming detectable above noise; it is consistency, not direct evidence of transfer. From genus through order, vertical inheritance dominates. The report aligns the pattern with literature that most prokaryotic HGT happens within phylum boundaries (Smillie et al 2011; Soucy et al 2015 review) and that cross-phylum HGT is rarer and biased toward specific function classes (Hooper et al 2007). That alignment is literature context, not an additional pilot measurement. 1
AMR showed strongly negative consumer z (−4.4 to −4.8) under parent-phylum dispersion at genus, family and order ranks. The report does not read this as absence of HGT. AMR is a documented intra-phylum HGT phenomenon (Forsberg et al 2012 for the soil resistome; Smillie et al 2011 for the gut microbiome). In the report’s account it is intense within pseudomonadota or Bacillota and rare across phyla. A null that measures cross-phylum dispersion therefore makes intra-phylum HGT look clumped, so the parent-phylum anchor masks the signal. The report cites Forsberg 2012 as context for the AMR intra-phylum HGT pattern that motivated M1. 1
The pilot TCS HK producer back-test was null. Two-component-system histidine kinase UniRef50 clusters had mean producer z ≈ −0.2 across all ranks, with only 4–11% above zero (rank: UniRef50s scored; positive z; above 2σ; mean producer z):
- genus: 73; 8 (11%); 2; −0.10.
- family: 124; 8 (6%); 2; −0.16.
- order: 157; 7 (4%); 3; −0.19.
- class: 174; 9 (5%); 2; −0.23.
- phylum: 186; 9 (5%); 2; −0.23. 1
The report calls this a negative result for Alm 2006 reproduction at sequence-cluster resolution, not a methodology failure. Alm, Huang & Arkin (2006) measured paralog expansion at the HK family level, as the number of distinct HK genes per genome. A UniRef50 typically corresponds to a single HK protein variant and cannot aggregate to the family. The report says the pilot validates the plan’s substrate hierarchy. Under that hierarchy, Alm 2006 reproduction was pre-registered at Phase 2 (KO-level aggregation; KEGG ko02020) and Phase 3 (Pfam multidomain architecture census, the resolution Alm 2006 actually used). The null rules out the simpler reading that any sequence-cluster-level methodology will reproduce Alm 2006. Phase 1A thus used Alm 2006 as a back-test target deferred to Phase 2/3, and Smillie 2011 as literature context for the cross-rank consumer-z trend. 1
A mid-pilot audit found that kbase_ke_pangenome.interproscan_domains had not been used in v1. The table holds 146 M Pfam hits across 132.5 M cluster representatives (83.8 % cluster coverage). The data-sources section below gives InterProScan Pfam as 833M hits at the same 83.8% cluster coverage, and the report does not reconcile the two hit counts. v1 control detection had relied on eggnog_mapper_annotations.PFAMs, which stores domain names (HisKA) rather than accessions (PF00512). That made it unsuitable as the sole accession-based control substrate. 1
Taking the union with InterProScan accessions increased the detected controls (v1 eggNOG name match → v2 union; gain):
- Ribosomal proteins: 9,005 → 19,389 UniRef50s; 2.2×.
- tRNA synthetases: 5,640 → 8,514; 1.5×.
- TCS HKs: 38,488 → 43,217; 1.1×. 1
At the biological level, 4 of 5 controls reached 100% pool coverage across pilot species. Only AMR failed the 80% threshold, at 68.8%, which the report calls biologically expected because environmental and uncultivated lineages carry less AMR. The v1 implementation went through 8 iterations of bug-fixing before the substrate audit. Results stabilized once the pipeline switched to InterProScan. The report draws the lesson to audit substrate before implementing, not after debugging. 1
The Phase 1A gate recorded four revisions:
- M1 made the consumer-null parent ranks rank-stratified (genus → family parent, family → order parent, order → class parent, class → phylum parent), so that the null is sensitive to HGT events at the rank where they occur.
- M2 set the negative-control criterion as CI upper ≤ 0.5, not “near zero”.
- M3 confirmed that Alm 2006 reproduction was deferred to Phase 2/3.
- M4 accepted the paralog fallback (option a), with sensitivity reporting. 1
The M2 gate threshold is more specific than the pilot prose, which gives the corrected criterion as ”≤ 0 with CI not strongly positive”. The report does not reconcile the two wordings. With M1–M4 applied, Phase 1B could proceed at full GTDB scale (27,690 species, all UniRef50s). That species count matches the core-scaffold total under data sources, whereas the atlas itself spans 18,989 species representatives. 1
Other pilot figures show per-rank score distributions by control class (figures/p1a_scores_by_class_per_rank.png) and per-rank null-model distributions (figures/p1a_null_per_rank_distributions.png). 1
Run-time and computational caveats
End-to-end, the project needs ~6–8 hours of cold-start wall time (~3h Spark-side + ~5h pandas-side). With cached intermediate parquets, the synthesis pass alone (NB28a → 28f) takes ~5 minutes. Three of the five documented performance caveats are:
- The Spark-Connect driver result-size cap is 1 GB serialized. The workaround is MinIO staging (
coalesce.write.parquet → read locally). - The pandas spatial merge runs out of memory at ~10M+ rows. This README caveat places the failure at NB26h (Bacteroidota PUL gene-neighborhood, 723K × 210K contigs) and proposes batched processing or a full-Spark Stage 6. The run log described under Caveats gives a different account: it attributes the full-scale 723K × 210K failure to the Spark driver cap and the pandas failure to a sampled run. The report does not reconcile the two accounts.
- Setting Spark
autoBroadcastJoinThreshold = -1is harmful: NB10 hung 17+ min until the setting was removed. 1
NB30 test families and revision bookkeeping
The NB30 Family 3 rows give residualized effects for the focal clades. These are mycobacteriaceae (family) and Mycobacteriales (order) in the NB12 mycolic analysis, and cyanobacteriia (class) in the NB16 PSII analysis (test; d_residualized; p_residualized; status):
- NB12 Mycobacteriaceae × mycolic family consumer_z: −0.16; 1.6×10⁻⁵; survives.
- NB12 Mycobacteriales × mycolic order producer_z: +0.29; 5×10⁻⁶; survives.
- NB16 Cyanobacteriia × PSII producer_z (class rank): +1.50; 2.1×10⁻⁵; survives.
- NB16 Cyanobacteriia × PSII consumer_z (class rank): +0.63; 2.3×10⁻⁵; survives. 1
Five of the six Family 3 tests survive. The non-surviving one is the NB11 regulatory-versus-metabolic null, which the project explicitly reframed as a small effect in the complexity-hypothesis direction. The report states that this test is not a false positive. 1
NB30 survival by test family (tests; surviving Bonferroni; share):
- Family 1, pre-registered hypotheses: 4; 4; 100%.
- Family 2, P4-D1 biome enrichment: 6; 5; 83%.
- Family 3, P4-D5 residualization replication: 6; 5; 83%.
- Total formal tests: 16; 14; 88%. 1
The report states that the actual hypothesis-test family is the 4 pre-registered hypotheses (H1–H4). Biome enrichment and residualization replication are supporting test families. A family-wise error rate (FWER) correction across the 16 formal tests in these 3 families leaves 14 of 16 surviving Bonferroni at family-specific α. The 2 non-surviving tests are correctly null results. 1
The report rejects the reviewer’s treatment of M1–M26 as 26 independent hypothesis tests on the same data. In its account, most M-numbers are pre-registration corrections documented for transparency: M1 positive controls, M2 dosage biology, M3 substrate hierarchy validation, M4 power analysis, M11 reconciliation contingency, M12 absolute-zero criterion, M13 cohort threshold tightening, M14 misreading-of-Alm-2006 correction, M16 Sankoff-parsimony metric, M19/M20 review-driven analyses, M22 acquisition-depth attribution, M23 minimum n_neg, M24 canonical effect-size reporting, M25 composition-donor-inference deferral and M26 tree-based donor inference. Three are post-hoc metric corrections on already-collected data: M14 Sankoff replacing parent-rank dispersion, M21 strict-housekeeping and M23 n_neg ≥ 20. Each was triggered by a specific failed diagnostic and is reported with that diagnostic. Earlier passages count 25 revisions (M1–M25). This is not a conflict: the report says its status updates layer chronologically, and M26 tree-based donor inference was added later, at the synthesis stage. Two descriptions do conflict, and the report does not reconcile them. M14 and M23 appear in both the pre-registration-correction list and the post-hoc list. M1 is described here as positive controls, but in the Phase 1A gate table as rank-stratified parent ranks. 1
Two synthesis layers are descriptive classifications outside the test families, so no multiple-testing correction applies to them. Figure S7 shows distribution shapes (focal versus atlas reference), and its medians (mycolic 0.15, PSII 0.88, PUL 0.41) are reported as observations, not p-values. The per-(genus × KO) Open/Broker/Sink/Closed assignment uses parsimony rules plus a minimum-event-count threshold (≥5). It is not a null-hypothesis test, and plan v2.16 makes it reportable as an exploratory layer. 1
The report’s methods references include four tool and dataset papers:
- Parks et al. (2022) for gtdb, a genome-based bacterial and archaeal taxonomy: “GTDB: an ongoing census of bacterial and archaeal diversity through a phylogenetically consistent, rank normalized and complete genome-based taxonomy”, Nucleic Acids Research 50(D1):D785–D794, doi:10.1093/nar/gkab776.
- Jones et al. (2014) for interproscan 5, a genome-scale protein-function classification method: “InterProScan 5: genome-scale protein function classification”, Bioinformatics 30(9):1236–1240, doi:10.1093/bioinformatics/btu031.
- Cantalapiedra et al. (2021) for eggnog-mapper v2, a method for functional annotation, orthology assignment and domain prediction: “eggNOG-mapper v2: functional annotation, orthology assignments, and domain prediction at the metagenomic scale”, Molecular Biology and Evolution 38(12):5825–5829, doi:10.1093/molbev/msab293.
- Schwengers et al. (2021) for bakta, a bacterial-genome annotation method: “Bakta: rapid and standardized annotation of bacterial genomes via alignment-free sequence identification”, Microbial Genomics 7(11):000685, doi:10.1099/mgen.0.000685. 1
Synthesis-stage refinements and review closure
Mycolic-acid sub-clade recomputation (NB29)
The S7 leaf_consistency analysis found within-Mycobacteriaceae heterogeneity (LC=0.15, below the atlas reference of 0.20). The report took this to suggest that the family-rank d=0.31 effect was a population-mixture average. Reviewer item REVIEW_9 I10 noted that the project had never recomputed Cohen’s d (a standardized mean difference) on the mycolic-positive sub-clade alone. NB29 (29_review9_mycolic_subclade.py) carried out that recomputation. 1
NB29 effect sizes (grouping; genera; producer d; consumer d):
- Family-rank Mycobacteriaceae (original NB12): 13; +0.309; −0.193.
- All genera at genus rank, no LC filter: 13; +0.326; +0.020.
- Mycolic-positive sub-clade (LC ≥ 0.5): 10; +0.394; +0.006.
- Mycolic-low sub-clade (LC < 0.5): 3; +0.211; +0.043. 1
The report names the 10 mycolic-positive genera (mean LC ≥ 0.5) as Williamsia, Smaragdicoccus, Lawsonella, Hoyosella, Tomitella, Tsukamurella, Dietzia, Gordonia, Nocardia and Williamsia_A. It calls all of them known mycolate-producing Mycobacteriales/Corynebacteriales genera. The 3 mycolic-low genera (mean LC < 0.5) were g__Mycobacterium, g__Corynebacterium and g__Rhodococcus. 1
The report calls one result surprising: g__Mycobacterium itself sits in the mycolic-low sub-clade, with mean LC=0.36 and median 0.08. Its explanation is that the project’s 11-KO mycolic panel is calibrated to long-chain Mycobacterium-style mycolate biosynthesis. Only the M. tuberculosis complex carries all panel KOs at high prevalence, and many environmental Mycobacterium species do not. On this account the mycolic-positive sub-clade is the broader Mycobacteriales/Corynebacteriales lineages that carry the panel uniformly. This explanation is the report’s interpretation and was not separately tested. It is in tension with the earlier S7 reading recorded below, which named the M. tuberculosis, M. leprae and M. avium complexes as examples of mycolic-positive sub-clades. The report does not reconcile the two readings, and both are recorded as written. 1
The report draws three conclusions from NB29. First, the producer effect is modestly amplified in the mycolic-positive sub-clade (d=0.39 versus family-rank d=0.31), so within-clade heterogeneity is real but does not dramatically dilute the original finding. Second, the consumer signal vanishes at genus rank (d=+0.006 versus d=−0.193 at family rank), which the report attributes to family-rank aggregation rather than to sub-clade-specific signal. Third, the refined supported claim is that “the mycolate-producing sub-clade of Mycobacteriaceae (10 of 13 genera) is mycolic-acid Innovator-Isolated, producer d=0.39 at genus rank”. On that claim, the consumer-side Innovator-Isolated component is weaker than the family-rank framing implied. 1
Leaf_consistency computation and per-event uncertainty
The species-level KO-presence parquet has 28M rows on MinIO. It made per-(rank × clade × KO) prevalence computation tractable, with a ~36s vectorized merge. The report says the initial v3.2 deferral of per-event leaf_consistency was a planning error, because this 28M-row data had been on MinIO since Phase 2 NB10 as the atlas’s build substrate. Leaf_consistency then landed at v3.3. NB28e computed species-with-KO / total-species-in-clade per (rank × clade × KO) and vectorized-merged the result to 16.7M gain events (97.8% coverage); the full per-event uncertainty file described below has 17.07M rows. By depth bin the values fell monotonically: recent 0.34, older_recent 0.30, mid 0.26, older 0.23, ancient 0.20. The report reads this as validating M22. Per-control-class medians were neg_rnap_core_strict 0.97, neg_trna_synth_strict 0.94 and neg_ribosomal_strict 0.92, versus pos_crispr_cas 0.29, pos_tcs_hk 0.13 and info_amr 0.11. The report reads this ordering as confirming the housekeeping-versus-HGT-active framework. 1
Bootstrap-based per-event uncertainty for M22 attribution was deferred because it would need ~50 hr of compute, and n_leaves_under shipped as the primary proxy. A later review response (C9) says leaf_consistency now provides one uncertainty proxy (n=16.7M gain events), with per-depth_bin medians ranging from 0.05 ancient to 0.26 recent. Bootstrap-based per-event uncertainty remains future work. These medians differ from the 0.34 → 0.20 per-bin values quoted above, which the report elsewhere gives as means. Both sets are recorded as written. 1
The report defines leaf_consistency as the fraction of clade species carrying a KO per (rank × clade × KO). It calls this a descriptive point estimate, not a tested significance claim. It rejects a reviewer’s multiple-testing objection on that basis. Supporting 7 shows distribution shapes without p-values, and the per-hypothesis medians (mycolic 0.15, PSII 0.88, PUL 0.41) are point estimates, not test outcomes. The report accepts as a forward-looking caveat that any future test using LC as a test statistic would need multiple-testing correction. The current synthesis does not test LC against null distributions. 1
Literature qualifying the DTL and donor framing
Williams et al. 2024 (DOI 10.1093/ismejo/wrae129, PMID 39001714), a review of modern phylogenetic reconciliation, qualifies the project’s “DTL doesn’t scale to GTDB” framing. Principled DTL (duplication–transfer–loss) methods are scaling, but not yet to the full 18,989-leaf tree. López Sánchez et al. 2026 (DOI 10.1177/15578666261426009, PMID 41955011) describe a directly parallel Sankoff-Rousseau algorithm for HGT inference using KEGG functions on bacterial species. The report calls M22 conceptually similar and proposes, as future work, a benchmark of M22 outputs against that algorithm on a shared substrate. DTL reconciliation cross-validation (Liu 2021 DTLOR / Bansal 2013) was out of scope per the REVIEW_8 I9 acknowledgement, and the report calls this an honest reportable limit. 1
Composition-based donor inference (M25) was deferred because per-CDS sequence is not available in the KBase Data Lakehouse’s queryable schemas. The exploratory M26 tree-based donor labels were also not validated against documented HGT cases. The report names Cyanobacteria → plastid PSII transfer, AMR plasmid transfers and ICE-mediated PUL transfers per Sonnenburg 2010 as such cases. It calls that validation (REVIEW item C8) a fair future-work suggestion that would strengthen M26 but is not in scope for the current synthesis pass. 1
Gisriel et al. 2023 (DOI 10.3389/fpls.2023.1289199, PMID 38053766) report within-Cyanobacteria HGT of FaRLiP photosystem I variants. The report says this qualifies but does not contradict the Cardona 2018 PSII donor-origin framing it uses for NB16. In its account, the donor-origin claim holds for PSII core machinery, while PSI FaRLiP variants are a separate, niche-specific photosystem subset that does undergo within-Cyanobacteria HGT. 1
Pre-registered versus exploratory outputs
The initial atlas synthesis pass produced 6 data deliverables and 7 figures, with all artifacts in data/p4_*.parquet / data/p4_*.tsv and figures/p4_synthesis_*.png. Later synthesis versions name further figures, which the report classifies by analysis status:
- Pre-registered atlas tests: Hero 2 (Three-Substrate Convergence Card), Supporting 4 (PSII rank-dependence) and Supporting 5 (Hypothesis Verdict Card).
- Exploratory atlas observations: Hero 1 (Atlas Innovation Tree), Hero 3 + H3-B (Acquisition-Depth Function Spectrum + signature plane), Supporting 6 (Function × Environment flow), N7 (Atlas heatmap) and N8 (Four-quadrant summary).
- Synthesis-discovered findings: Supporting 7 (per-hypothesis leaf_consistency, within-clade heterogeneity) and Supporting 8 (atlas confidence ridge). 1
The report warns against conflating these classes. The pre-registered tests carry specific Cohen’s d thresholds and falsification criteria from RESEARCH_PLAN. The exploratory observations and synthesis findings are descriptive patterns surfaced during the synthesis pass. Under its v3.5 reframing, the biome enrichments (Mycobacteriaceae 7.88× host-pathogen, Cyanobacteriia 2.77× photic aquatic, Bacteroidota 1.40× gut/rumen) demonstrate statistical association, not causal mechanism. They leave open whether environment drives function-class innovation, innovation drives niche occupancy, or a third factor drives both. The three-substrate convergence framework (atlas + ecology + phenotype) gives convergent evidence from three independent measurement substrates, but it does not establish causation. 1
Review closure
The adversarial-review table records one Mendoza 2020 PMID-hijack in round 5, with M23 actionable and a final-column rating of low. Round 7 recorded one fabrication (Koech 2025) plus one PMID error (Burch 2023). Its added literature was Burch 2023, Bansal 2013, Ślesak 2024 and Denise 2019, and it was rated high. Round 8 raised 3 critical, 4 important and 2 suggested items, had 7/7 citations verified by the auto-verifier and 0 fabrications, and added Liu 2021, Kundu 2018, Benzerara 2026 and Yu 2025; its rating was “highest to date”. The report calls the C9 critique (PSII rank-dependence) substantively correct and acknowledges it with biological framing. In a later response (C3) it presents PSII as a class-defining innovation per Cardona 2018, under which the genus-rank null is expected, not anomalous. 1
Other closed review items rest on the report’s own arguments. On C1 (multiple-testing burden), the M-revisions are pre-registration corrections, not 25 alternative tests. Only 4 pre-registered hypotheses were tested, giving Bonferroni α=0.0125, and the significant findings (NB12 p<10⁻⁶, NB16 p<10⁻⁵, P4-D1 p<10⁻¹¹) survive trivially. On C5 (“p-hacking” via M-revisions), the report separates pre-registration corrections (most M-numbers) from the genuine post-hoc metric changes, which it limits to M14, M21 and M23. On C6 (Alm anchor failure), the report holds that “the project’s intellectual lineage is methodology generalization of Alm 2006, not point-estimate reproduction”. 1
The report owns four genuine remaining open items as real methodological limits, with future-work commitments in its “Four honest limits” section:
- C2: sample-size effect inflation, especially PSII n=21.
- I3: phylogenetic non-independence, because no PIC (phylogenetic independent contrasts) correction was implemented.
- I5: unquantified cross-phase error propagation.
- I7: mixed TCS architectural concordance. 1
The v3.4 README Reproduction section documents 5 computational caveats: the Spark-Connect driver result-size cap, pandas spatial-merge out-of-memory failures, harmful autoBroadcast defaults, JupyterHub idle-timeout and the driver heap ceiling. Extracting these into a standalone methodology-library entry remains future work. 1
NB30 multiple-testing demonstration
A standard /submit review (REVIEW.md, 2026-04-29) flagged, as a critical-tier suggestion, “implement proper multiple testing correction for the 26 methodology revisions”. The report says it had already separated pre-registration corrections from genuine multiple testing, but that the suggestion warranted an explicit empirical demonstration. NB30 enumerated all formally tested significance claims and grouped them into test families. It then applied family-wise Bonferroni and Benjamini-Hochberg FDR (false discovery rate) correction. Result: 14 of 16 formal hypothesis tests survive family-wise Bonferroni, and the 2 non-surviving tests are null results the project already reports as such. 1
NB30 pre-registered hypothesis family (test; raw p; Bonferroni survival; verdict):
- H1 Bacteroidota PUL Innovator-Exchange: 1×10⁻³; survives; qualified pass.
- H2 Mycobacteriota mycolic Innovator-Isolated (family): 1×10⁻⁶; survives; SUPPORTED. This raw p differs from the NB12 family producer p = 2×10⁻⁶, and the report does not reconcile the two values.
- H3 Cyanobacteria PSII Innovator-Exchange (class): 2.1×10⁻⁵; survives; SUPPORTED.
- H4 Alm 2006 r ≈ 0.74 reproduction: 1×10⁻⁴³; survives; NOT REPRODUCED, with p significant due to large n and r=0.10–0.29 too small. 1
NB30 biome-enrichment family (test; raw p; Bonferroni survival):
- Cyanobacteriia × marine: 8.3×10⁻¹⁹; survives.
- Cyanobacteriia × photic aquatic: 1.5×10⁻⁵³; survives.
- Mycobacteriaceae × soil: 0.87; does not survive. This is correctly null: the fold was 0.88×, and the project reports soil as not enriched.
- Mycobacteriaceae × host-pathogen: 3.6×10⁻⁴⁶; survives.
- Mycobacteriaceae × (soil OR host-pathogen): 8.0×10⁻¹²; survives.
- Bacteroidota × gut/rumen: 3.6×10⁻³⁶; survives. 1
NB30 Family 3, the P4-D5 residualization replication tests at Bonferroni α=0.00833 (test; d_residualized; p_residualized; survival):
- NB11 producer_z regulatory versus metabolic: +0.06; 0.69; does not survive. This is correctly null, because the original H1 d≥0.3 criterion was falsified and reframed.
- NB12 Mycobacteriaceae × mycolic family producer_z: +0.31; 2×10⁻⁶; survives.
- NB12 Mycobacteriaceae × mycolic family consumer_z: −0.16; 1.6×10⁻⁵; survives.
- NB12 Mycobacteriales × mycolic order producer_z: +0.29; 5×10⁻⁶; survives.
- NB16 Cyanobacteriia × PSII producer_z (class rank): +1.50; 2.1×10⁻⁵; survives.
- NB16 Cyanobacteriia × PSII consumer_z (class rank): +0.63; 2.3×10⁻⁵; survives. 1
Key findings
Hypothesis verdicts
- Bacteroidota × PUL (polysaccharide utilization loci) CAZymes (carbohydrate-active enzymes): the original absolute-zero Innovator-Exchange criterion was falsified at UniRef50 resolution. It remains falsified under that pre-registered criterion: the four pre-registered hypotheses keep absolute-criterion adjudication, and M12 governs methodology QC only. Sankoff diagnostics recovered a small relative HGT (horizontal gene transfer) signal, Cohen’s d = 0.15. The final synthesis therefore labels the result a qualified pass/reframed finding, not evidence for the original strong criterion. Its anchors were 1.40× gut/rumen enrichment (p < 10⁻³⁵) and a saccharolytic, glycoside-hydrolase (GH)-rich BacDive profile (n = 577). MGE-machinery was 0%, and transfer is ICE (integrative and conjugative element)-mediated per Sonnenburg 2010. LC (leaf_consistency) = 0.41 (2× atlas) is described as a phylum tendency with within-phylum heterogeneity, consistent with Yu 2025. 1
- Mycobacteriaceae × mycolic acid: supported at family rank (producer d = +0.31, consumer d = −0.19) and at order rank (producer d = +0.288, consumer d = −0.285). The family-rank Innovator-Isolated subset contained 67 of 582 tuples, or 11.51%, against 5.85% atlas-wide. Its anchors were 7.88× host-pathogen enrichment (p < 10⁻⁴⁵), an aerobic-rod, Gram-positive, catalase phenotype profile (n = 318) and 0.57% MGE-machinery (chromosomal per Marrakchi 2014). LC = 0.15 (0.75× atlas) is described as sub-clade-specific, not pan-family. 1
- Cyanobacteriia × PSII: supported at class rank with producer d = +1.50 (p = 2×10⁻⁵) and consumer d = +0.70 (p = 2×10⁻⁴). Genus, family and order tests were STABLE, with producer d values of +0.08, +0.20 and +0.19, respectively. Its anchors were 2.77× photic-aquatic enrichment (p < 10⁻⁵²) and a thin BacDive anchor (n = 4). The final verdict table annotates the class-rank support with “genus rank too sparse” and lists AlphaEarth cluster 0 (marine+sponge dominant, NB25) as the substitute anchor. It records 0% MGE-machinery and a 10.91% gene-neighborhood rate equal to the Poisson baseline. LC = 0.88 (4.4× atlas) is called a canonical class-defining innovation that validates the Cardona 2018 framing. 1
- Alm 2006 reproduction: the reported r ≈ 0.74 was not reproduced across 18,989 species representatives (summary range r = 0.10–0.29). Four framings gave Pearson r values of 0.288, 0.157, 0.100 and 0.105, and Spearman r values of 0.333, 0.222, 0.152 and 0.106. The qualitative TCS-HK (two-component-system histidine kinase) architectural result still held: consumer-side KO-to-architecture concordance was r = 0.673 (reported as r = 0.67 in the verdict summary). Producer concordance was exploratory at r = 0.093. 1
- Regulatory versus metabolic functions: no test met the pre-registered d ≥ 0.3 threshold, so this bonus hypothesis was labelled REFRAMED (small effect). The primary score tests gave producer d = +0.059 and consumer d = −0.211; recent-acquisition d = +0.141. The consumer direction supports the Jain 1999 complexity hypothesis at small effect size. The report states that Burch et al. 2023 independently validated this direction empirically. The final verdict line places that validation “at the same direction at Lactobacillaceae scale”. Elsewhere the report describes Burch et al. as transferring 74-prokaryote-genome libraries into E. coli; both descriptions are recorded as written. MGE-machinery was 4.13% for regulatory KOs and 0.37% for metabolic KOs. 1
Regulatory versus metabolic test (NB11)
NB11 ran the Phase 2 headline test against the atlas. It asked whether KOs in regulatory KEGG categories differ in innovation/acquisition signatures from KOs in metabolic categories. Regulatory categories were Genetic Information Processing ko03xxx plus Environmental Information Processing ko02010-ko02065; metabolic categories were Metabolism ko00xxx-ko019xx. The pre-registered criterion required Cohen’s d ≥ 0.3 with a 95% CI (confidence interval) excluding zero, and a Mann-Whitney p < α/4 = 0.0125 (Bonferroni correction for four headline tests). No test reached d ≥ 0.3. Two of four tests showed small but statistically significant signals after Bonferroni correction, and two were null. 1
Each test below reports a 95% bootstrap CI and a two-sided Mann–Whitney p-value. 1
- T1 producer_z_median: n_reg = 1,554, n_met = 4,970, d = +0.059, 95% bootstrap CI [−0.011, +0.124], two-sided Mann–Whitney p = 0.71 (no signal).
- T2 consumer_z_median: n_reg = 1,552, n_met = 4,964, d = −0.211, 95% bootstrap CI [−0.288, −0.150], two-sided Mann–Whitney p < 10⁻¹⁵ (small effect, opposite direction).
- T3 recent_acquisition_pct: n_reg = 1,554, n_met = 4,970, d = +0.141, 95% bootstrap CI [+0.092, +0.189], two-sided Mann–Whitney p = 3.0×10⁻⁶ (small effect, weak direction match).
- T4 n_clades_with_max: n_reg = 1,552, n_met = 4,964, d = +0.020, 95% bootstrap CI [−0.045, +0.082], two-sided Mann–Whitney p = 0.12 (no signal). 1
The report concludes that the strong-form regulatory-versus-metabolic asymmetry hypothesis is not supported at GTDB scale. This is the H0-atlas fallback outcome the plan reserved, under which the atlas continues as a descriptive resource. The T2 direction runs against the strong prior. Regulatory KOs are more clumped than metabolic KOs (lower consumer z), which the report reads as more vertical inheritance. This contradicts the naive “regulatory genes flow more than metabolic” prior, which is sometimes inferred from Alm 2006. The TCS histidine-kinase signal itself is real (TCS-HK versus tRNA-synthetase d = 0.65 in the NB10 M21 sanity rail), but it does not generalize to the regulatory category as a whole. T3 is weakly consistent with a softer hypothesis: regulatory KOs showed 47.3% recent acquisitions versus 45.9% for metabolic KOs. However, d = 0.14 is below the project’s biological-significance threshold. 1
The most exchange-active category was neither regulatory nor metabolic alone. KOs in both regulatory and metabolic pathways had 2× the Innovator-Exchange rate (0.57%) of pure regulatory (0.27%) or pure metabolic (0.28%) KOs. The report therefore places the atlas asymmetry between pathway-overlap and pathway-pure KOs, not between regulatory and metabolic KOs as such. This is a category-level observation from a single project. 1
- Metabolic: 5,038,487 clade × KO tuples; 0.28 Innovator-Exchange, 4.24 Innovator-Isolated, 5.20 Sink/Broker-Exchange, 87.85 Stable (percent).
- Regulatory: 1,609,066 tuples; 0.27 Innovator-Exchange, 5.72 Innovator-Isolated, 7.16 Sink/Broker-Exchange, 84.50 Stable (percent).
- Mixed: 4,888,614 tuples; 0.57 Innovator-Exchange, 8.04 Innovator-Isolated, 5.71 Sink/Broker-Exchange, 83.68 Stable (percent).
- Other (off-target pathways): 398,805 tuples; 0.33 Innovator-Exchange, 4.08 Innovator-Isolated, 9.96 Sink/Broker-Exchange, 82.73 Stable (percent).
- Unannotated: 1,804,190 tuples; 0.13 Innovator-Exchange, 4.88 Innovator-Isolated, 2.52 Sink/Broker-Exchange, 89.98 Stable (percent). 1
The report states that mixed-category KOs populate the Innovator-Exchange quadrant at 2× the rate of either pure category (0.57% versus 0.27% / 0.28%). Mixed-category KOs are those with both regulatory and metabolic pathway annotations. The report presents this as a novel, hypothesis-generating observation, not a confirmed mechanism. Regulatory Sink/Broker-Exchange (7.16%) was also somewhat elevated versus metabolic (5.20%). The report reads this as regulatory KOs taking part in more cross-clade exchange events, although the exchange direction is unclear. The mixed-category observation shifted Phase 3 priorities toward Pfam architectures of pathway-overlap KOs in the Phase-3 candidate set. At this stage that was a proposed target, not a result. 1
Acquisition depth by KO category (percent of gains in recent / older_recent / mid / older / ancient bins):
- Metabolic: 45.92 / 32.17 / 10.23 / 7.04 / 4.64.
- Regulatory: 47.27 / 32.07 / 9.68 / 6.64 / 4.34.
- Mixed: 47.62 / 32.75 / 9.82 / 6.15 / 3.66.
- Other: 39.99 / 30.17 / 11.38 / 9.71 / 8.75.
- Unannotated: 46.88 / 31.37 / 9.79 / 6.95 / 5.01. 1
The report cautions that differences across these categories are small. The “other” category has the most ancient-skewed profile; it covers off-target pathways (ko04xxx organismal systems, ko05xxx human diseases). The report attributes the skew to these being mostly evolutionarily older or eukaryotic-derived annotations that pass through PROKKA → eggNOG mapping accidentally. This is an interpretation, not a tested explanation. By contrast, the class-level recent-to-ancient signatures (NB10b M22) were clean and informative: CRISPR-Cas 24.5×, tRNA-synth 2.3× and β-lactamase 9.0×. They held even though the pooled regulatory/metabolic asymmetry is small. 1
At GTDB scale, the NB10 Producer × Participation cross-classification left 50K Innovator-Exchange (clade × KO) tuples as the substantive map. NB11 indicates these tuples are not concentrated by the regulatory-versus-metabolic split. The report adds that NB11’s pooled null does not invalidate the four pre-registered weak-prior hypotheses, each of which tests a specific clade × function tuple. It only means that a regulatory/metabolic asymmetry cannot be used to predict them. The report says NB12 becomes more diagnostic as a result. 1
The phase-level verdict table labels the regulatory-versus-metabolic asymmetry (Phase 2 Tier-1) H1 REFRAMED (H0 fallback). Signals exist at d = 0.14–0.21 but fall below the d ≥ 0.3 threshold. The report calls these effects statistically significant but biologically small, in the range Cohen 1988 calls small. It treats them as descriptive, not as evidence for a strong-form asymmetry. For T2, regulatory KOs were more phylogenetically clumped than metabolic KOs (consumer_z d = −0.211, Mann–Whitney p < 10⁻¹⁵, n_reg = 1,552 versus n_met = 4,964). The report interprets this as regulatory KOs showing less HGT, as the complexity hypothesis predicts; the effect is small. 1
Mycolic-acid hypothesis test (NB12)
The pre-registered H1 predicted that Mycobacteriaceae (GTDB f__Mycobacteriaceae / o__Mycobacteriales) would be Innovator-Isolated on the mycolic-acid pathway KO set. Innovator-Isolated means high Producer and low Participation. The test was set at deep ranks (family and order) at q < 0.0125 (α/4 Bonferroni). The report grounds the prediction in Marrakchi et al. (2014, Chemistry & Biology 21(1):67–85, doi:10.1016/j.chembiol.2013.11.011, PMID 24374164). That paper documents mycolic acids as major and specific lipid components of the mycobacterial cell envelope, essential for the survival of members of the genus Mycobacterium. 1
NB12 results by rank (Cohen’s d, a standardized mean difference, with Mann–Whitney p):
- Family
f__Mycobacteriaceae, n = 582: producer d = +0.309 (p = 2×10⁻⁶), consumer d = −0.193 (p < 10⁻¹⁵), classified Innovator-Isolated. - Order
o__Mycobacteriales, n = 614: producer d = +0.288 (p = 5×10⁻⁶), consumer d = −0.285 (p < 10⁻¹⁵), classified Innovator-Isolated. 1
The family producer effect (0.309) just exceeds the d ≥ 0.3 effect-size threshold, while the order effect (0.288) falls just below it. The report still judged the hypothesis supported. At both ranks the directions were correct on both criteria, and the Mann–Whitney p-values were well below α/4 = 0.0125. Its verdict table marks H1 SUPPORTED: NB12, both criteria pass at family + order, d=0.31 with strong p, striking depth signature. The phase-level verdict table states H1 SUPPORTED at family + order (producer d=0.31, consumer d=−0.19, p<10⁻¹⁵; 79.9% recent / 0% ancient). The report’s own more conservative reading is that the strict d ≥ 0.3 criterion is met cleanly only at family rank. On that reading the Innovator-Isolated signature is strongest at family rank. At order rank it is weaker, though still directionally consistent and significant. 1
At family rank the 582 Mycobacteriaceae × mycolic-acid (clade × KO) tuples split into four classes. There were 67 Innovator-Isolated (11.51%, versus 5.85% atlas-wide, 803K / 13.7M) and 497 Stable (85.40% versus 86.10%). There were 17 Sink/Broker-Exchange (2.92% versus 5.40%) and 1 Innovator-Exchange (0.17% versus 0.36%). The report calls this a 2.0× Innovator-Isolated enrichment over the atlas baseline. It reads the enrichment as more lineage-specific paralog expansion and within-clade containment than in typical tuples. Innovator-Exchange is essentially absent: 1 tuple versus ≥ 50K typical of HGT-active classes. 1
The mycolic-acid candidate set was 715 KOs, drawn from two routes. The first route was KEGG_Pathway membership in ko00061 (fatty acid biosynthesis), ko00071 (fatty acid degradation), ko01040 (biosynthesis of unsaturated fatty acids) and ko00540. ko00540 came from the plan spec but is actually LPS biosynthesis, and was included for plan-faithfulness. The second route was a curated list of 11 mycolic-acid-specific KOs: Pks13/K11778, KasA/K11533, KasB/K11534, InhA/K00208, Ag85 mycolyltransferases K01205/K11211/K11212, MmaA methyltransferases K20274/K11782, K00667 and K00507. All 11 are present in the GTDB substrate. Because the pool includes general fatty-acid biosynthesis, it is broader than strict mycolic acid, and the report calls the test somewhat conservative. The report suggests a stricter definition might amplify the signal further, but at the cost of sample size; that amplification is untested. The analysis spans 459 Mycobacteriaceae species × 715 candidate KOs with Sankoff parsimony attribution. The report calls this quantitative phylogenomic confirmation of the literature’s mechanistic prediction; “confirmation” is the report’s interpretation. 1
The report proposed further work in this phase without completing it, including the following. One proposal applies a Pfam architectural lens to the 67 Innovator-Isolated tuples, to find which mycolic-acid-related architectures are most lineage-specific; that question is not answered here. Another is an explicit Alm 2006 r ≈ 0.74 reproduction (P4-D3). The report cautions that Alm 2006 tested histidine-kinase (HPK) count versus lineage-specific expansion (LSE) fraction across 207 genomes broadly, not Mycobacteriaceae mycolic acid. It nonetheless calls the two results biologically consistent, since both show paralog expansion as a clade-level signature in specific function classes. 1
Acquisition-depth signatures
M22 assigned 17,073,194 Sankoff gain events to recipient-rank depth bins. Recent-to-ancient ratios separated function classes. 1
- CRISPR-Cas had 58.7% recent and 2.4% ancient gains, a 24.5× ratio.
- TCS histidine kinases had 45.1% and 4.4%, a 10.3× ratio.
- β-lactamases had 44.2% and 4.9%, a 9.0× ratio.
- Clean tRNA-synthetase controls had 24.7% and 10.7%, a 2.3× ratio. 1
The report contrasts CRISPR-Cas at 24.5× (HGT-active) with housekeeping-strict functions at ~1× (vertical inheritance). It treats the recent-to-ancient ratio itself as a function-class signature and as the atlas centerpiece. 1
Mycobacteriaceae mycolic-acid gains (53,916 events) were 79.87% recent, 16.72% older-recent, 3.41% mid, 0.00% older and 0.00% ancient. Across all mycolic-acid gains atlas-wide (n = 1.47M), the corresponding values were 48.79%, 31.81%, 9.60%, 6.12% and 3.68%; these are percentages, not gain counts. Ancient events made up 2.05% of Cyanobacteria PSII gains, against 14.90% atlas-wide. This fits a class-level donor-origin signature but does not establish donor identity. 1
The report emphasizes that Mycobacteriaceae mycolic-acid acquisitions include zero ancient and zero older gains. It contrasts this with 9.8% in deeper bins (older + ancient combined) for the atlas-wide mycolic-acid distribution. The report’s prose is internally inconsistent here. One passage says essentially all 53,916 gains sit at genus rank (recent, 79.9%) or family rank (older_recent, 16.7%). Another says every single one of the 53,916 gain events is recent or older-recent. The report’s own table also shows 3.41% mid gains. The table values are recorded above, and the “every single one” wording is not supported by them. 1
The synthesis-stage leaf_consistency metric is the fraction of species in a recipient clade that carry a KO. Its mean was 0.34 for recent gains and 0.20 for ancient gains. Hypothesis-specific values were 0.88 for Cyanobacteriia × PSII, 0.41 for Bacteroidota × PUL and 0.15 for Mycobacteriaceae × mycolic acid, against an atlas reference of 0.20. The low Mycobacteriaceae value shows that the family-level mycolic result is a mixture of within-family sub-clades, not a uniform family property. The report therefore narrows the supported claim to sub-clades of Mycobacteriaceae (M. tuberculosis / M. leprae complexes etc.). It calls the family-rank d = 0.31 effect a population-mixture average. 1
A follow-up sub-clade analysis (I10) found producer d = +0.394 for the mycolic-positive sub-clade, which covers 10 of 13 genera. The comparison values were family-rank d = +0.309 and mycolic-low sub-clade d = +0.211, and the report calls the change a modest amplification. Consumer d was +0.006 for the mycolic-positive sub-clade. So the original consumer-side Innovator-Isolated signal is rank-dependent and strongest at family aggregation. 1
Leaf-consistency signature plane and within-clade heterogeneity
The per-event uncertainty file data/p4_per_event_uncertainty.parquet has 17.07M rows of M22 gain events. n_leaves_under has a median of 10 and a 75th percentile of 39. leaf_consistency covers 97.8% of events, with a mean of 0.34 for recent gains versus 0.20 for ancient gains, which the report reads as validating the M22 depth signal. 1
The S8 atlas confidence ridge plot (figures/p4_synthesis_S8_atlas_confidence_ridge.png) shows the same decline in leaf_consistency, from 0.34 for recent gains to 0.20 for ancient gains, as full distributions rather than summary statistics. Recent gains have a long right tail toward 1.0, representing clades where the KO is fully fixed. Ancient gains compress toward 0, representing a KO retained in a small fraction of phylum members after diversification and loss. The report treats the plot as the atlas-wide signal-confidence map. It cautions that ancient-gain attribution is less reliable than recent-gain attribution, because subsequent within-clade losses dilute the underlying signal. 1
Hero 3, the Acquisition-Depth Function Spectrum (figures/p4_synthesis_H3_acquisition_depth_spectrum.png), plots per-control-class recent versus ancient gain fraction with a recent-to-ancient ratio annotation. CRISPR-Cas sits at a 24.5× ratio (high recent / low ancient), which the report reads as HGT-active. Housekeeping classes sit near 1× (recent ≈ ancient), which the report reads as dominant vertical inheritance. 1
The H3-B control-class signature plane (figures/p4_synthesis_H3b_control_class_signature_plane.png) places control classes by recent fraction and leaf_consistency (LC):
- Top-left, low recent + high LC (vertical inheritance): strict housekeeping classes, namely RNAP core strict 0.97, tRNA-synth strict 0.94 and ribosomal strict 0.92. These KOs are present in nearly all clade members and have a low recent-gain rate.
- Bottom-right, high recent + low LC (HGT-active, patchy): CRISPR-Cas 0.29, AMR 0.11 and TCS HK 0.13, with patchy distributions and active recent gains.
- Loose housekeeping classes sit in the middle, because the loose definitions include paralogs and weakly-housekeeping members. Only strict housekeeping separates cleanly toward the vertical signature.
- Bottom-left (ancient patchy) is sparsely populated, mainly by paralog-inflated loose-housekeeping classes. 1
The report calls this its cleanest independent validation of the housekeeping-versus-HGT-active framework. Its reason is that leaf_consistency is a measurement axis that was not used in any pre-registered hypothesis test. The plane is a descriptive classification of control classes, not a hypothesis test. 1
Per-hypothesis median leaf_consistency is compared against an atlas reference of 0.20 (focal n; median LC; ratio to reference):
- Cyanobacteriia × PSII: 1,005; 0.88; 4.4× higher. The report reads this as PSII KOs being present in 88% of Cyanobacteriia species, a canonical class-defining innovation per Cardona 2018. On that reading, the class-rank NB16 verdict (d=1.50) sits on a near-uniform population.
- Bacteroidota × PUL: 6,070; 0.41; 2.0× higher. PUL KOs are present in 41% of Bacteroidota species, a phylum tendency with substantial within-phylum heterogeneity.
- Mycobacteriaceae × mycolic: 33,643; 0.15; 0.75× (lower). Mycolic gains land in clades where the mycolic KO is present in only 15% of family members.
These distributions are plotted in S7 (
figures/p4_synthesis_S7_hypothesis_leaf_consistency.png). 1
The report calls the Mycobacteriaceae result (LC=0.15 < atlas reference 0.20) a novel within-clade heterogeneity discovery. It reads the NB12 family-rank producer effect (d=0.31) as an average across two groups. One group is mycolic-positive sub-clades, for example the M. tuberculosis, M. leprae and M. avium complexes. The other is mycolic-negative or atypical members. The report says this fits established biology: only a subset of Mycobacteriaceae produces mycolates of the chain length characteristic of M. tuberculosis. Deep-rank P×P aggregation obscured this heterogeneity, and leaf_consistency surfaces it. The supported claim is therefore narrower than “Mycobacteriaceae innovate mycolic-acid biosynthesis”. The narrower claim is that sub-clades of Mycobacteriaceae are mycolic-acid Innovator-Isolated, and that the family-rank effect is a population-mixture average. The report links this to the 7.88× host-pathogen biome enrichment, which it says is also driven primarily by the mycolic-positive pathogenic sub-clades. That link is the report’s interpretation, not a separate test. 1
Final atlas files and M26 tree-based donor inference
The final deep-rank Producer × Participation atlas file data/p4_deep_rank_pp_atlas.parquet has 13.74M rows across all deep ranks. Its category counts are Innovator-Isolated 803K, Innovator-Exchange 50K, Sink-Broker-Exchange 742K, Stable 11.83M and Insufficient-Data 315K. The synthesis states the overall atlas size as 13.7M (rank × clade × KO) producer/participation scores, 17M Sankoff gain events with M22 recipient-rank attribution and 3.9M (KO × genus) MGE-machinery fractions. These span 18,989 P1B-qualified species representatives across the bacterial domain of GTDB r214. 1
data/p4_pre_registered_verdicts.tsv is the formal verdict file for 5 hypotheses, with atlas / ecology / phenotype / MGE / disposition columns. It records H1 qualified pass, H2 SUPPORTED, H3 SUPPORTED at class, H4 NOT REPRODUCED and NB11 REFRAMED. The report lists its four pre-registered hypotheses in the order Bacteroidota PUL, Mycobacteriota mycolic, Cyanobacteria PSII and Alm 2006 r ≈ 0.74. Read in that order, the H1 label matches the final synthesis’s qualified pass for PUL rather than the earlier falsified label. The S5 hypothesis verdict card (figures/p4_synthesis_S5_hypothesis_verdict_card.png) presents these verdicts. 1
M26 tree-based donor inference is distinct from the deferred M25 composition-based method. For each recent-rank gain event into family F for KO K, the candidate donor genera are the genera in F with K present, minus the recipient genus. For each (genus × KO) pair, the method aggregates recipient gains and donor-candidate events into a donor/recipient ratio. Donor-candidate events are computed algebraically, which avoids an exponential explosion. The classes are Open-Innovator if ratio ≥2, Broker if 0.5 ≤ ratio < 2, Sink if ratio < 0.5, Closed-Stable if both counts are close to zero, and Insufficient if total events < 5. 1
data/p4_genus_rank_quadrants_tree_proxy.tsv has 4.06M rows on the Phase 3 candidate set. Its label counts are Open-Innovator 2.38M, Broker 153K, Sink 182K and Insufficient 1.34M; the passage gives no Closed-Stable count. Its confidence counts are high 1.36M, medium 646K and low 711K. 1
Tree-proxy quadrants for the focal clades (genus × candidate-KO tuples; Open-Innovator; Broker; Sink; Insufficient):
- Mycobacteriaceae genera: 28,389; 75.3% (21,365); 13.0% (3,701); 9.2% (2,619); 2.5% (704).
- Cyanobacteriia genera: 54,582; 47.9% (26,158); 3.7% (1,999); 4.4% (2,395); 44.0% (24,030).
- Bacteroidota genera: 439,968; 56.5% (248,581); 4.5% (19,663); 5.4% (23,612); 33.7% (148,112).
The N8 genus-rank four-quadrant summary (
figures/p4_synthesis_N8_four_quadrant_summary.png) displays these breakdowns. 1
The report keeps the tree proxy exploratory. Its algebraic formula counts every genus with the KO present as a potential donor for the gains of all its family-mates, which biases results toward Open-Innovator dominance. The deferred M25 composition-based analysis would be needed to separate Open-Innovator-tagged genera that are empirically donor-like from those that are merely parsimoniously donor-compatible. The high Open-Innovator shares above should be read with this bias in mind. 1
Joining the genus-rank atlas to the tree-proxy quadrants gives data/p4_concordance_weighted_atlas.parquet (8.64M rows), with agree 169K, conflict 2.55M and insufficient 5.92M. The 2.55M per-tuple disagreements are listed in data/p4_conflict_analysis.tsv. The report interprets most of them, the “deep-stable + genus-active” cases, as the expected relationship between ranks rather than real conflict. It estimates ~22K real rank-dependent conflicts. That split is the report’s interpretation. 1
The S4 PSII rank-dependence ladder (figures/p4_synthesis_S4_psii_rank_dependence.png) responds to REVIEW_8 C9. It plots producer Cohen’s d at genus (n=2,350, d=0.08, STABLE), class (n=21, d=1.50, INNOVATOR-EXCHANGE) and phylum (n=21, d=1.60, INNOVATOR-ISOLATED). Its annotation frames PSII as a class-defining innovation per Cardona 2018. It calls the class-rank verdict biologically appropriate and the genus null expected under that framing. 1
Synthesis figures
Other synthesis figures are Hero 1, the Atlas Innovation Tree (figures/p4_synthesis_H1_innovation_tree.png); Hero 2, the Three-Substrate Convergence Card (figures/p4_synthesis_H2_three_substrate_convergence.png); S6, the function × phylum × environment flow (figures/p4_synthesis_S6_function_env_flow.png); and N7, the atlas heatmap (figures/p4_synthesis_N7_atlas_heatmap.png). 1
The N7 heatmap recovers the original NB22 deliverable. It shows the % of (family × KO) tuples that are Innovator-* for each top-20 phylum × control class at family rank. Cyanobacteriota and Actinomycetota show elevated Innovator-* fractions for AMR and CRISPR-Cas. Housekeeping classes show low Innovator-* fractions across the board. The report describes these as patterns at expected positions; this is a visual pattern, not a tested result. 1
Synthesis-stage review responses and literature
The synthesis restates the per-rank null model and the Producer × Participation framework (M5/M6) as the project’s own construction. It is a direction-agnostic per-clade categorization at deep ranks, where DTL reconciliation is not tractable; Alm 2006 did not categorize this way. The synthesis likewise restates Sankoff parsimony with M22 recipient-rank gain attribution as a tree-aware acquisition-depth signal at full GTDB scale. That signal replaced the parent-rank dispersion permutation null, which the NB08c diagnostic identified as the wrong metric. 1
The references add Kundu & Bansal (2018), “On the impact of uncertain gene tree rooting on duplication-transfer-loss reconciliation” (BMC Bioinformatics 19(Suppl 9):290, doi:10.1186/s12859-018-2269-0, PMID 30367593). That paper documents that a large fraction of gene trees have multiple optimal rootings, and it quantifies which aspects of DTL reconciliation are conserved across rootings. The project’s Sankoff approximation lacks this rooting-uncertainty quantification. 1
The report acknowledges that its Sankoff methodology is a generation behind the state of the art. Its defensible position has three parts. (a) Sankoff parsimony is computationally tractable at full GTDB scale (17M gain events on an 18,989-leaf tree), where exact DTL methods are not. (b) The Producer × Participation framework provides a complementary signal that does not require donor inference. (c) M22 acquisition-depth attribution surfaces recipient-and-when signal at scale, even without principled DTL. A comprehensive cross-validation against Liu 2021 DTLOR or Bansal 2012/2013 SPR-based DTL on a representative GTDB subset is out of scope. It would require external tool integration and GTDB-scale per-family gene tree estimation, and the report lists it as a defensible future direction. 1
One critique was that 25 methodology revisions (M1–M25) inflate the testing burden. The report replies that most M-numbers are transparency about what was done, not 25 alternative hypothesis tests on the same data. They are pre-registration corrections, substrate audits, biological-control additions or metric corrections discovered through diagnostics. Examples are M1 (AMR/CRISPR-Cas positive controls), M2 (dosage biology), M12 (absolute-zero criterion), M14 (Sankoff replacing parent-rank dispersion) and M21 (strict-class housekeeping). The report counts 4 pre-registered hypotheses (Bacteroidota PUL; Mycobacteriota mycolic; Cyanobacteria PSII; Alm 2006 r ≈ 0.74) tested at Bonferroni α = 0.05 / 4 = 0.0125. It says all reported significant findings survive trivially: NB12 mycolic-acid p<10⁻⁶, NB16 PSII class p<10⁻⁵ and P4-D1 enrichments all p<10⁻¹¹. This four-test framing differs from the 16-formal-test correction pass described under Methodological contributions; both are recorded as written. 1
The report concedes that three revisions are genuine post-hoc metric changes on already-collected data: M14 Sankoff, M21 strict-class housekeeping and the M23 n_neg ≥ 20 minimum. Each was triggered by a failed diagnostic test. The reported p-values are not corrected for these specific changes. The report advises readers to weight findings by convergence of effect size, ecological grounding and phenotype anchor (the three-line-evidence framework), and not to treat individual p-values as corrected. 1
A reviewer noted that the gene-neighborhood MGE-cargo analysis cannot detect ICE-mediated transfer for Bacteroidota PUL under the Sonnenburg 2010 framework. The report says this limit was already stated in P4-D2. P4-D2 also states that bakta product-keyword matching detects MGE machinery genes but does not detect cargo genes carried on MGEs without synteny analysis. No new analysis was run in response. 1
Reviewer item I10 concerned architectural promiscuity: mixed-category KOs show a median of 46 architectures per KO, versus 1 for PSII. The report flags this as a novel observation that is explicitly exploratory and not pre-registered. Independent structural validation against AlphaFold confidence scores or the domain-shuffling literature is out of scope. 1
Reviewer item I12 concerned error propagation, and the report confirms that cross-phase uncertainty bounds are not tracked. Four error sources are not propagated into a unified atlas confidence interval: Phase 1 UniRef50→KO projection errors, Phase 2 Sankoff approximation errors, Phase 3 architectural-census coverage gaps and Phase 4 residualization assumptions. Monte Carlo error propagation, estimated at ~1-2 weeks of additional work, was deferred. Readers are advised to weight findings by convergence across atlas effect size, ecology grounding and phenotype anchor. Under item S6, integration of external tools (PaperBLAST, AlphaFold, eggNOG) is also future work, and the project closes at atlas construction and interpretation, not experimental validation. 1
Under item S7, the report notes that its P4-D2 caveat documents the Spark-Connect driver result-size cap (1GB serialized) and the pandas spatial-merge out-of-memory thresholds. It says a more systematic computational-bottleneck retrospective would help future GTDB-scale projects. 1
The synthesis summarizes three ecological evidence lines. The first is biome assignment via MGnify, ENVO env_broad_scale and isolation_source (76.8–88.8% coverage). The second is BacDive metabolic-profile phenotype anchors (32% species coverage). The third is AlphaEarth 64-dim satellite-imagery embeddings as a quantitative environment vector (27% species coverage). The 76.8–88.8% range corresponds to the isolation_source and geo_loc_name figures in the substrate audit below. That audit gives env_broad_scale 48.6% and MGnify 28.4%, so the range does not describe every source named in the list. 1
Benzerara et al. (2026), “Intracellular amorphous calcium carbonate biomineralization in methanotrophic gammaproteobacteria was acquired by horizontal gene transfer from cyanobacteria” (Environmental Microbiology 28(3):e70270, doi:10.1111/1462-2920.70270), reports recent Cyanobacteria → Gammaproteobacteria HGT of the ccyA gene. The report reads it as independent support for its NB16 framing that Cyanobacteria are HGT donors at recent ranks. It is an external literature anchor, not a project measurement. 1
Yu et al. (2025), “Characterization of two novel species of the genus Flagellimonas reveals the key role of vertical inheritance in the evolution of alginate utilization loci” (Microbiology Spectrum 13(4):e00917-25, doi:10.1128/spectrum.00917-25), finds that vertical inheritance dominates Bacteroidota AUL (alginate utilization loci) evolution at the Flagellimonas genus level. The report says this complicates a simple “PUL = HGT” framing. It reads the study as consistent with its Phase 1B verdict: PUL was falsified at the deep-rank absolute-zero criterion and recovered only as a small consumer-z signal. On this reading, within-Bacteroidota PUL evolution is more vertical than horizontal at fine taxonomic resolution. 1
The adversarial-review summary table records one Alm 2006 hallucination (a false claim) for round 4, with M19/M20 actionable. The report does not say whether this is the same item as the REVIEW_4 C1 claim, noted under Caveats, that Alm 2006 was not cited. 1
Ecology and phenotype consistency
The three focal clades were statistically consistent with their expected environments. Script 23_p4d1_env_substrate_pull.py joined per-species biome assignments to the 18,989 P1B species representatives, using MGnify as the primary source, ENVO as secondary and isolation_source as tertiary. Script 23b_p4d1_biome_enrichment_tests.py then ran one-sided Fisher’s exact tests of clade × expected-biome enrichment against the atlas distribution. 1
- Cyanobacteriia (n = 309) showed 2.77× photic-aquatic (marine + freshwater) enrichment, 63.8% versus 23.0% atlas-wide, p < 10⁻⁵². A narrower marine-only test gave 35.3% versus 15.1%, 2.33×, p < 10⁻¹⁸.
- Mycobacteriaceae (n = 459) showed 7.88× host-pathogen enrichment, 16.6% versus 2.1%, p < 10⁻⁴⁵. A combined soil-or-host-pathogen test gave 29.0% versus 16.4%, 1.76×, p < 10⁻¹¹.
- Bacteroidota (n = 2,581) showed 1.40× gut/rumen enrichment, 36.1% versus 25.8%, p < 10⁻³⁵. 1
Mycobacteriaceae (n = 459) was not soil-enriched: 12.9% versus 14.5%, 0.88×, p = 0.87. The report attributes this null to the clade’s species representatives skewing toward clinical isolates. Its MGnify breakdown lists 53 human-skin, 16 human-vaginal, 15 human-gut and 11 chicken-gut species. The report treats this as a refinement of NB12: the mycolic-acid Innovator-Isolated signature concentrates in host-pathogen mycobacteria, not soil mycobacteria, and the 7.88× host-pathogen enrichment is the clean anchor. The clinical-isolate skew is the report’s explanation and was not separately tested. As a phylum-level sanity check, the report lists the following biome distributions, which it says match well-established ecology: p__Cyanobacteriota 33.2% marine / 60.7% photic; p__Bacillota_A (Clostridia) 81.0% gut/rumen; p__Bacteroidota 36.1% gut/rumen; p__Verrucomicrobiota 65.6% photic; p__Planctomycetota 38.7% marine; and p__Chloroflexota 47.0% photic. 1
BacDive phenotype profiles matched the atlas interpretations. The synthesis summarizes the anchors as Mycobacteriaceae 89.4% aerobic-leaning + Gram-positive + non-motile + rod-shaped + catalase-positive, and Bacteroidota saccharolytic + glycoside-hydrolase-rich + 1.5× anaerobe enriched; the Bacteroidota details are given in the next paragraph. Profiling drew on the 6,066 P1B species representatives with BacDive matches (32%, via GCF→GCA fallback), and pulled metabolite-utilization, physiology and enzyme phenotype tables for each focal clade. Mycobacteriaceae had 318 BacDive-matched species. Gram stain was positive in 171 records and negative in 1. Cell shape was rod-shaped in 194/216 records; the report gives this as 95%, but that percentage does not match its own fraction and should not be relied on. Motility was non-motile in 195/196 (99%). Oxygen tolerance was 89.4% aerobic-leaning: aerobe 40.9%, obligate aerobe 31.1% and microaerophile 17.4%. Catalase EC 1.11.1.6 appeared at 317 instances. The most frequently tested compounds were nitrate (552), sucrose (351), maltose (279), urea (251) and glycogen (241), which the report calls a typical mycobacterial growth-test panel. 1
Bacteroidota had 577 BacDive-matched species. Gram stain was negative in 339 records and positive in 4, 344 records were rod-shaped, and 78% were non-motile. Anaerobes made up 33.2% versus 22.0% atlas-wide, and aerobes 48.7%. The report calls this 1.5× enriched despite type-strain culture bias toward aerobes. The profile was saccharolytic: maltose 230+ utilized, raffinose 155+, esculin 228+, plus cellobiose, glucose and lactose. The top enzymes were leucyl-aminopeptidase (415), β-galactosidase (391), α-galactosidase (340), β-glucosidase (339) and β-N-acetylhexosaminidase (299), a glycoside-hydrolase-rich profile. The report calls this the polysaccharide-utilization signature predicted by PUL biology and the strongest available BacDive anchor for the Phase 1B PUL finding. It is a phenotype-consistency check, not a direct test of transfer. 1
Cyanobacteriia BacDive coverage was too thin (n = 4 species) for phenotype anchoring. The report therefore places the NB16 anchor load on two other analyses: NB23 biome enrichment (63.8% photic aquatic, p < 10⁻⁵²) and NB25 environment-cluster concentration (35.6% in cluster 0, marine + sponge dominant). These profiles, together with AlphaEarth environmental clustering that placed focal clades in their expected environmental clusters, served as the project’s ecological anchors. 1
Script 25_p4d1_alphaearth_env_clusters.py clustered the 4,633 P1B species that have AlphaEarth 64-dimensional environmental embeddings into k = 10 environmental clusters by k-means, and the clustering recovered ecological structure. That clustered set is smaller than the 5,157 species the data-coverage audit lists for AlphaEarth, and the report does not reconcile the two counts. 1
- Among 90 Cyanobacteriia species with embeddings, 35.6% were in cluster 0 (marine+sponge dominant) and 17.8% in clusters 5+8. The report calls this heavily marine-leaning and consistent with NB16 expectations.
- Among 50 Mycobacteriaceae species, 34.0% were in cluster 1 (gut+sludge) and 20.0% in cluster 3 (gut). The report reads this as host-clustered and matching the NB12 host-pathogen anchor.
- 729 Bacteroidota species were spread across clusters 0/1/3 (~18% each). The report reads this as the wide gut + marine niche range of a polysaccharide-utilization specialist. 1
The report describes six of the ten AlphaEarth environmental clusters by size and dominant biomes (cluster; n species; dominant biomes):
- Cluster 0: n=818; marine + sponge tissue + hypoxic seawater.
- Cluster 1: n=812; chicken-gut + human-gut + activated sludge.
- Cluster 3: n=684; mouse-gut + pig-gut + groundwater.
- Cluster 4: n=328; sheep-rumen + stool + rumen.
- Cluster 6: n=228; hypersaline soda lake sediment + Microcystis lake.
- Cluster 9: n=203; soil + temperate grassland + groundwater + meadow soil. 1
Per-species mean recent-gain counts differed across clusters. The columns below are read as the regulatory, metabolic and mixed KO categories (cluster; regulatory; metabolic; mixed; dominant biomes):
- Cluster 5: 3,178; 10,891; 6,418; mouse-gut + marine + acid mine drainage.
- Cluster 8: 3,091; 10,063; 6,008; marine + human-gut + soil.
- Cluster 1: 2,652; 8,081; 5,780; gut + sludge.
- Cluster 3: 2,627; 8,173; 5,446; gut.
- Cluster 6: 490; 1,475; 1,100; hypersaline + Microcystis.
- Cluster 9: 1,303; 5,314; 3,087; soil + grassland. Clusters 5 and 8 hold mixed-biome species and carry the highest recent-gain density. Cluster 6 (hypersaline / extremophile niche) carries the lowest. These are descriptive cluster contrasts, not formal tests. 1
Mobile-genetic-element context
P4-D2 measured how often pre-registered atlas KOs travel via MGEs using two independent measurement substrates. The first was per-cluster MGE-machinery: whether the KO encodes an MGE protein itself. The second was gene-neighborhood MGE-cargo: whether the KO sits within ±5 kb of MGE machinery in actual genome assemblies. The genomad_mobile_elements table was not ingested in the KBase Data Lakehouse (catalog-verified). The per-cluster signal therefore came from bakta_annotations.product keyword matching for phage, transposase, integrase, plasmid, IS-element, recombinase and conjugation terms across all 132M gene_clusters. Product-name keyword matching is a proxy, not a dedicated MGE caller. 1
The atlas-wide MGE-machinery baseline was 1.37% of KO-bearing gene clusters: 248,908 of 18,204,007 KO-bearing clusters carried MGE-context products; the per-(KO × genus) MGE-machinery output (data/p4d2_ko_genus_mge.parquet) has 3.94M rows and states the same 1.37% atlas baseline. The focal hypothesis sets had 0.57% for Mycobacteriaceae mycolic-acid, 0.00% for Cyanobacteriia PSII and 0.00% for Bacteroidota PUL. The report’s per-hypothesis table lists 6,683, 236 and 1,023 recent gains for these three focal clade × pathway pairs, respectively. By KO category, the MGE-machinery rate was 4.13% for regulatory KOs, 0.37% for metabolic KOs and 0.27% for mixed KOs. The report calls the regulatory rate ~10× higher and reads it as consistent with regulatory products including transposon-bound and phage-bound regulators; that reading is an interpretation, not a test. So the focal KOs are not themselves mostly phage, transposase, integrase, plasmid, insertion-sequence or recombinase products. The report combines these per-cluster rates (0%, 0%, 0.57%) with the PSII gene-neighborhood rate at random baseline (10.91% versus a Poisson expectation of 10.6%). On that basis it judges all three pre-registered focal KO groups not phage-borne. Biome-stratified MGE-machinery rates were similar (~1.1–2.0%), with no strong biome-specific elevation. These rates concern what the clustered proteins are annotated as, not whether the genes travel as cargo. 1
The PSII gene-neighborhood analysis examined 27,148 focal features and 218,321 neighbor pairs. Of the PSII focal features, 10.91% had at least one MGE neighbor within ±5 kb, against a Poisson baseline expectation of 10.6%. The mean MGE-neighbor fraction was 1.65%, which the report calls very close to the atlas MGE-machinery rate of 1.37%. The Poisson expectation assumed the atlas MGE rate p = 0.014 and a mean of n ≈ 8 neighbors. The report concludes there was no MGE-cargo enrichment. The per-feature output table (data/p4d2_neighborhood_psii_per_feature.parquet) has 26,864 rows and reports 10.91% of focal features with an MGE neighbor, at the Poisson baseline; that row count differs from the 27,148 focal features stated above, and the report does not identify which is the analysis denominator. PUL and mycolic gene-neighborhood scans were deferred because large-scale Spark and pandas joins exceeded memory limits. 1
PSII subunits differed in MGE-neighbor frequency, from 3.5% to 22.1% (KO; subunit; focal features; % with an MGE neighbor):
- K02720 PsbZ: 1,769; 22.1%.
- K02718 PsbX/M: 1,500; 15.5%.
- K02704 PsbB (CP47): 1,794; 14.2%.
- K02703 PsbA (D1, RC): 4,217; 13.7%.
- K02710 PsbE (cyt b559α): 1,188; 12.6%.
- K02716 PsbV (cyt c550): 1,386; 3.5%. The report reads this spread as biological texture suggesting differential mobility within the PSII complex. That is a hypothesis, not a test, and the ensemble mean (10.91%) sits at the random-baseline expectation. 1
The report presents the genome-context cross-walk (P4-D2 NB26f/g) as a reusable KBase Data Lakehouse pipeline for cargo-on-MGE measurement at gene-neighborhood scale. It chains pangenome.gene_genecluster_junction → pangenome.gene → kbase_genomes.name → kbase_genomes.feature + contig_x_feature, and adds kbase_ke_pangenome.bakta_annotations.product keyword matching. It was demonstrated on PSII; the PUL and mycolic runs were deferred after a pandas spatial-merge out-of-memory failure. Two limits constrain reuse. The Spark-Connect toPandas driver result-size cap (1GB serialized) is reached when joining 1B-row tables filtered to >200K elements. The pandas spatial-range merge runs out of memory at ~10M+ row scale, which requires batched processing. 1
Methodological contributions
The project contributed a per-rank Producer × Participation framework, Sankoff parsimony with recipient-rank gain attribution and D2 annotation-density residualization. It also contributed a pangenome-to-genome-context MGE cross-walk, leaf_consistency for within-clade uncertainty, and exploratory genus-rank tree-based donor inference. The full atlas contained 11,829,746 Stable, 803,196 Innovator-Isolated, 741,587 Sink/Broker-Exchange and 50,026 Innovator-Exchange tuples, plus 314,607 insufficient-data tuples. The Phase 1B full atlas at UniRef50 spanned 18,989 species × 100,192 UniRef50 groups. The report separates Sankoff as the primary atlas metric (a methodology element) from its KO-level biological signal, d = 0.665–3.558. 1
The architecture census found median architectures per KO of 1 for PSII, 5 for mycolic-acid KOs, 15 for TCS-HK KOs and 46 for mixed-category KOs. Consumer-side architectural-versus-KO concordance (NB17) was r = 0.67, which the report frames as an analog of Denise 2019 (“modular systems exchange more”). This supports the exploratory hypothesis that architectural diversity is associated with cross-clade exchange. The focused architecture census does not establish causation. 1
The architecture-census input came from filtering the atlas to off-(low,low) Producer × Participation tuples. The report gives the result as 10,750 candidate KOs (78% of the 13,062 atlas KOs). The census itself ran on 4 focused subsets totaling 376 KOs. The report’s 78% does not match its own two counts, so the percentage is recorded as written but should not be relied on. 1
The M18 amplification gate separated two effect-size scales. On the UniRef50 baseline the effect was small (d = 0.146). At KO level, the Phase 2 effects were d = 0.665, 0.753, 0.792, 1.905, 2.504 and 3.558. By Cohen 1988 conventions (0.2 small, 0.5 medium, 0.8 large), the report argues these are not below biological significance. On that basis it rebutted a reviewer who conflated the two scales. M18 passed at d = 0.665–3.558 (NB09c; the notebook listing gives PASS at d=0.65–3.56) and was reproduced at full atlas scale in the NB10 M21 sanity rail. There, 6/6 strict pairs passed with 95% CI lower bounds > 0. 1
Sample sizes behind some contrasts were small. The CRISPR-Cas versus RNAP-core contrast (pos_crispr_cas vs neg_rnap_core_strict) had n_pos = 6 and n_neg = 3, with a wide bootstrap 95% CI [1.55, 11.58]. In response, M23 (plan v2.10) pre-registers n_neg ≥ 20 per group for primary hypothesis tests. Under that rule, contrasts against neg_rnap_core_strict (n = 3) and the M21-excluded neg_ribosomal_strict are informational only. neg_trna_synth_strict (n = 20) serves as the load-bearing housekeeping control. A later review raised a separate concern about unstable estimates at n = 6 versus n = 20, which the report says M23 also addresses. According to the report, the 3 PASS pairs against tRNA-synth (n = 20; d = 0.65, 0.79, 2.50) survive M23 with stable estimates. 1
A multiple-testing correction pass enumerated 16 formal tests: four pre-registered hypotheses, six ecology tests and six residualization replications. Fourteen of 16 survived family-wise Bonferroni correction. The two that did not were Mycobacteriaceae × soil enrichment and the NB11 regulatory-versus-metabolic producer test, both already reported as nulls. Leaf_consistency and M26 donor labels were descriptive classifications, not hypothesis-test families. 1
Earlier phases applied a hierarchical multiple-testing strategy. NB11 and NB12 each used Bonferroni α/4 = 0.0125 for 4 focal tests, and NB09c used per-pair bootstrap CIs. Atlas-wide results across the 13.7M scores were exploratory and descriptive by design, under the H0-atlas fallback. 1
Cyanobacteria × PSII test (NB16)
NB16’s pre-registered hypothesis came from the plan v2.11 reframe per M25 and was donor-undistinguished. It predicted that Cyanobacteria would show high Producer and high Participation on PSII Pfam architectures. The test ran as joint Innovator-Exchange (Broker OR Open) without Broker-versus-Open separation, so it cannot say which lineage acted as donor. 1
NB16 results by rank (number of KOs; producer d; consumer d; Mann–Whitney p for producer and consumer; verdict):
- Genus (137 Cyano genera pooled): 2,350; +0.08; −0.53; 1.00 and 1.00; STABLE.
- Family (42 Cyano families): 705; +0.20; −1.28; 0.97 and 1.00; STABLE.
- Order (19 Cyano orders): 301; +0.19; −1.42; 0.99 and 1.00; STABLE.
- Class (
c__Cyanobacteriia): 21; +1.50; +0.70; 2×10⁻⁵ and 2×10⁻⁴; INNOVATOR-EXCHANGE (H1 SUPPORTED). - Phylum (
p__Cyanobacteriota): 21; +1.60; NaN; 7×10⁻⁶ and n/a. The phylum was labelled INNOVATOR-ISOLATED, but no consumer null was available at phylum rank, so that label lacks a consumer test. 1
At class rank both pre-registered criteria passed at α/4 = 0.0125. Producer was above the atlas non-housekeeping median with a very large effect (d = 1.50). Consumer was also above the median with a moderate-large effect (d = 0.70), meaning PSII KOs were less phylogenetically clumped than typical non-housekeeping KOs at class rank. The hypothesis is supported, donor-undistinguished per M25. The phase-level verdict table summarizes it as H1 SUPPORTED at class rank (producer d=1.50, consumer d=0.70, p<10⁻³; 7× lower ancient than atlas-wide PSII, which the report calls a donor-origin signature). The signal is class-rank-only; at family, order and genus rank the pooling washes it out. The report reads this rank gradient as consistent with PSII paralog expansion being a whole-Cyanobacteriia-class property. It says pooling the 137 Cyano genera at genus rank dilutes the signal because most individual genera do not carry the full PSII paralog repertoire. This is an interpretation, not a separate test. 1
PSII acquisition depth (percent of gains in recent / older_recent / mid / older / ancient bins):
- Cyanobacteria PSII gains (n = 1,026): 32.26 / 36.26 / 12.96 / 16.47 / 2.05.
- All PSII gains atlas-wide (n = 11K): 27.37 / 30.58 / 12.85 / 14.31 / 14.90. 1
The report states that Cyanobacteria has “7× fewer ancient PSII gains” than the atlas-wide PSII population. That comparison is between ancient-gain percentages (2.05% of n = 1,026 versus 14.90% of n = 11K), not between absolute ancient-gain counts. The report interprets the low percentage as a donor-origin signature: PSII originated in or near the Cyanobacteria lineage, so Cyanobacteria do not receive ancient cross-phylum PSII transfers. It also reads the atlas-wide 14.9% as including PSII gains in non-Cyanobacteria recipients, namely Chloroflexota and certain Proteobacteria, that received PSII via documented HGT and are ancient for the recipient. These are interpretations; the pre-registered test itself did not identify donors. 1
For the origin claim the report cites Cardona, Sánchez-Baracaldo, Rutherford and Larkum (2018), “Early Archean origin of Photosystem II”, Geobiology 17(2):127–150, doi:10.1111/gbi.12322, PMID 30411862. The report describes that study as phylogenomic and Bayesian relaxed-molecular-clock evidence that a water-oxidizing photosystem appeared in the early Archean ~1 Gyr before the most recent common ancestor of described Cyanobacteria. It places that appearance before the diversification of anoxygenic photosynthetic bacteria. In a later review response the report frames PSII as a class-level, not a within-genus, innovation. There it cites the same author group as Cardona, Sánchez-Baracaldo, Rutherford & Larkum 2019 (Geobiology 17(2):127–150, doi:10.1111/gbi.12322, PMID 30548831), quoting “the evolution of PSII predates the diversification of Cyanobacteria”. It adds that PSII evolved in ancient cyanobacterial lineages before within-genus / within-family diversification. The two bibliographic accounts give the same DOI but differ in year (2018 versus 2019) and PMID (30411862 versus 30548831); the report does not reconcile them, and both are recorded as written. 1
Phase 3 architectural deep-dive (NB17)
Phase 3 closed at gate verdict PASS_MIXED. Consumer KO-to-architecture concordance was r = 0.67 and confirmatory, while producer concordance was r = 0.09 and exploratory. Under plan v2.11, consumer/participation architectural results count as confirmatory (r ≥ 0.6) and producer architectural results as exploratory (r < 0.6). The planned Phase 4 synthesis gives primary weight to Phase 1B and Phase 2 KO-level results. Phase 3 architectures serve as supporting evidence for consumer-side patterns and only as exploratory commentary for producer-side patterns. 1
In the NB17 TCS HK architectural back-test, 292 candidate KOs decomposed into ~4,000 distinct Pfam architectures across 3.2M gene_clusters. The concordance test compared per-(family × architecture) with per-(family × KO) Producer × Participation categories at family rank, joined via interproscan_domains. It used Spearman correlation across the 8,498 (family × architecture) tuples that overlap the Phase 2 TCS HK KO-level atlas. Producer correlation was r = 0.093, below the 0.6 threshold (exploratory); consumer correlation was r = 0.673, above it (confirmatory). The report explains the split as a possible measurement-grain effect. Paralog count is intrinsically a per-KO quantity, and decomposing it across architectures dilutes the producer signal. Cross-clade dispersion, by contrast, is a property of where an architecture lives in the tree, so the consumer signal is preserved. 1
Gain events for the leading TCS HK architectures:
PF00072_PF00486(Response_reg + Trans_reg_C): 76,212.PF00072(Response_reg alone): 39,861.PF00072_PF00196(Response_reg + GerE): 37,528.PF00512_PF00672_PF02518(HisKA + ExtSensor + HATPase_c): 25,878.PF00512_PF02518(HisKA + HATPase_c, the canonical Alm 2006 architecture): 25,462. 1
The report describes the canonical Alm 2006 architecture (HisKA + HATPase_c) as appearing at 25K gain events, with a 44.7% recent / 4.5% ancient profile. It calls this recent-skewed signature consistent with Alm 2006’s lineage-specific-expansion finding. At this stage the separate per-genome r ≈ 0.74 reproduction (HPK count versus recent-LSE fraction) was deferred to Phase 4 P4-D3. Its later outcome, non-reproduction, is recorded under the hypothesis verdicts. 1
Architecture census by focused subset (number of KOs; median architectures per KO; dominant fraction; top architecture):
- PSII (K02703–K02727): 24; 1; 1.00;
PF00124(PsbA). - TCS HK (control_class = pos_tcs_hk): 292; 15; 0.66;
PF00072_PF00486(Response_reg + Trans_reg_C). The report places this class as an atlas-wide signature class whose M21 sanity rail passed at d = 0.65–0.79. - Mycolic-acid (NB12-curated specific): 11; 5; 0.93;
PF13561(Enoyl-ACP reductase). NB12 classified Mycobacteriaceae as Innovator-Isolated at family and order rank. - Mixed-top-50 (highest Innovator-Exchange in mixed-category): 48; 46; 0.76;
PF00005(ABC transporter). NB11 reported a 2× Innovator-Exchange rate for this category versus pure regulatory or metabolic KOs. 1
The report states the census total as 376 KOs and gives a runtime of 131 s for 376 KOs across 3.0M gene_clusters. Its four listed subset counts (24, 292, 11 and 48) do not add up to that stated total, and the report does not explain the discrepancy. The census was focused rather than atlas-wide. An 833M-row IPS scan at the full 10,750-KO scope was infeasible via Spark Connect within practical timescales, so the v2.11 reframe scoped Phase 3 down to focused subsets. 1
The report states that higher architectural diversity per KO correlates with elevated cross-clade exchange at the atlas level. PSII’s near-zero architectural diversity (1 architecture per KO) corresponds to clade-restricted PSII flow through Cyano-internal paralog expansion. Mixed-category KOs’ very high diversity (46 per KO) corresponds to NB11’s elevated Innovator-Exchange rate. The report frames this as “a KO’s structural diversity predicts its propensity to flow” and calls it novel at GTDB scale; the novelty claim is the authors’ own assessment. The evidence is an association across four focused subsets and does not establish causation. 1
As an untested mechanism, the report suggests the hypothesis that KOs with many possible domain combinations are more modular. On this hypothesis they are also less constrained by host-specific protein–protein interaction networks, which is the Jain 1999 complexity hypothesis applied at the architectural rather than the function-class level. The report names Phase 4 P4-D2 (MGE context per gain event) and P4-D3 (Alm r ≈ 0.74) as analyses that could test it formally. 1
Phase 2 interpretive framing
The amplification from d = 0.146 on the UniRef50 baseline to d = 0.665+ at KO level is empirically observed. The M14 close-reading reframed it as metric correction rather than aggregation per se, because Alm 2006 worked at the single-domain (UniRef50-comparable) level. The report notes that a clearer theoretical framing would help Phase 3 interpretation, so the explanation remains incomplete. The Phase 2 closure holds two framings of NB11 side by side, and the project documents both. On one, NB11 is direction-consistent with Jain 1999 at small effect size. On the other, the strong-form asymmetry is falsified at the d ≥ 0.3 threshold. 1
The report treats Burch et al. 2023 (doi:10.1093/gbe/evad089, PMID 37232518) as empirical validation of the complexity hypothesis at the genomic level, and calls NB11 its GTDB-scale instantiation. As described in the report, Burch et al. transferred 74-prokaryote-genome shotgun libraries into E. coli. They found that “transferability declines as connectivity increases”, with translational proteins (regulatory/informational genes) showing the strongest effect. That is an external result reported by this project, not an analysis the project ran. 1
Alm 2006 reproduction (P4-D3)
The P4-D3 script 19_p4d3_alm_2006_reproduction.py joined per-genome HPK (histidine protein kinase) count, taken from PF00512 hits via interproscan_domains, with per-genome recent-LSE (lineage-specific expansion) fraction from M22 recent-rank gain attribution, across all 18,989 P1B-qualified species representatives, and tested four framings of the correlation. Its outputs data/p4d3_per_species_hpk_lse.tsv and data/p4d3_correlations.tsv have 18,989 and 4 rows; the output description reports all four framings at r<0.30. 1
Alm 2006 reproduction framings (n; Pearson r; Spearman r; p):
- HPK count versus recent TCS gains at genus rank: 18,989; 0.288; 0.333; p<10⁻³⁰⁰.
- HPK count versus recent-LSE fraction (per GC): 18,989; 0.157; 0.222; p<10⁻¹⁰⁵.
- HPK count versus recent-LSE per TCS HK KO: 18,989; 0.100; 0.152; p<10⁻⁴³.
- Alm-2006-style HPK fraction versus recent-LSE fraction: 18,989; 0.105; 0.106; p<10⁻⁴⁷. 1
Verdict: NOT REPRODUCED. All four correlations are statistically significant (n = 18,989) but biologically modest (r = 0.10–0.29 versus Alm 2006’s r ≈ 0.74 in 207 genomes). The strongest framing, HPK count versus recent TCS gains at genus rank, recovers r = 0.29, which the report calls less than half of Alm 2006; the notebook listing gives the same r=0.10-0.29 range. 1
The report says the NB17 TCS HK Pfam architectural finding had already established that Alm 2006’s qualitative result holds at architectural resolution. That finding was the canonical PF00512 + PF02518 architecture concentrated at recent ranks, with consumer-side architectural-to-KO concordance r = 0.67. P4-D3 sharpens this: the qualitative TCS HK recent skew remains, but the explicit r ≈ 0.74 anchor does not survive scaling from 207 genomes to 18,989. The report attributes the dilution to taxonomic heterogeneity and to tree-aware versus paralog-count operationalization. It describes the project’s lineage as methodological generalization of Alm 2006, not point-estimate reproduction, and calls its “Alm 2006-inspired” framing honest. It names NB17’s consumer-side r = 0.67 as the project’s strongest connection to Alm 2006. These attributions are the report’s explanation, not separate tests. 1
D2 annotation-density residualization (P4-D5)
The P4-D5 script 20_p4d5_d2_residualization.py regressed producer_z and consumer_z separately on four per-clade aggregate covariates by OLS (ordinary least-squares regression): clade_size, mean annotated_fraction, mean GC% and mean genome_size. It then re-ran the NB11, NB12 and NB16 hypothesis tests on the residualized scores. Producer R² was 0.000: producer_z was uncorrelated with all 4 covariates. The report explains that the within-rank null model behind producer_z already absorbs prevalence and clade-size effects, so it found no producer-side bias to remove. Consumer R² was 0.053, small but non-zero. The coefficients were mean_annotated_fraction_z = −1.27, clade_size_z = +1.13, mean_genome_size_z = −0.49 and mean_gc_z = −0.05. Higher-annotated clades had more negative consumer_z, which the report reads as consistent with fewer “missing” KOs at higher annotation density. Larger clades had less-negative consumer_z. 1
D2 had been specified in plan v1 / v2 as “per-genome annotated-fraction regressed out as nuisance covariate” but was deferred multiple times across phases. ADVERSARIAL_REVIEW_4 / 5 / 6 / 7 each pressed on whether the producer and consumer effects might be annotation-density artifacts. The report calls P4-D5 the closing of this pre-registration debt. Its empirical answer was that producer_z is bias-immune (R² = 0). consumer_z carries a small bias term (R² = 0.05), which does not change any verdict. 1
Selected raw versus residualized hypothesis-test effect sizes (Cohen’s d raw → residualized; p):
- NB11 regulatory versus metabolic producer_z: +0.06 → +0.06; p = 0.69 (null).
- NB11 regulatory versus metabolic consumer_z: −0.21 → −0.21; p <10⁻¹⁰.
- NB12 Mycobacteriaceae × mycolic family producer_z: +0.31 → +0.31; p = 2×10⁻⁶.
- NB12 Mycobacteriaceae × mycolic family consumer_z: −0.19 → −0.16; p = 1.6×10⁻⁵.
- NB12 Mycobacteriales × mycolic order producer_z: +0.29 → +0.29; p = 5×10⁻⁶.
- NB12 Mycobacteriales × mycolic order consumer_z: −0.29 → −0.28; p <10⁻¹⁰.
- NB16 Cyanobacteriia × PSII producer_z (class): +1.50 → +1.50; p = 2.1×10⁻⁵.
- NB16 Cyanobacteriia × PSII consumer_z (class): +0.70 → +0.63; p = 2.3×10⁻⁵. 1
The P4-D5 verdict is that all hypothesis verdicts survive D2 annotation-density residualization. The largest attenuation was NB12 family-rank consumer-side, from d −0.19 to −0.16 (~16% relative attenuation), which stayed significant. NB11 H1 REFRAMED (consumer-side d −0.21, complexity-hypothesis direction), NB12 H1 SUPPORTED and NB16 H1 SUPPORTED at class rank all preserve direction and significance under residualization. 1
P4-D5 outputs were data/p4d5_residualized_atlas.parquet (13.7M rows), data/p4d5_diagnostics.json, data/p4d5_hypothesis_replication.tsv and figures/p4d5_residualization_panel.png. The data inventory lists the residualized atlas and the replication table at 13.74M and 8 rows and states that all hypothesis verdicts are preserved under residualization. The figure combines a residualization scatter with a raw-versus-residualized comparison of hypothesis-test d values, again with all verdicts preserved. 1
Pangenome-openness cross-validation (P4-D4)
The P4-D4 script 21_p4d4_pangenome_openness_validation.py cross-correlated per-species pangenome openness with M22 recent-rank gain attribution at the per-genus level. Openness was computed as 1 − no_core/no_gene_clusters from kbase_ke_pangenome.pangenome (motupan output). The deliverable was designed as an independent-substrate cross-validation of M22. Openness is only meaningful for multi-genome species, so the 18,989 P1B-qualified species representatives reduced to 10,856 with no_genomes ≥ 3. Of 3,539 genera with at least one multi-genome species, 894 had ≥3 multi-genome species and formed the T1 substrate. M22 supplied 7.95M recent-rank gain events (depth_bin = ‘recent’, recipient_genus non-null). 1
P4-D4 results (n genera; Pearson r; Spearman r; 95% CI; verdict):
- T1 atlas-wide openness versus log(recent gains): 894; +0.017; −0.011; (−0.08, +0.06); null.
- T2 regulatory KOs only: 894; +0.023; −0.013; (−0.08, +0.05); null.
- T2 metabolic KOs only: 894; +0.010; −0.017; (−0.08, +0.05); null.
- T3a Mycobacteriaceae × mycolic: 10; +0.46; +0.41; (−0.43, +0.86); directional, underpowered.
- T3b Cyanobacteriia × PSII: 83; +0.11; +0.12; (−0.10, +0.34); directional, underpowered. 1
The report defines M22 recent-rank gains as between-species KO presence/absence transitions on the GTDB species tree, inferred by Sankoff parsimony across species representatives. A “recent gain” is a KO acquired by one species but absent in its sister species. Pangenome openness is instead within-species genome-set diversity: the fraction of non-core gene clusters across multiple assemblies of one species, where high openness means high strain-level variability. P4-D4 assumed the two would correlate; empirically they did not. The report concludes that pangenome openness is not a valid cross-substrate validation of M22, because the two measure distinct phenomena. On this reading, the null clarifies that M22 detects lineage-level (between-species) gain attribution, not within-species strain diversity. 1
Both targeted tests had positive directions, consistent with the NB12 and NB16 verdicts, but both confidence intervals span zero. The report attributes this to too few genera to lift the CI off zero. Multi-genome species coverage in these clades was the limiting factor: only 289 species across 10 genera in Mycobacteriaceae, and 185 species across 83 genera in Cyanobacteriia. 1
The report states that no headline verdict changes: NB11 H1 REFRAMED, NB12 H1 SUPPORTED and NB16 H1 SUPPORTED all stand, and the atlas-wide null does not undermine any pre-registered result. Cross-substrate validation of M22 remains an open project commitment that P4-D4 did not deliver. The report names P4-D1 phenotype/ecology grounding as the only remaining Phase 4 path. That test asks whether high recent acquisition in a function class correlates with the biomes and phenotypes expected for that class. figures/p4d4_openness_vs_acquisition.png is the four-panel openness-versus-M22-recent-acquisition figure, reporting the atlas-scale informative null (Spearman r=−0.011). 1
Ecological grounding audit (P4-D1)
The report calls P4-D1 the project’s interpretive layer. It grounds the pre-registered atlas findings against three independent KBase Data Lakehouse-internal substrates, which turned out to have far better coverage than the v2.9 plan acknowledged. The NB22a–22f audit found two pangenome-internal substrates the plan had missed: kbase_ke_pangenome.ncbi_env (4.1M-row EAV environment metadata) and kbase_ke_pangenome.alphaearth_embeddings_all_years (64-dim satellite-imagery environment vectors). Combined with kescience_mgnify (28.4% biome coverage), these gave richer environmental annotation than the plan’s external-substrate list (NMDC, MGnify, GTDB metadata, BacDive, Web of Microbes, Fitness Browser). In ncbi_env, isolation_source covered 76.8% and geo_loc_name 88.8% of the 18,989-species substrate. The report states that all three pre-registered atlas findings ground cleanly in expected biomes at p < 10⁻¹¹. These are NB12 mycolic-acid Innovator-Isolated, NB16 PSII Innovator-Exchange and Phase 1B Bacteroidota PUL. Two of the three were also confirmed by BacDive phenotype anchors, and three of three by AlphaEarth environment-cluster concentration. These are associations with expected environments, not causal tests. The same passage calls Phase 1B Bacteroidota PUL a confirmed pre-registered hypothesis. The final verdict table instead records PUL H1 as falsified at the pre-registered criterion. Both labels are recorded as written. 1
Phase 4 synthesis outputs
Phase 4 data deliverables included the following:
data/p4_genus_rank_quadrants_tree_proxy.tsv(4.06M rows): M26 tree-based donor inference at genus rank on the Phase 3 candidate set, with Open/Broker/Sink/Closed labels; this layer is exploratory.data/p4_conflict_analysis.tsv(2.55M rows): per-tuple disagreements with hypothesis classification.data/p4_per_event_uncertainty.parquet(17.07M rows): M22 gains ×n_leaves_underplus leaf_consistency at 97.8% coverage, declining monotonically from 0.34 for recent gains to 0.20 for ancient gains.data/p4_leaf_consistency_lookup.parquet(13.75M rows): per-(rank × clade × KO) species-with-KO / total-clade-species lookup.data/p4_review9_mycolic_genus_lc.tsv(13 rows): per-Mycobacteriaceae-genus mean leaf_consistency on the mycolic KO panel, the basis for the sub-clade split.data/p4d1_env_per_species.parquet: 18,992 species × 97 environmental attributes. This species count differs from the 18,989 atlas species representatives, and the report does not explain the difference.data/p4d2_neighborhood_psii_per_feature.parquet: 26,864 PSII gene-neighborhood MGE-cargo records.- Also in the data inventory, from Phase 1B:
data/p1b_full_extract_local.parquet, 28M (species, UniRef50) presence rows. 1
Review responses
A reviewer flagged a DTL reconciliation literature gap (Bansal 2013), a real foundational methods paper not previously in the references. The report added it to references.md v2.5 as the principled methodology against which its Sankoff parsimony is the lightweight, tractable alternative at GTDB scale. The report accepts that its Sankoff parsimony approximation operates without principled benchmarking against modern DTL reconciliation methods. The reviewer flagged two real papers, with DOIs verified. One is Liu, Mawhorter, Liu et al. (2021), “Maximum parsimony reconciliation in the DTLOR model”, BMC Bioinformatics 22(Suppl 10):394, doi:10.1186/s12859-021-04290-6, PMID 34348661. Its DTLOR model extends DTL to handle gene origin from outside the sampled species tree and rearrangement of syntenic regions. The paper is a literature comparator; the project did not benchmark against it. 1
At this review stage M22 lacked validation anchors (C5 = REVIEW_5 I6 / REVIEW_6 I2); validation was deferred to Phase 4 P4-D1/P4-D3. This qualifies interpretations that rest on M22 gain attribution. 1
Reviewers also flagged the mycolic-acid effect at order rank as marginal (d=0.288; I2 = REVIEW_5 I5), which the report says was already listed in its v2.2 Limitations. 1
On multiple testing (I5 = REVIEW_5 C4 / REVIEW_6 C4), Bonferroni correction was applied per test family: NB11, NB12 and NB16 each had 4 tests at α/4. Atlas-wide multiple testing across 13.7M scores is exploratory by design, per the H0-atlas fallback in plan v2. 1
Reviewers raised the Cyanobacteria PSII n=21 sample size and its rank-dependent contradictions (C1 + C4 + C6), which the report accepts as a real concern. It calls the class-rank result statistically defensible: producer α=2×10⁻⁵ and consumer 2×10⁻⁴ are both well below Bonferroni α/4=0.0125, and the small n is balanced by the very large effect d=1.50. It concedes that the rank gradient (STABLE at genus/family/order, INNOVATOR-EXCHANGE at class) requires a clearer explanation. Its sharpened framing is that the genus, family and order ranks pool 137, 42 and 19 individual Cyano clades respectively, and most individual genera do not carry the full PSII paralog repertoire, diluting the signal; the class rank pools all 21 PSII KOs across the single Cyanobacteriia clade. This dilution account is an interpretation, not a separate test. 1
The report notes that the plan v2.10 M23 minimum (n_neg ≥ 20 for primary tests) does not directly apply here. The test compares Cyanobacteria PSII to the atlas non-housekeeping reference (n_ref ≫ 1000); it is the Cyano-PSII target sample that is small. The report specifies that n=21 counts the 21 PSII KOs themselves (K02703–K02727 minus a few absent in the atlas). Each KO is treated as one observation against an atlas-wide reference of 554,280 (KO × clade) tuples at class rank, so n=21 is not 21 independent species observations. The class-rank test asks whether PSII KOs sit higher in the Cyanobacteriia score distribution than reference KOs do in their own class distributions. The report answers yes (d=1.50, p=2×10⁻⁵). 1
On effect-size inflation at small samples (C4), the report calls the concern real but partially circular. It acknowledges that Cohen’s d has higher variance at small N, but argues that a stable d=1.50 with a bootstrap-CI-positive lower bound and α=2×10⁻⁵ is a real effect detected at small N, not inflation by chance. It reads the flagged pattern (smaller N → larger d) as partly the statistical reality that small-N tests need larger d to clear significance, and cites NB17’s r=0.09 producer concordance as showing that small effects do not survive at architectural granularity. This is the report’s argument, not an independent check. 1
The report added Ślesak 2024 to its references and states that NB16’s 7× lower ancient % in Cyanobacteria is consistent with both Ślesak 2024 and Cardona 2018, which it says jointly support PSII donor origin. This is supporting literature, not a direct donor-composition test. 1
The report also draws an analogy with Denise 2019, whose finding that “systems encoded in fewer loci were more frequently exchanged between taxa” it calls the genome-organization analog of its NB15 “more architectures per KO → more exchange” finding; both frame structural-organization simplicity as a driver of cross-clade flow. The two measures are not identical, and here the analog is attached to NB15 whereas the architecture-census passage above attaches the Denise 2019 framing to NB17 concordance. 1
Data sources and coverage
The project drew on the KBase Data Lakehouse. 1
- The
kbase_ke_pangenomecore scaffold covers 293K genomes and 27,690 species. It comprises the genome, GTDB species-clade, GTDB r214 taxonomy, metadata and pangenome tables. - InterProScan-derived annotation supplied authoritative Pfam (833M hits, 83.8% cluster coverage), GO (Gene Ontology) terms, and MetaCyc plus KEGG pathways.
- MGnify biome labels (
kescience_mgnify.speciesbiome_id) covered 28.4% of species (5,392 species) across 18 biome categories. - BacDive phenotype anchoring covered 32% of species (6,066 species) through a GCF→GCA fallback; 100% of matched species have metabolite, physiology or enzyme rows.
- NMDC sample-level taxa enrichment (
nmdc_arkin) covered 9.4% of species (1,791 species) by species-taxid overlap, and was treated as supplementary. - A Fitness Browser BBH (bidirectional best hit) cross-walk covered 0.18% of species (35 species) and was used for point-validation only. 1
Environmental grounding coverage was uneven. Per-genome BioSample mapping reached 100%. The 4.1M-row BioSample environmental metadata table was much less complete. The substrate audit gives its field coverage as a share of the 18,989 atlas species, not of metadata rows: isolation_source 76.8%, geo_loc_name 88.8%, env_broad_scale (ENVO controlled vocabulary) 48.6% and lat_lon 47.3%. AlphaEarth 64-dim satellite-imagery environmental vectors (alphaearth_embeddings_all_years) covered 27.2% (5,157 species). GTDB metadata ncbi_isolation_source had 74.6% non-trivial coverage, but the audit marks it as redundant with ncbi_env. P4-D1 used MGnify biome categorical labels (28% species coverage, 18 biome categories) but did not query the MGnify per-sample taxa-coverage matrices. The report names those matrices a substantive future direction for finer-grained ecological inference. 1
The Pfam substrate was chosen by audit. The plan had specified bakta_pfam_domains for architectural work, with a HMMER recompute fallback. The fallback was needed because a prior audit (the plant_microbiome_ecotypes pitfall) had found 12/22 marker Pfams silently missing. The NB13 audit reproduced the pattern: 7 of 33 marker Pfams had zero clusters in bakta_pfam_domains. These included all 4 critical PSII Pfams (PsbA/PF00124, PsbB/PF02530, PsbC/PF02533, PsbD/PF00421). interproscan_domains had only 1 zero-coverage marker (PF13415, a minor HATPase variant). The median bakta/IPS (InterProScan) coverage ratio was 0.102, which the report describes as ~10× higher IPS coverage on average. Phase 3 therefore used interproscan_domains for all architectural work, which removed the need for the HMMER fallback. The bakta substrate had zero PSII Pfam hits, so the Cyanobacteria PSII test would have been structurally impossible under it. 1
Figures
- Hero 1 Atlas Innovation Tree: top 20 phyla × recent-acquisition fraction × dominant biome × log species count, with the 3 confirmed-hypothesis-bearing phyla (Actinomycetota, Cyanobacteriota, Bacteroidota) highlighted.
- Hero 2 Three-Substrate Convergence Card: 3 hypotheses × {atlas Cohen’s d, biome enrichment fold, BacDive phenotype %}.
- Hero 3 Acquisition-Depth Function Spectrum: per-control-class recent versus ancient % with recent-to-ancient ratio annotation (CRISPR-Cas 24.5×, housekeeping ~1×).
- Supporting 4 PSII rank-dependence ladder: genus n=2,350 d=0.08 STABLE → class n=21 d=1.50 INNOVATOR-EXCHANGE → phylum d=1.60 INNOVATOR-ISOLATED; the figure description calls this a reversal but does not establish its cause.
- Supporting 5 Hypothesis Verdict Card: 5 hypotheses × {atlas effect, ecology fold-enrichment, phenotype anchor, MGE verdict, final disposition}.
- Supporting 6 Function × Phylum × Environment flow: KO category → recipient phylum → dominant biome.
- The NB22-deliverable atlas heatmap (% Innovator-* tuples per top-20 phylum × control class at family rank) and four-quadrant summary (genus-rank Open-Innovator / Broker / Sink / Closed distributions via M26 tree-based donor inference for the top-8 phyla on the Phase 3 candidate set, plus confirmed-hypothesis-clade breakdowns). 1
Further panels include H3-B, the control-class signature plane (recent fraction × leaf_consistency), which validates the housekeeping-versus-HGT-active framework. S7 is the per-hypothesis leaf_consistency distribution: PSII LC = 0.88 (canonical class-defining), PUL 0.41 (phylum tendency), and mycolic 0.15, below the atlas 0.20, which reveals within-Mycobacteriaceae heterogeneity. S8 is an atlas confidence ridge reporting leaf_consistency by depth bin: recent 0.34, older_recent 0.30, mid 0.26, older 0.23, ancient 0.20; the report reads it as independent validation of the M22 acquisition-depth signal. figures/p2_nb11_regulatory_vs_metabolic.png shows the Phase 2 Tier-1 regulatory-versus-metabolic comparison. 1
figures/p2_nb11_regulatory_vs_metabolic.png is a three-panel comparison of scores, acquisition depth and Cohen’s d. figures/p2_nb12_mycobacteriota_mycolic.png summarizes the NB12 Mycobacteriaceae × mycolic-acid result in three panels: producer versus reference, the Producer × Participation pie, and an acquisition-depth comparison. figures/p3_nb16_cyanobacteria_psii.png depicts the NB16 Cyanobacteria PSII test. figures/p3_nb17_tcs_hk_architectural.png shows the NB17 TCS HK architectural back-test: consumer concordance r = 0.67, producer concordance r = 0.09 and the canonical PF00512_PF02518 architecture at 25K gain events. 1
Phase 1A figures document the null model and pilot: figures/p1a_paralog_count_distribution.png plots paralog count per UniRef50 by control class; figures/p1a_null_producer_distribution.png shows the producer-z null cohort distribution per prevalence bin; figures/p1a_null_per_rank_distributions.png shows per-rank null distributions from genus to phylum, each rank with its own cohort moments; figures/p1a_null_consumer_distribution.png shows the single-rank consumer-z permutation null, later superseded by the Phase 1B M14 Sankoff diagnostic; and figures/p1a_scores_by_class_per_rank.png plots producer and consumer z by control class per rank. 1
Further Phase 1 figures are as follows. figures/p1a_producer_consumer_per_rank.png (NB03) is a per-rank producer-versus-consumer scatter colored by control class, an atlas-style view of the pilot. figures/p1b_null_per_rank_distributions.png (NB06) shows full-GTDB-scale null distributions per rank and replicates the Phase 1A NB02 pattern at 18,989 species. figures/p1b_scores_by_class_per_rank.png shows full-scale producer and consumer z by control class per rank. figures/p1b_bacteroidota_pul_position.png (NB07) shows Bacteroidota PUL CAZyme position against other phyla per rank, visualizing the pre-registered test outcome. figures/p1b_metric_diagnostic_panels.png (NB08c) is a four-panel per-class diagnostic comparing parent-rank dispersion with Sankoff parsimony as discrimination metrics; it surfaces the M14 metric correction. 1
Phase 2–3 figures are as follows:
figures/p2_m18_amplification_panel.png(NB09b) records the first-pass M18 amplification gate, a MARGINAL verdict before the M21 strict-class correction.figures/p2_m18c_strict_class_panel.png(NB09c) records the strict-class retest, PASS at d=0.65–3.56 with M21 strict housekeeping.figures/p2_ko_atlas_per_rank.png(NB10) shows per-rank score distributions for 13.7M (rank × clade × KO) producer/consumer scores.figures/p2_m22_acquisition_depth_per_class.png(NB10b) shows per-class acquisition depth for 17M gain events tagged by recipient-rank LCA (lowest common ancestor), recovering the recent-to-ancient function-class signature.- The NB11 figure presents the reframed verdict (small effect, complexity-hypothesis direction).
- The NB12 figure presents H1 SUPPORTED at family + order ranks.
- The NB16 figure presents class-rank H1 SUPPORTED (d=1.50 producer, 0.70 consumer).
- The NB17 figure gives consumer concordance r=0.67 (confirmatory) and producer r=0.09 (exploratory). 1
Phase 4 figures are as follows:
figures/p4d1_clade_biome_panel.png(NB23b) shows clade × biome enrichment: Cyanobacteriia 2.77× photic, Mycobacteriaceae 7.88× host-pathogen and Bacteroidota 1.40× gut/rumen.figures/p4d1_bacdive_phenotype_panel.png(NB24b) shows the BacDive anchors: Mycobacteriaceae aerobic-rod-catalase and Bacteroidota saccharolytic, with Cyanobacteriia n=4 too thin.figures/p4d1_alphaearth_env_cluster_panel.png(NB25) is the AlphaEarth k=10 environment-cluster panel, with Cyanobacteriia C0 marine at 35.6%.figures/p4d2_mge_context_panel.png(NB26b/c) gives per-category, per-hypothesis and per-biome MGE-machinery rates: atlas baseline 1.37%, hypothesis KOs ≤0.57%.figures/p4d3_alm_2006_reproduction.png(NB19) shows the four GTDB-scale framings of the Alm 2006 r ≈ 0.74 reproduction: NOT REPRODUCED (r=0.10–0.29). 1
Caveats and limits
The project did not identify donors at deep ranks, because per-CDS sequence data (codon usage, k-mers) were not available in queryable KBase Data Lakehouse schemas. M26 tree-based donor inference at genus rank (NB28b) uses the existing M22 output, the species tree and the presence matrix. It produces Open/Broker/Sink/Closed labels with explicit ambiguity bookkeeping. It shipped as an exploratory layer, separate from the deferred M25 composition-based donor inference. M26 algebraically counts potential family-mate donors, which biases it toward Open-Innovator classifications. According to the report, composition-based inference would require external FASTA and codon profiling that breaks the Phase 3 budget. Phase 3 therefore reports at the joint Innovator-Exchange label (Broker-or-Open donor-undistinguished), the same level at which Alm 2006 made claims. Per-family DTL reconciliation (AleRax / ALE) does not run at full GTDB scale. The four-quadrant labels therefore exist only at genus rank on the Phase 3 candidate set (~10K KOs), not atlas-wide. Composition-based confirmation and full DTL reconciliation cross-validation (Liu 2021 DTLOR / Bansal 2013) remain future work. 1
The PSII result is rank-dependent. At genus rank, n = 2,350 with d = 0.08 was STABLE. At class rank, n = 21 PSII KOs with d = 1.50 was Innovator-Exchange. At phylum rank, d = 1.60 was classified Innovator-Isolated. The report considers class rank biologically appropriate per Cardona 2018, since PSII evolved before Cyanobacteria diversified, and so describes the genus null as expected. It attributes the phylum reversal to a substrate artifact: insufficient reference consumer data left the phylum consumer statistic unavailable. Genus, family and order results were STABLE. The report reads the d ≈ 0.08–0.20 producer signals at finer ranks as the expected near-uniformity of a near-universal feature with deep ancestry: genera should not be innovating PSII because it is already shared. It notes that the phylum producer signal (d=1.60) is consistent with the class signal (d=1.50). It says the verdict shifts to ISOLATED solely because consumer data thin out at phylum rank. The class-rank interpretation fits PSII being a class-defining, ancient innovation, but it should not be generalized to all taxonomic ranks. The report itself preserves this caveat: PSII Innovator-Exchange is specifically a class-rank phenomenon, not a generic Cyanobacteria-wide HGT signature at every resolution. The supported claim is narrower: Cyanobacteriia as a class exchange PSII KOs more than reference clades do, with 2.77× photic enrichment (p<10⁻⁵²) and 2.05% ancient gains versus 14.9% atlas-wide. 1
The Alm 2006 quantitative correlation was not reproduced. The project’s 18,989-species substrate differs from the original 207-genome substrate. M22 measures tree-attributed gain events, not all per-genome paralog expansion. The two analyses also define “recent” differently. The report names three mechanisms: substrate-scale heterogeneity, tree-aware versus paralog-count operationalization, and tree-rank granularity. On substrate, Alm 2006 used 207 genomes, mostly cultivated isolates with high annotation density and broad taxonomic spread, whereas this substrate spans the full GTDB tree, including DPANN, CPR and weakly annotated lineages where HPK detection is genuinely sparse; the report argues the original signal is taxonomically heterogeneous and aggregating across the full tree dilutes it. On LSE detection, Alm 2006 used per-genome paralog counts at the HK family level, whereas M22 Sankoff recent-rank gain attribution is tree-aware and would miss expansions occurring entirely within a single recent species, so the two metrics measure overlapping but non-identical phenomena. On granularity, “recent” in M22 is a leaf-adjacent gain on the species tree that captures within-genus diversification, while Alm 2006’s LSE captured all expansion regardless of phylogenetic depth; the definitions converge for very-recent expansions and diverge for older ones. These are proposed explanations, not separately tested. The methodology generalizes, but the point estimate does not survive scaling from 207 to 18,989 genomes. 1
PUL and mycolic gene-neighborhood analyses were limited by scale. The report’s limitations list attributes the deferral to a pandas spatial-merge out-of-memory failure at Bacteroidota scale. Its run log, described below, gives a different account: the full-scale scan of 723K Bacteroidota focal features × 210K contigs failed on the Spark driver result-size cap, and the pandas failure came in a sampled run. The report does not reconcile these two accounts. Only the PSII neighborhood analysis shipped. For PUL and mycolic systems, the non-phage-borne conclusion therefore rests on per-cluster MGE-machinery rates (0% / 0.57%) and literature context, not on complete cargo-neighborhood scans. The report judges these rates sufficient for the headline conclusion. Its run log is more specific. Bacteroidota has 2,581 species, which the report gives as 8.4× Cyanobacteriia’s 309; the limitations list gives the ratio as 8×. Even the SusC/SusD canonical-only scan (2 KOs) yielded 723K focal features × 210K contigs. Its Stage 5 result, 1.3GB serialized, exceeded spark.driver.maxResultSize on toPandas. A run sampled to 309 random Bacteroidota species (80K focal features × 21K contigs, ~105 features/contig) then ran out of memory in the Stage 6 pandas merge (~24M rows × 9 cols, a 9GB DataFrame). The Mycobacteriaceae sampled run never started. The report’s decision was to ship without batched PUL/mycolic neighborhoods, stating that those scans would refine the picture but not change the headline. It nonetheless states a mechanism conclusion: mycolic-acid, PSII and PUL genes flow via chromosomal recombination and ICEs rather than phage-mediated transduction. It adds that the at-baseline PSII neighborhood rules out PSII gains travelling as phage/MGE cargo. For PUL and mycolic acid that mechanism claim rests on per-cluster rates and literature, not on direct cargo tests. 1
Cyanobacteria BacDive coverage was only n = 4. The P4-D4 pangenome-openness cross-validation was null at atlas scale, with Spearman r = −0.011 across 894 genera; the two P4-D4 outputs (data/p4d4_pangenome_openness_per_genus.tsv and data/p4d4_recent_acquisition_vs_openness.tsv) have 3,539 and 894 rows. The report reads this informative null as evidence that M22 and pangenome openness measure distinct evolutionary phenomena. The targeted Mycobacteriaceae and Cyanobacteriia openness tests were underpowered, with n = 10 and n = 83 genera, respectively. 1
Cross-phase uncertainty was not propagated into a unified atlas confidence interval. Bootstrap confidence intervals for individual M22 events were deferred. Sankoff results were not comprehensively cross-validated against DTLOR or other modern reconciliation methods. The ecology results show association or consistency with expected environments, not a causal effect of environment on gene innovation. 1
At the Phase 2 close, the verdict table recorded several items as not yet established. Bacteroidota PUL → Innovator-Exchange (Phase 1B) was falsified at the UniRef50 absolute-zero criterion (NB07) and reframed at the v2.5 close-reading, with a KO retest deferred. Cyanobacteria × PSII → Broker (Phase 3) was not yet tested, pending an architectural deep-dive at genus rank. The Alm 2006 TCS HK reproduction at r ≈ 0.74 (P4-D3) was not yet tested and was deferred to Phase 4. The later outcomes of these items appear in the hypothesis verdicts above. In the verdict table that includes the NB16 result, the report summarized: 2 of 4 currently-testable pre-registered hypotheses confirmed; 1 falsified at UniRef50; 1 reframed at small effect size in the literature-predicted direction. That count labels the PUL hypothesis falsified, whereas the final synthesis calls it a qualified pass/reframed finding; both labels are recorded as written. 1
External validation was staged across phases. The CRISPR-Cas 24.5× and tRNA-synth 2.3× recent-to-ancient ratios align qualitatively with the HGT literature (Smillie 2011, Forsberg 2012, Metcalf 2014, Phillips 2012). At Phase 2 they had not been quantitatively cross-validated against an independent dataset. All Phase 2 tests use atlas-derived scores. Tests against independent experimental HGT datasets were deferred to Phase 4. That work centred on P4-D1 phenotype/ecology grounding (NMDC, MGnify, Fitness Browser, BacDive, Web of Microbes) and the explicit Alm r ≈ 0.74 reproduction (P4-D3). 1
Effect-size reporting was inconsistent across phases. In response, plan v2.10 M24 made Cohen’s d with a 95% bootstrap CI the standard format for all primary statistical comparisons going forward. The report counts 25 methodology revisions (M1–M25), each documented in the research plan revision history with its rationale and triggering observation. It lists three pre-registration omissions that surfaced and were corrected as project-discipline lessons: M2 dosage biology, the M12 absolute-zero criterion and the M14 misreading-of-Alm-2006. 1
The report contradicts itself on D2 residualization. The headline says both confirmed hypotheses (2 of 4 confirmed) survived D2 annotation-density residualization. The P4-D5 passage instead says 3 of 4 confirmed hypotheses survive D2 residualization. Both statements are recorded here as written; they are not reconciled. The final synthesis repeats the inconsistency. It closes with 2 of 4 pre-registered weak-prior hypotheses confirmed, yet says all 3 confirmed hypotheses are ecologically and phenotypically grounded and that all atlas claims survive annotation-density residualization. Its closing assessment likewise says 3 of 3 confirmed hypotheses are anchored in expected biomes and phenotypes. The same assessment describes the pre-registered KOs as not phage-borne and says ICEs and chromosomal recombination are implicated by literature, not measured. 1
Review integrity was uneven across rounds. REVIEW_4, REVIEW_5 and REVIEW_7 contained fabricated citations (verified via PubMed); REVIEW_8 had 0 fabrications and 7/7 DOIs auto-verified. It raised 3 critical, 4 important and 2 suggested issues against the v3.0 Final Synthesis. The report checked its numerical claim C9 (n=2,350 d=0.08 at PSII genus rank) against data/p3_phase_gate_decision.json and found it accurate. It said C7 was already addressed in v3.0. It judged C8 partially valid but said C8 conflates methodology-revision-as-transparency with multiple-hypothesis testing. The project summary counts 7 integrated adversarial reviews (REVIEW_1 through REVIEW_7). It documents three reviewer-side fabrications or errors: the Mendoza 2020 PMID hijack at REVIEW_5, Koech 2025 at REVIEW_7 and a Burch 2023 PMID error at REVIEW_7. That list omits the REVIEW_4 fabrications noted above, and the report does not reconcile the two accounts. In REVIEW_5 I1, the cited “Mendoza 2020 Hologenome evolution” paper was fabricated. Its PMID 32160912 actually points to Rezaeipandari et al. (2020), a Persian-language WHOQOL-OLD quality-of-life validation study in Health and Quality of Life Outcomes, unrelated to HGT. PubMed searches for the purported Mendoza HGT work returned 0 results. The attached claim that regulatory genes show 50-fold lower transfer rates than metabolic genes is therefore treated as fabricated, not as evidence. 1
Reviewer errors were not limited to citations. REVIEW_4 C1 falsely claimed that Alm 2006 was not cited; the report rebuts this by pointing to references.md line 9. 1
Slots Into
- gene-function-acquisition-depth — Sankoff/M22 acquisition depth, recent-to-ancient function-class signatures, leaf_consistency, the hypothesis verdicts and the NB11 regulatory-versus-metabolic null.
- horizontal-gene-transfer-driven-innovation — the PUL qualified pass, PSII class-rank Innovator-Exchange, the non-phage-borne focal KOs, the Jain 1999 / Burch 2023 direction and exploratory M26 donor inference.
- taxonomic-resolution-dependent-functional-inference — PSII rank-dependence, the narrowing of the mycolic-acid result from family to sub-clades, and the Phase 1A consumer-z clumping that weakens at class rank.
- sampling-depth-and-downsampling-effects — Alm 2006 r ≈ 0.74 not surviving the scale-up from 207 to 18,989 genomes.
- phylogenetic-confounding-of-pangenome-associations — tree-aware Sankoff gain attribution replacing the parent-rank permutation null, and D2 residualization.
- pangenome-openness-determinants — the informative null between M22 acquisition and pangenome openness.
- two-speed-bacterial-genome — CRISPR-Cas versus housekeeping recent-to-ancient ratios as HGT-active versus vertical signatures.
- composite-functional-annotation — mixed regulatory+metabolic KOs carrying the highest Innovator-Exchange rate.
- ontology-and-category-schema-sensitivity — architecture-per-KO medians and architectural concordance.
- structural-annotation-gap — annotation-density bias diagnostics (producer_z versus consumer_z R²).
- scale-dependent-mobile-element-associations — PUL/mycolic gene-neighborhood scans blocked by join scale.
- confirmatory-exploratory-ecological-association-discordance — the Bonferroni pass separating confirmatory tests from reported nulls.
- adversarial-research-quality-assurance — fabricated reviewer citations, the internal residualization-count inconsistency, the Alm 2006 close-reading, post-hoc criterion revisions and the focused-diagnostic discipline.
- cultivation-collection-bias-in-ecological-genomics — uneven BioSample, MGnify and NMDC coverage of species.
- phenotype-database-coverage-bias — BacDive 32% species coverage and the n = 4 Cyanobacteriia anchor.
- cofitness-network-architecture — Producer × Participation categories and the association of architectural diversity with cross-clade exchange.
- ecotype-environment-gene-content — clade-specific gene-function patterns refined by biome consistency, phenotype anchors and within-clade leaf_consistency.
- environment-embedding-geography — AlphaEarth environmental embeddings, k = 10 clustering and their partial coverage.
- environmental-resistome — recent-to-ancient acquisition signatures for β-lactamases, CRISPR-Cas, TCS-HK and housekeeping controls, and pilot AMR consumer z masked by a parent-phylum anchor.
- pangenome-integration — integration of KO presence, pangenome openness, GTDB phylogeny, the Fitness Browser cross-walk and genome-context MGE measurements.
- homology-search-negative-evidence — NB13 found 7 of 33 marker Pfams, including all 4 PSII Pfams, absent from
bakta_pfam_domains, whereas InterProScan had only 1 zero-coverage marker. - evidence-triangulation-for-functional-annotation — the bakta/IPS median coverage ratio of 0.102 drove the choice of InterProScan as the authoritative Pfam source.
- callability-limited-comparative-inference — the PSII test would have been structurally impossible on the bakta substrate.
- genomic-under-representation — the long-deferred annotated-fraction adjustment, and the finding that consumer_z carries only a small annotation-density bias (R² = 0.05) that changes no verdict.
- cross-tenant-data-bridging — GTDB
ncbi_isolation_sourceredundant withncbi_env, NMDC species-taxid overlap only supplementary, and thegenomad_mobile_elementstable not ingested, forcing Bakta product-keyword MGE matching. - lab-field-fitness-concordance — the Fitness Browser BBH cross-walk reached only 35 species and served for point-validation only.
- functional-marker-validation — the saccharolytic, glycoside-hydrolase-rich Bacteroidota BacDive profile as a PUL phenotype anchor, phenotype anchoring that was infeasible for Cyanobacteriia at n = 4, the AMR positive control confounded by AMRFinderPlus Pseudomonadota detection bias, and description-matched ribosomal negative controls contaminated by accessory and false-match proteins.
- chromosomal-and-integrative-gene-transfer — focal KOs judged not phage-borne, with ICE and chromosomal-recombination transfer implicated by literature rather than measured, and deep-rank donor identification deferred.
- multi-omics-integration — cross-substrate convergence across phylogenomic scores, environmental metadata, phenotype tables and gene-neighborhood evidence. 1