The AlphaEarth-linked genome subset is clinically skewed, meaning human-associated genomes are overrepresented 1 2. One project finds that group comparison does not reveal a stronger environment–gene-content correlation, and the evidence does not support the claim that the skew alone explains the weak relationship 1. The other finds that environmental samples carry stronger geographic structure in their AlphaEarth embeddings, which are learned numerical representations of each sample’s location context 2. The open question is why a spatial signal that is stronger in environmental samples is not matched by a gene-content signal. The answer bears on whether environment-linked gene-content patterns in sampling-depth-and-downsampling-effects reflect ecology, sampling composition, or measurement limits.
Evidence Sides
Side 1: The bias is real but does not explain the weak gene-content signal
The principal tension is between confirmed clinical sampling bias and the absence of a stronger environmental correlation after group comparison 1. The AlphaEarth subset is clinically skewed, but the evidence does not support the claim that this skew alone explains the weak environment–gene-content relationship 1. This is a null result for the bias-explanation claim, not a finding that environment has no effect on gene content 1.
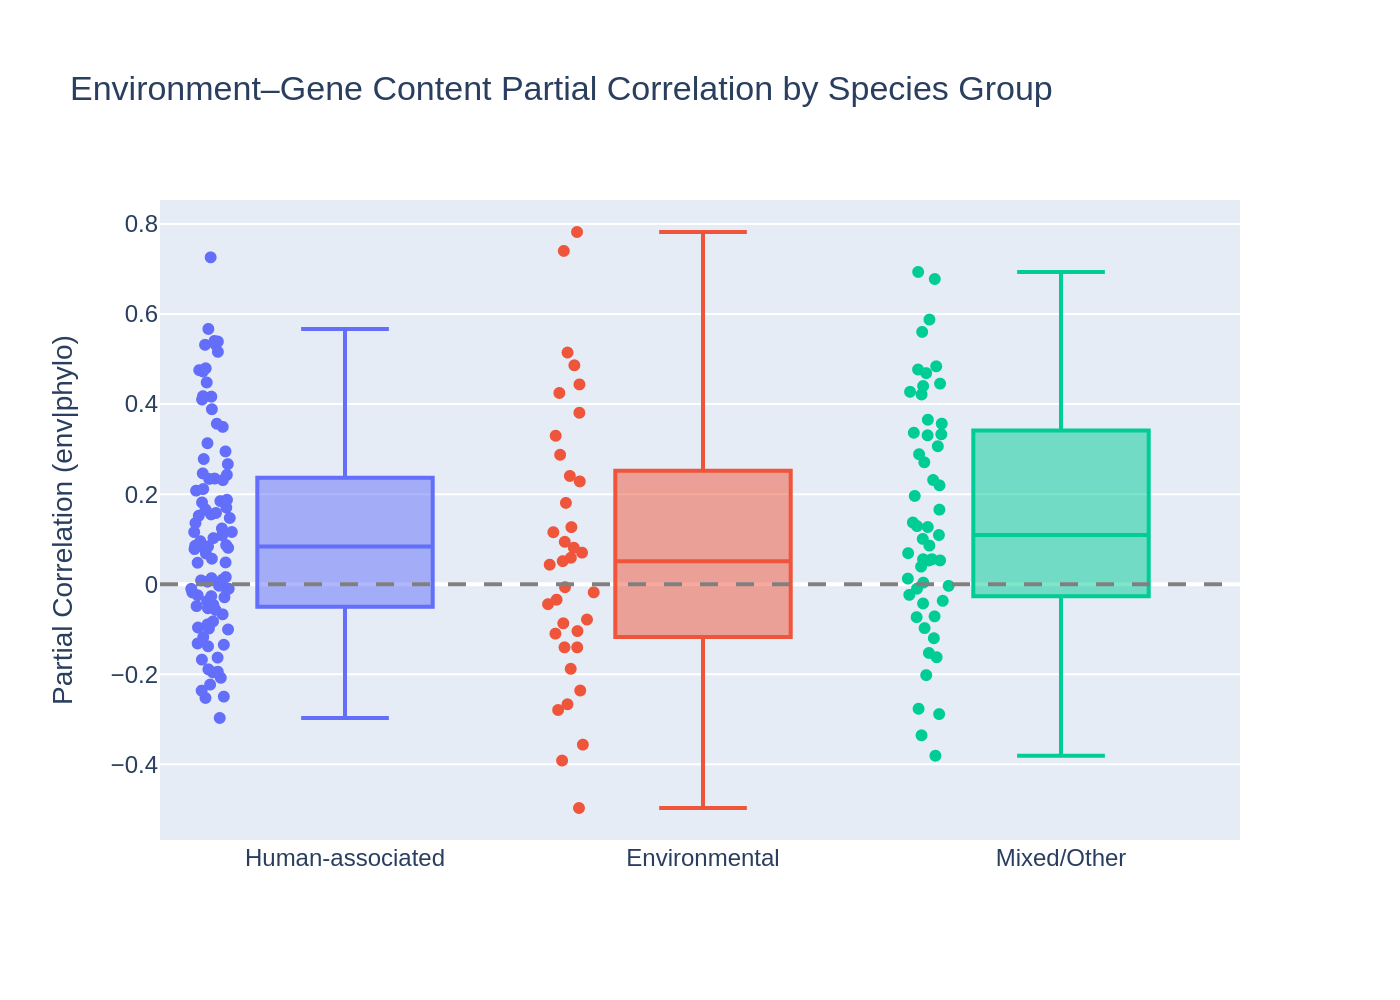 Partial correlations by species group. From ecotype_env_reanalysis.
Side 2: Environmental samples carry stronger spatial structure
The explorer independently confirms the clinical skew 2. It also shows that environmental samples have stronger geographic embedding structure 2. Spatial signal and gene-content signal therefore remain discordant rather than reconciled 2.
Possible Reconciliations
- Hypothesis A: decoupled layers. Embedding structure may track landscape and geography, while accessory gene content (genes present in only some genomes of a species) responds to other factors: phylogeny (shared ancestry), niche breadth (the range of habitats a species occupies) or gene flow (gene exchange between populations). Under this hypothesis, both findings hold at once.
- Hypothesis B: sample-level vs. species-level signal. Geographic structure measured across samples may not carry over to correlations computed within species, so group comparisons could dilute a spatial signal present among individual samples.
- Hypothesis C: power and composition. Unequal sample counts, differential missingness (metadata absent more often in some groups) or downsampling (subsampling a group to a smaller size) may limit detection of a gene-content effect even where spatial structure is clearer.
Resolving Work
- Data: environmental-only genomes with AlphaEarth embeddings. Method: within-species Mantel-style tests (permutation tests of correlation between two distance matrices) relating embedding distance to gene-content distance while controlling for geographic distance. Question: does gene content track embedding structure where that structure is strongest?
- Data: the clinically skewed subset and the same subset downsampled to balance environmental and human-associated groups. Method: repeat the group comparison over many balanced resamples. Question: does the null result persist once group composition is equalized?
- Data: species with genomes in both groups. Method: compare partial correlations (correlations after removing a covariate’s effect) within each species, conditioning on phylogenetic distance (evolutionary divergence between genomes). Question: does the discordance survive once lineage is controlled?
- Data: gene-content profiles split into core (shared by nearly all genomes of a species) and accessory fractions. Method: test each fraction separately against embedding distance. Question: is the environmental signal confined to a fraction that whole-profile correlations mask?