Raw report: lignin_community_enrichment Feeds into: classifier-database-compatibility-in-taxonomic-quantification, condition-specific-fitness, ecological-memory, genomic-under-representation, multi-omics-integration, null-results-under-limited-statistical-resolution, occurrence-versus-catabolic-activity, sampling-depth-and-downsampling-effects, study-batch-confounding-of-environmental-associations, taxonomic-resolution-dependent-functional-inference
Overview
This study used user-provided 16S V3–V4 and ITS2 amplicon data to test how lignin enrichment, labile-carbon co-supplementation and sequential passaging restructure bacterial and fungal communities. All 21 samples (7 groups × 3 replicates) were sequenced for both markers. The report’s data-quality section counts 84 paired-end FASTQ libraries, but its Sources table lists 42 paired-end libraries (21 samples x 2 markers). The report does not resolve this counting discrepancy, so neither total should be treated as unqualified. Read quality was excellent, with Q30 > 0.94 for all libraries. The analysis clustered reads into 97% OTUs (operational taxonomic units, groups of sequences at least 97% identical). It then compared communities with Bray–Curtis distances, PCoA (principal coordinates analysis, an ordination of the distance matrix) and PERMANOVA, a permutation-based test of community-composition differences. 1
Key Findings
Lignin is a strong bacterial selective filter
The base bacterial community was dominated by unclassified taxa (Incertae Sedis, 44.3%), and Pseudomonas was below 0.1%. After a single lignin-enrichment round, Pseudomonas (39.3%) and Acinetobacter (25.2%) became the dominant genera, together comprising >64% of 16S reads. The report describes this shift as consistent across replicates and as a near-complete community turnover from the unenriched state. Shannon diversity fell from 6.46 (Base) to 3.16 (L), and observed OTUs fell from 1,594 to 163, a 90% reduction. The reported PERMANOVA result that treatment explains 97.9% of community variance (R²=0.979, p=0.001) is the global test across all 7 groups (model M3), not a Base-versus-L test. 1
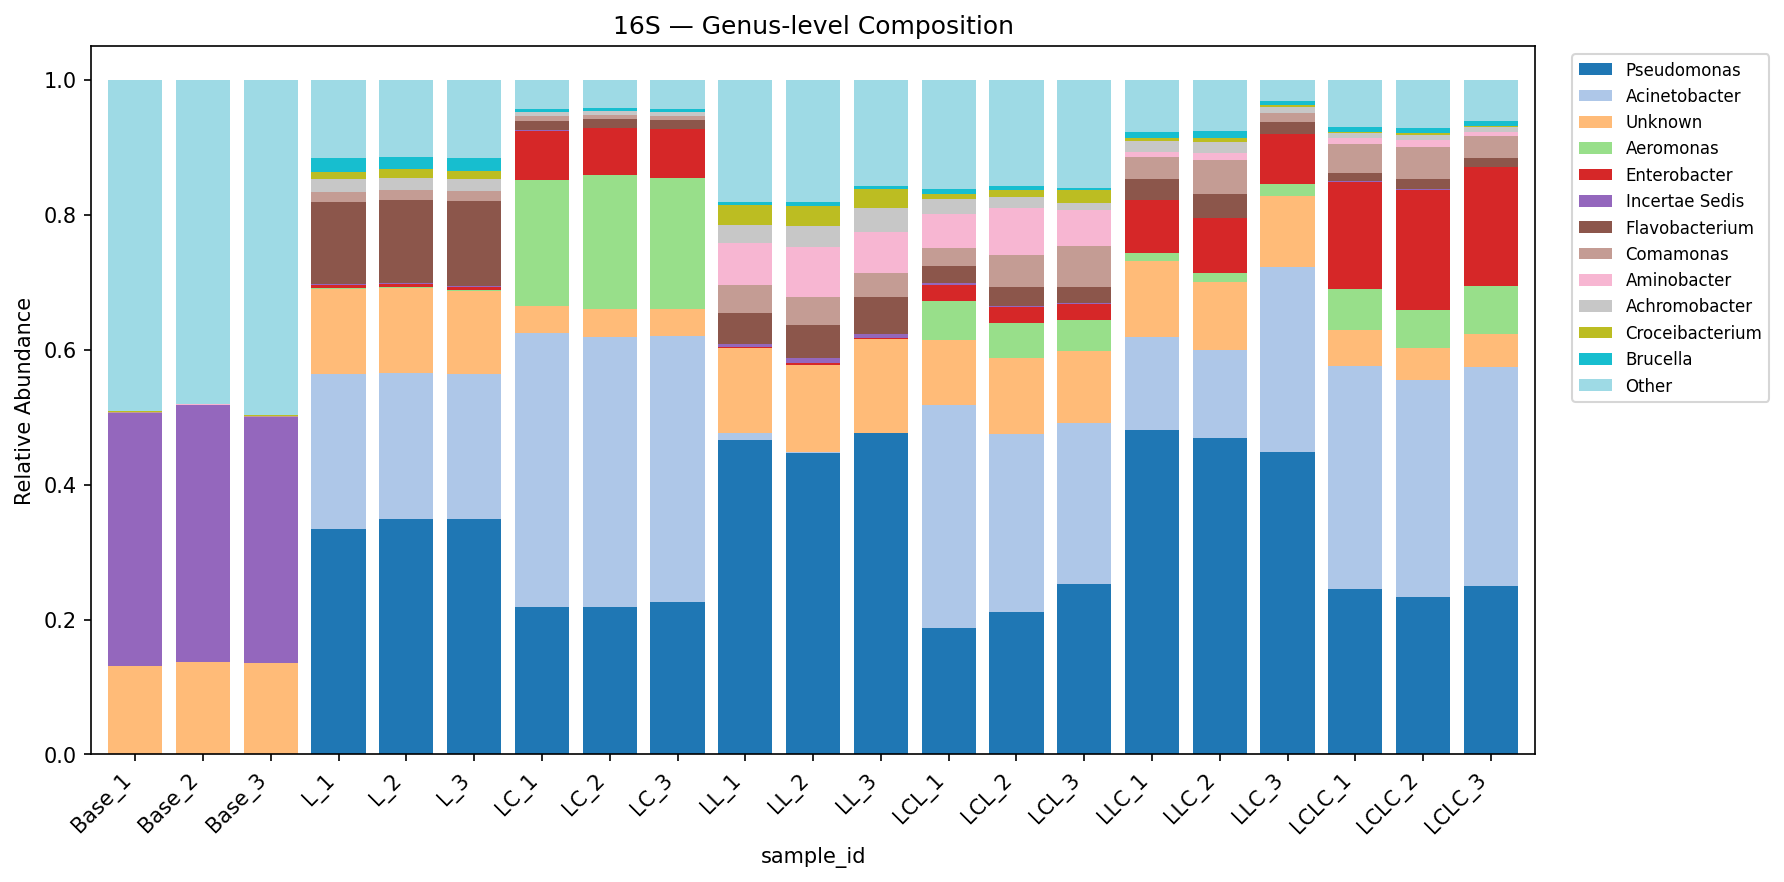 16S genus bar plot. From lignin_community_enrichment.
The report interprets this turnover as strong support for its first hypothesis, that lignin acts as a selective filter. The Base-versus-Round-1 PERMANOVA (M1) explained near-total variance (R²=0.992, p=0.008). The report reads the 90% collapse in observed OTUs (1,594 → 163) as consistent with strong selective pressure favoring a small number of taxa capable of metabolizing lignin-derived aromatics. That catabolic capacity is inferred from taxonomy rather than measured. 1
PCoA ordination showed clear separation of all treatment groups. PC1 and PC2 together explained 81.1% of variance for 16S and 34.0% for ITS. 1
Labile carbon produces a distinct copiotrophic assemblage
Adding labile carbon alongside lignin (group LC) shifted the bacterial community away from the lignin-only profile. Acinetobacter rose from 25.2% in L to 41.7% in LC, and Pseudomonas fell from 39.3% to 23.0%. Aeromonas emerged as a major component, rising from 0.1% to 20.2%. Shannon diversity declined from 3.16 to 2.41 and Pielou’s evenness from 0.62 to 0.49, producing a less even community. 1
The report interprets the consistent L-versus-LC difference as support for its second hypothesis. In this reading, labile carbon relaxes the stringent selection for specialist lignin degraders by providing an alternative energy source. That would allow fast-growing copiotrophic taxa such as Aeromonas and Enterobacter to co-dominate alongside lignin-associated organisms. The copiotrophic explanation is an interpretation, not a measured mechanism. The report calls the fungal contrast even more striking. Lignin alone selects for Fusarium and Fusicolla, which the report describes as soft-rot fungi. Lignin plus labile carbon instead selects for Chrysosporium and Aspergillus, genera the report associates more with opportunistic saprotrophic growth. The report notes that the appearance of Aspergillus, Fusarium and Chrysosporium as dominant ITS taxa is consistent with the known saprotrophic capabilities of these genera (Bouws et al. 2008, PMID: 18636256). That observation is subject to the ITS reproducibility and taxonomy caveats described below. The report also cites labile-carbon priming of lignin degradation as a well-established soil-ecology concept (Waldrop & Firestone 2004, PMID: 14614618). From its data it suggests the hypothesis that priming may operate at the level of community composition rather than simply through metabolic activation. 1
Round-1 carbon history persists into Round 2
Round-2 communities segregated according to their Round-1 history. The lignin-history groups L-L and L-LC were Pseudomonas-dominated (52–53%), with low Acinetobacter (<1–20%). The lignin-plus-labile-history groups LC-L and LC-LC were Acinetobacter-dominant (31–34%), with lower Pseudomonas (24–26%) and elevated Enterobacter (2.7–18.1%). 1
In the 12-sample Round-2 factorial PERMANOVA (M2), Round-1 history explained 58.9% of community variance (F=14.31, R²=0.589, p=0.002). The current Round-2 carbon source explained only 32.7% (F=4.85, R²=0.327, p=0.018). History/Round-2 distance ratios were 1.15 when Round 2 was lignin and 1.59 when Round 2 was lignin plus labile carbon. Values above 1 indicate that enrichment history had a stronger effect on composition than the current carbon source. The report calls this persistent segregation the most striking result and treats it as quantitative evidence for ecological memory. It summarizes the result as enrichment history mattering more than the current environment. This result applies to bacterial 16S communities. It does not establish ecological memory in fungal ITS communities, whose Round-1 history term was not statistically detectable (p=0.090). 1
Communities with different Round-1 histories did not converge under identical Round-2 conditions. In the 16S convergence test, mean Bray–Curtis distance was 0.507 for L-L versus LC-L (different history, same Round-2 lignin). It was 0.486 for L-LC versus LC-LC (different history, same Round-2 lignin plus labile carbon). By comparison, it was 0.441 for L-L versus L-LC and 0.306 for LC-L versus LC-LC (same history, different Round-2 condition). The reported memory index was ~0.50. Communities with different Round-1 histories therefore kept approximately half of the maximum possible divergence even under the same Round-2 conditions. The report presents this as a quantitative metric of ecological-memory strength. The estimate comes from bacterial 16S data and does not describe fungal ITS communities. 1
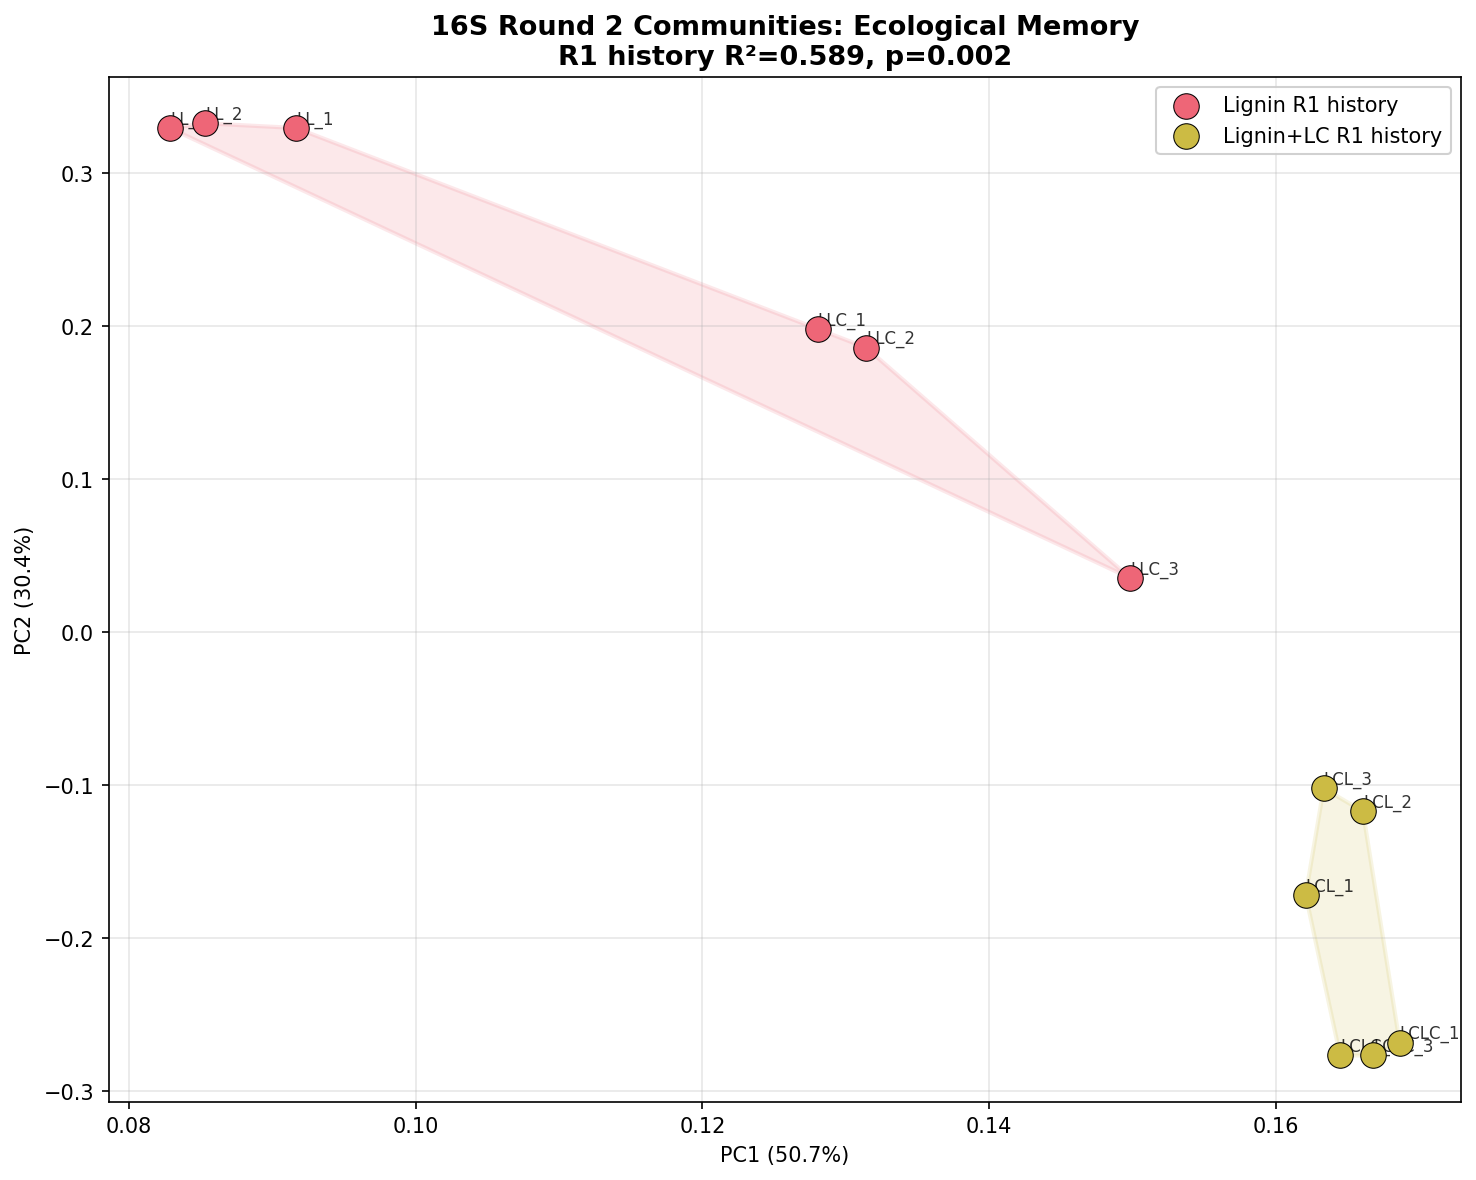 16S ecological memory PCoA. From lignin_community_enrichment.
Across passages, 81% of Round-1 16S OTUs were retained from L to L-L and 91% from LC to LC-LC. Core taxa were maintained throughout the full passage series. 1
The report links the ~0.50 memory index and the non-convergence to ecological theory on priority effects and historical contingency. It proposes that once labile carbon establishes a copiotrophic-enriched community in Round 1, that community resists convergence with lignin-only histories. This is a hypothesis consistent with the data rather than a directly measured mechanism. In its conclusions the report frames this as priming at the community level. On this reading, labile-carbon supplementation does not simply enhance lignin degradation but restructures the community toward copiotrophic taxa that persist through subsequent passages. This framing is the report’s interpretation; lignin degradation itself was not measured. 1
Fungal responses are strong but poorly reproducible
The base fungal community was Fusarium-dominated (26.5%) with diverse secondary taxa (253 OTUs, Shannon diversity 3.50). Under lignin-only enrichment, Fusarium persisted at 43.4% and Fusicolla emerged at 30.3%. Lignin plus labile carbon produced complete replacement, with Chrysosporium dominating at 61.4% alongside Aspergillus at 27.2%. In Round 2, Malassezia became dominant in L-L (63.4%) and LC-L (50.0%). Pleurotus, which the report describes as a known lignin-degrading white-rot fungus, emerged at 50.0% in LC-LC. The report calls the Pleurotus emergence biologically notable because it appears only when labile carbon was available in both rounds. It explicitly flags, however, that this rests on ITS data with poor replicate consistency. 1
The ITS composition table reports mean relative abundances in the order Chrysosporium, Malassezia, Fusicolla, Fusarium, Preussia, Aspergillus, Pleurotus. Base: 10.9%, <0.1%, <0.1%, 26.5%, 0.4%, 3.0%, <0.1%. L: <0.1%, 4.0%, 30.3%, 43.4%, 12.9%, 2.2%, <0.1%. LC: 61.4%, 6.1%, <0.1%, <0.1%, <0.1%, 27.2%, <0.1%. L-L: <0.1%, 63.4%, <0.1%, <0.1%, <0.1%, <0.1%, <0.1%. LC-L: <0.1%, 50.0%, <0.1%, <0.1%, <0.1%, 50.0%, <0.1%. L-LC: <0.1%, <0.1%, 33.3%, <0.1%, 33.3%, <0.1%, <0.1%. LC-LC: <0.1%, 50.0%, <0.1%, <0.1%, <0.1%, <0.1%, 50.0%. 1
ITS richness collapsed from 253 OTUs in Base to 3–8 OTUs per group after enrichment. Fungal replicate consistency was far worse than bacterial consistency. Within-group Bray–Curtis distance was 0.09 for 16S, against 0.65 for ITS, reaching 0.99–1.00 for Round-2 groups. The report states that this limits statistical inference for ITS. The ITS global PERMANOVA was significant (F=3.02, R²=0.582, p=0.001), but its R² was lower than for 16S (0.582 vs 0.979). However, for ITS the Round-2 factorial model detected neither a Round-1 history effect (F=1.49, R²=0.142, p=0.090) nor a current labile-carbon effect (F=1.71, R²=0.160, p=0.090). The report therefore states that the ecological-memory signal is not statistically detectable in ITS. A preregistered per-group Procrustes M² analysis would have formally tested 16S–ITS concordance. It was not completed. Rotating near-random ITS points onto the structured 16S ordination would produce a high M² (poor fit) regardless of biological concordance. Instead, the report describes bacteria as showing robust, reproducible treatment effects and fungi as showing extreme stochasticity at the same sample size. It describes the fungal communities as dominated by stochastic variation at this sample size and sequencing depth. Among the possible contributors to poor ITS replicate consistency, it lists low sequencing depth in some ITS samples alongside other limitations, without establishing depth as the cause. The report suggests that the contrast reflects different mechanisms of community assembly, but the data do not demonstrate such a mechanism. 1
Lignin-associated bacterial genera respond conditionally
Pseudomonas went from absent in the base community (<0.1%) to dominant in all enriched conditions (23–53%). The report associates the genus with the beta-ketoadipate pathway and protocatechuate catabolism. Flavobacterium rose from 0.1% in the base community to 14.1% in L but declined to 1.4% in LC. Its CLR effect (centered log-ratio difference, a compositional effect size) was +11.2 in the Base-versus-L comparison. The report cites Flavobacterium strains with ring-hydroxylating dioxygenases isolated from polycyclic aromatic hydrocarbon-contaminated environments (Lyu et al. 2014, PMID: 24957593). It takes the LC decline to suggest a lignin-aromatic specialist rather than a generalist copiotroph; this interpretation is tentative. Comamonas rose from 0.1% in the base community to 3.6–5.1% in Round-2 groups. The report also states a 17–51x enrichment, which does not match these quoted abundances. The report does not reconcile the two, so the fold range should be treated as an unreconciled report statement. The report notes that the genus degrades aromatic compounds, including phenylpropanoids. It compares this later-passage Comamonas enrichment with Kanokratana et al. (2018, PMID: 29169786), who identified Comamonas as a major genus in lignocellulose-degrading consortia enriched on Napier grass. The report also relates the dominance of Pseudomonas and Acinetobacter to Hossain et al. (2024). That study found these genera harboring the highest diversity of aromatic-degrading enzymes across 26 soil bacterial genomes. Both comparisons are external literature context, not measurements made on these communities. 1
Aminobacter was absent in the base and Round-1 groups and appeared in L-L (7.6%) and LC-L (6.4%). The report notes the genus’s aromatic-amine metabolism but does not establish whether it was absent from the other Round-2 groups. Rhodococcus stayed at low levels across conditions (0.03–0.67%) and was highest in L at 0.67%; the report describes it as a well-characterized lignin degrader. Sphingomonas was more abundant in the base community (1.74%) than in enriched conditions. The report takes this to suggest, without demonstrating it, that lignin enrichment does not select for the genus despite its known aromatic catabolism. 1
The Base-versus-Lignin differential-abundance table lists the top enriched genera with CLR effects of +12.3 for Acinetobacter, +11.5 for Pseudomonas and +11.2 for Flavobacterium. That table gives lignin relative abundances of 17.0%, 7.5% and 9.0% respectively, with base values of <0.1% for all three. These differ from the group-level composition table, which reports 25.2%, 39.3% and 14.1% in L and 0.1% for base Flavobacterium. The report does not reconcile the two tables, so the values should not be treated as interchangeable. 1
In the L-versus-LC comparison, Aeromonas (+6.4, described as copiotrophic and fast-growing) and Shewanella (+6.6, a facultative anaerobe) were marked as enriched in LC. Peredibacter (-7.3, a bacterial predator) and Comamonas (-6.8, an aromatic compound degrader) were marked as enriched in L. 1
The group-level 16S table reports mean relative abundances in the order Pseudomonas, Acinetobacter, Aeromonas, Enterobacter, Flavobacterium, Comamonas. Base: <0.1%, <0.1%, <0.1%, <0.1%, 0.1%, 0.1%. L: 39.3%, 25.2%, 0.1%, 0.5%, 14.1%, 1.7%. LC: 23.0%, 41.7%, 20.2%, 7.5%, 1.4%, 0.7%. L-L: 53.3%, 0.5%, <0.1%, 0.2%, 5.8%, 4.6%. LC-L: 24.3%, 31.0%, 5.8%, 2.7%, 2.9%, 5.1%. L-LC: 52.2%, 20.2%, 1.5%, 8.7%, 3.1%, 3.6%. LC-LC: 25.6%, 34.3%, 6.5%, 18.1%, 1.4%, 4.3%. 1
Statistical power limits pairwise inference
With n=3 per group, pairwise Mann–Whitney U tests have a minimum achievable p-value of 0.10, because only 10 permutations are possible for a 3-versus-3 comparison. Pairwise PERMANOVA has a similar permutation floor of p~0.10. FDR-corrected (false discovery rate) significance was therefore impossible for individual OTUs, and none reached it; differential abundance is reported as CLR effect sizes instead. Global Kruskal–Wallis tests across all 7 groups pool more samples and were significant for all alpha-diversity metrics (16S p=0.006–0.010; ITS p=0.015–0.041). The Round-2 factorial PERMANOVA with n=12 was the most powered test and detected both Round-1 history (p=0.002) and Round-2 carbon source (p=0.018). Effect sizes such as CLR differences and R² values remain interpretable even where p-values are constrained. 1
Data and Processing
Reads were processed with vsearch using 97% OTU clustering and de novo chimera removal. 16S taxonomy was assigned with SILVA 138.2 NR99, which contains 510,495 SSU rRNA reference sequences, using vsearch sintax at 80% confidence. ITS taxonomy was assigned against NCBI ITS_RefSeq_Fungi, which contains 19,375 curated fungal ITS sequences, using BLASTn. 1
The 16S workflow retained 91.2% of reads after primer trimming (cutadapt), 99.8% after quality filtering (fastp) and 99.8% after paired-end merging (vsearch), for ~91% total retention. The ITS workflow retained 98.5%, 99.8% and 99.3% at the same steps, for ~98% total retention. The final data contained 3,392 16S OTUs and 893 ITS OTUs; prevalence and abundance filtering retained 1,793 and 440 respectively. The filtered 16S table covered 21 samples by 1,793 OTUs (prevalence >= 2, abundance >= 10). It was rarefied to 24,000 reads per sample and still covered 21 samples by 1,793 OTUs. The filtered ITS table covered 20 samples by 440 OTUs after LL_1 (74 reads) was excluded. It was rarefied to 5,900 reads per sample, again covering 20 samples by 440 OTUs. Per-sample reads ranged from 24,287–88,781 for 16S and 6,953–200,902 for ITS, with genus-level assignment rates of 86.5% and 81.2%. 1
The 16S alpha-diversity values (observed OTUs, Shannon, Pielou) were: Base, 1,594 ± 12, 6.46 ± 0.02 and 0.88 ± 0.00; L, 163 ± 3, 3.16 ± 0.01 and 0.62 ± 0.00; LC, 133 ± 4, 2.41 ± 0.00 and 0.49 ± 0.00; L-L, 162 ± 3, 3.19 ± 0.10 and 0.63 ± 0.02; LC-L, 178 ± 2, 3.05 ± 0.06 and 0.59 ± 0.01; L-LC, 155 ± 12, 2.85 ± 0.31 and 0.57 ± 0.05; LC-LC, 153 ± 4, 2.47 ± 0.05 and 0.49 ± 0.01. The ITS values (observed OTUs, Shannon) were: Base, 253 ± 20 and 3.50 ± 0.33; L, 8 ± 1 and 1.37 ± 0.49; LC, 6 ± 1 and 0.62 ± 0.17; L-L, 6 ± 3 and 0.37 ± 0.50; LC-L, 3 ± 1 and 0.17 ± 0.14; L-LC, 4 ± 3 and 0.05 ± 0.09; LC-LC, 7 ± 2 and 0.49 ± 0.32. 1
The 3-tier Bray–Curtis PERMANOVA used 999 permutations. All 7 groups (M3): 16S F=111.35, R²=0.979, p=0.001; ITS F=3.02, R²=0.582, p=0.001. Base versus Round 1 (M1): 16S F=394.42, R²=0.992, p=0.008; ITS F=6.92, R²=0.698, p=0.003. Round-2 factorial (M2), group term: 16S F=41.12, R²=0.939, p=0.001; ITS F=1.72, R²=0.424, p=0.011. M2 Round-1 history term: 16S F=14.31, R²=0.589, p=0.002; ITS F=1.49, R²=0.142, p=0.090. M2 Round-2 labile-carbon term: 16S F=4.85, R²=0.327, p=0.018; ITS F=1.71, R²=0.160, p=0.090. PERMDISP tests whether groups differ in multivariate spread. It was significant for 16S (p=0.0004) and ITS (p=0.0001), indicating heterogeneous dispersions between groups. The report concludes that the group separation is real but that dispersion differences contribute to the PERMANOVA signal. 1
The report’s figures and the descriptions it gives them:
- figures/read_counts_per_sample.png — raw read counts per sample, colored by group.
- figures/quality_scores_summary.png — Q20 and Q30 rates per sample.
- figures/gc_content_distribution.png — GC content distribution for 16S and ITS.
- figures/read_length_distribution.png — read length distribution for 16S and ITS.
- figures/16S_phylum_barplot.png — 16S phylum-level composition by group.
- figures/16S_genus_barplot.png — 16S genus-level composition by group.
- figures/ITS_phylum_barplot.png — ITS phylum-level composition by group.
- figures/ITS_genus_barplot.png — ITS genus-level composition by group.
- figures/16S_rarefaction.png — 16S rarefaction curves, reported to saturate at 24k reads.
- figures/ITS_rarefaction.png — ITS rarefaction curves.
- figures/16S_dendrogram.png — 16S replicate-consistency dendrogram.
- figures/ITS_dendrogram.png — ITS replicate-consistency dendrogram.
- figures/16S_alpha_diversity.png — 16S alpha-diversity boxplots (4 metrics).
- figures/ITS_alpha_diversity.png — ITS alpha-diversity boxplots (4 metrics).
- figures/pielou_evenness.png — Pielou’s evenness comparison (16S + ITS).
- figures/16S_pcoa.png — 16S Bray–Curtis PCoA ordination.
- figures/ITS_pcoa.png — ITS Bray–Curtis PCoA ordination.
- figures/pcoa_panel.png — combined PCoA panel, with 16S and ITS side by side.
- figures/16S_ecological_memory_pcoa.png — PCoA colored by Round-1 history, with convex hulls.
- figures/16S_community_trajectories.png — community trajectory arrows across passages.
- figures/16S_targeted_heatmap.png — heatmap of key lignin-associated genera.
- figures/ITS_targeted_heatmap.png — heatmap of key fungal genera.
- figures/16S_volcano_base_vs_L.png — volcano plot for the Base-versus-Lignin comparison.
- figures/ecological_memory_distances.png — comparison of history-associated and Round-2 condition-associated distances. 1
Caveats and Limitations
The report identifies the n=3 permutation floor as its primary statistical limitation, particularly for pairwise tests. It proposes n>=5 per group for future experiments so that pairwise significance testing becomes possible. Environment constraints led the analysis to use 97% vsearch OTUs rather than DADA2 ASVs (amplicon sequence variants, exact error-corrected sequences), which may merge closely related species. The standard UNITE ITS database could not be downloaded. ITS taxonomy was therefore assigned by BLAST against NCBI ITS_RefSeq_Fungi, with 19,375 reference sequences. Some assignments may be imprecise, and the database may underrepresent environmental taxa and miss rare or novel taxa. The report considers genus-level assignments more reliable than finer ones. 1
The ITS findings are preliminary for several reasons. Replicate consistency was poor, with within-group Bray–Curtis distances approaching 1.0 for Round-2 groups. Sequencing depth varied from 6,953–200,902 reads per sample before rarefaction, and some samples had very low diversity. ITS was rarefied to 5,900 reads, versus 24,000 for 16S. The report lists low depth in some samples as contributing to replicate variability even after rarefaction. Enriched ITS groups had only 3–8 OTUs, making composition highly sensitive to stochastic variation. Sample LL_1 was excluded after retaining 74 reads, reducing L-L to n=2. The fungal memory effect was therefore not statistically detectable, and the notable Pleurotus emergence in LC-LC requires confirmation. 1
PERMDISP was significant for both markers, so the PERMANOVA results reflect differences in group dispersion as well as group location. No technical metadata on extraction or library-preparation batches were available, so batch effects could not be formally assessed. The functional interpretation of lignin degradation rests on taxonomic associations and literature context; gene-level pathway enrichment was not directly measured. 1
The planned Procrustes comparison of bacterial and fungal ordinations was not completed, because the near-random ITS replicate structure would make the fit difficult to interpret. The report proposes several lines of future work: larger replication, DADA2 ASV analysis, UNITE-based ITS taxonomy, and phylogenetic diversity and UniFrac analyses. It also proposes cross-referencing Pseudomonas, Acinetobacter and Comamonas in the KBase Data Lakehouse through kbase_ke_pangenome, functional inference with PICRUSt2 or Tax4Fun to test whether the beta-ketoadipate and protocatechuate lignin-catabolism pathways are enriched (a question this report leaves untested), resequencing ITS libraries at higher depth to improve Round-2 replicate consistency, and intermediate time points to resolve restructuring kinetics. 1
Slots Into
- ecological-memory — the Round-1 history effect (R²=0.589 versus R²=0.327 for the current carbon source), history/Round-2 ratios of 1.15 and 1.59, a memory index of ~0.50 and persistent non-convergence make a quantitative ecological-memory case; the null ITS history test (p=0.090) and the priority-effect hypothesis mark its limits. 1
- condition-specific-fitness — condition-specific enrichment of Pseudomonas, Acinetobacter, Aeromonas, Flavobacterium and Comamonas links carbon regime to community composition and ecological selection. 1
- occurrence-versus-catabolic-activity — lignin-degrading roles for Pseudomonas, Flavobacterium, Comamonas, Aminobacter and Rhodococcus are inferred from taxonomic enrichment and literature, without measurement of gene-level pathways. 1
- null-results-under-limited-statistical-resolution — with n=3 per group, the Mann–Whitney floor of p=0.10 makes OTU-level FDR significance unattainable, so effect sizes carry the inference. 1
- sampling-depth-and-downsampling-effects — ITS depth ranging from 6,953–200,902 reads, LL_1 retaining only 74 reads, and within-group distances of 0.99–1.00 limit fungal inference. 1
- multi-omics-integration — paired bacterial 16S and fungal ITS profiling provides a cross-marker comparison, while showing that poor fungal replicate structure limits concordance analysis. 1
- pangenome-integration — the proposed mapping of lignin-enriched genera to gene annotations in kbase_ke_pangenome creates a direct future bridge from enrichment profiles to pathway content. 1
- classifier-database-compatibility-in-taxonomic-quantification — UNITE was unavailable, so ITS taxonomy relied on BLAST against 19,375 NCBI ITS_RefSeq_Fungi references; the report considers genus-level assignments more reliable than finer assignments. 1
- genomic-under-representation — the NCBI ITS_RefSeq_Fungi reference may underrepresent environmental fungal taxa. 1
- taxonomic-resolution-dependent-functional-inference — 97% OTU clustering instead of DADA2 ASVs may merge closely related species, which limits genus-to-function inference. 1
- study-batch-confounding-of-environmental-associations — missing extraction and library-preparation batch metadata prevented formal batch-effect assessment. 1