Raw report: amr_strain_variation Feeds into: antimicrobial-resistance-fitness-cost, callability-limited-comparative-inference, chromosomal-and-integrative-gene-transfer, cofitness-network-architecture, comparative-conservation-metric-calibration, confirmatory-exploratory-ecological-association-discordance, cultivation-collection-bias-in-ecological-genomics, ecotype-clustering-validity, ecotype-environment-gene-content, environmental-resistome, homology-search-negative-evidence, null-results-under-limited-statistical-resolution, pangenome-core-boundary-and-clade-size-bias, pangenome-openness-determinants, phylogenetic-confounding-of-pangenome-associations, resistance-island-coinheritance, sample-size-aware-phenotype-consensus, sampling-depth-and-downsampling-effects, scale-dependent-mobile-element-associations
Overview
This report analyzes antimicrobial-resistance (AMR) gene variation across 1,305 species and 180,025 genomes using the KBase Data Lakehouse pangenome resource. It finds that within-species AMR repertoires are extensive. They are structured by prevalence class, tightly co-inherited resistance islands, phylogeny, lineage-associated ecotypes and environment. 1
Key Findings
AMR genes are usually variable or rare within species
Across 1,305 species and 180,025 genomes, the analysis covered 37,444 AMR gene-species records. Of these, 51.3% were rare, present in <=5% of strains. Another 41.3% were variable, present in 5-95%, and 7.5% were fixed, present in >=95%. The median variability index was 0.526, meaning over half of a species’ AMR genes fall in the variable zone. The median pairwise Jaccard distance (a distance based on shared versus differing gene repertoires) was 0.435, indicating that strains within the same species shared less than 60% of their AMR repertoire. 1
Atlas conservation class strongly predicted within-species prevalence: 77.3% of Core AMR genes were fixed, while 78.7% of Singletons were rare. Auxiliary genes were 57.3% variable and 42.7% rare. The report takes this as validation of the atlas classification at strain resolution. AMR variability weakly anti-correlated with pangenome openness (Spearman rho = -0.193, p = 2.2e-12). The report’s proposed explanation is that open-pangenome species likely accumulate more rare or singleton AMR genes below the 5% threshold, which deflates the variability index. 1
The full atlas-class breakdown, given as fixed (>=95%), variable (5-95%) and rare (<=5%), was as follows. Core genes were 77.3% fixed, 22.7% variable and 0.0% rare. Auxiliary genes were 0.0% fixed, 57.3% variable and 42.7% rare. Singleton genes were 0.0% fixed, 21.3% variable and 78.7% rare. 1
The median AMR variability index by phylum ranged from 0.487 in Bacillota to 0.600 in Bacillota_A. The values for the six listed phylum groups were: 1
- Bacillota: 0.487 (248 species)
- Bacillota_C: 0.500 (21 species)
- Bacteroidota: 0.509 (100 species)
- Pseudomonadota: 0.533 (591 species)
- Actinomycetota: 0.533 (133 species)
- Bacillota_A: 0.600 (184 species)
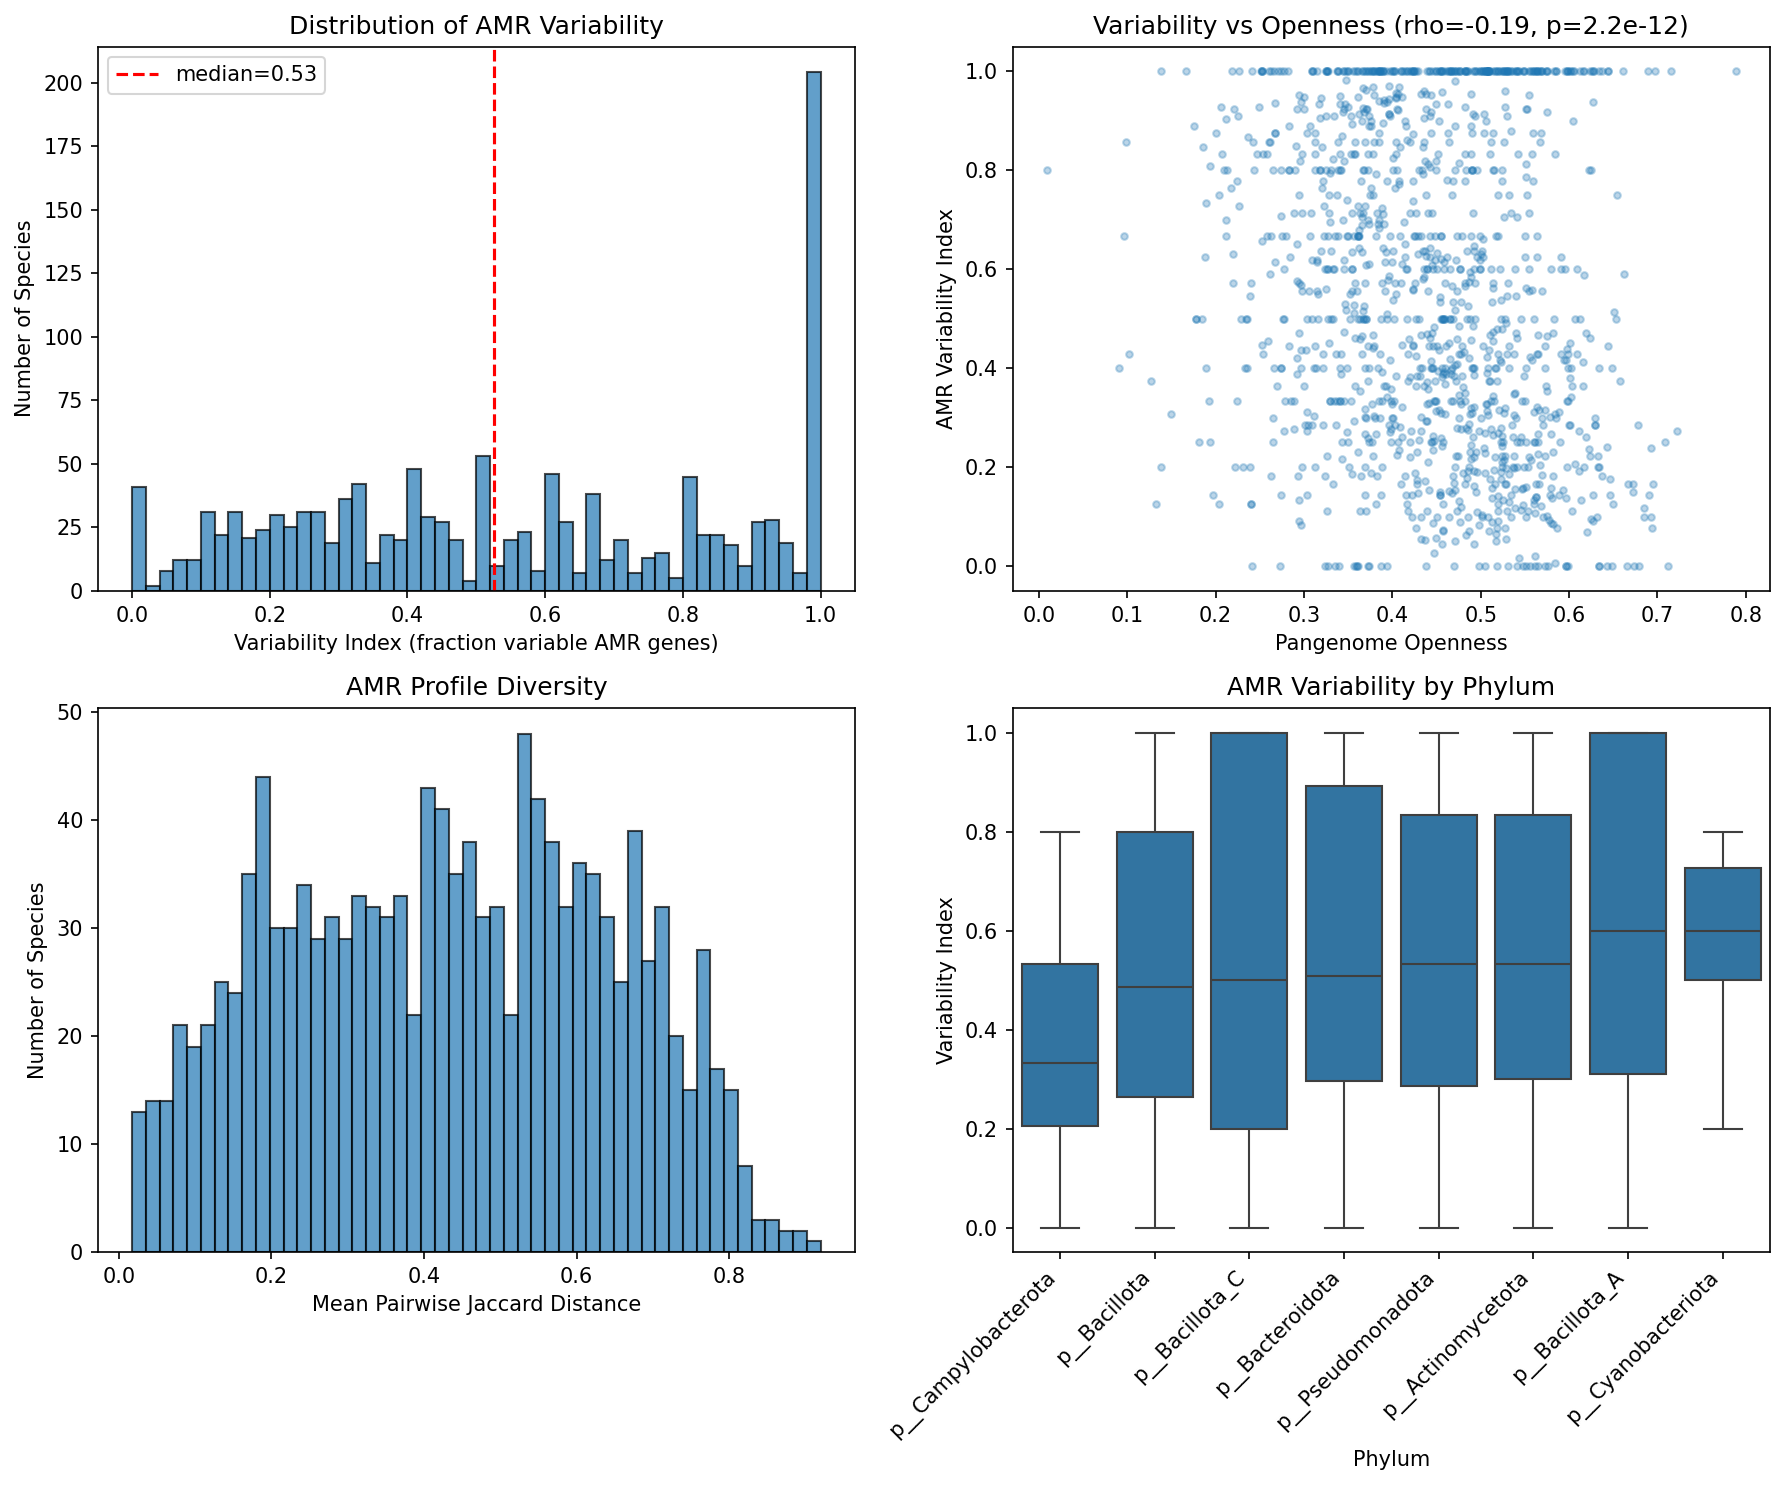 Variation landscape showing prevalence classes, variability vs openness, Jaccard diversity by phylum, and prevalence by mechanism. From amr_strain_variation.
Resistance islands are widespread and tightly co-inherited
The analysis detected 1,517 resistance islands across 705 species, or 54% of the species analyzed. Islands had a mean size of 6.2 genes, a median of 4 genes and a maximum of 43 genes. The mean phi coefficient, a measure of pairwise co-occurrence, was 0.827, which indicates very tight co-inheritance. Of the islands, 1,343/1,517 (88%) contained genes from multiple resistance mechanisms. Efflux pumps (954 islands) and enzymatic inactivation (698) were the most common components. 1
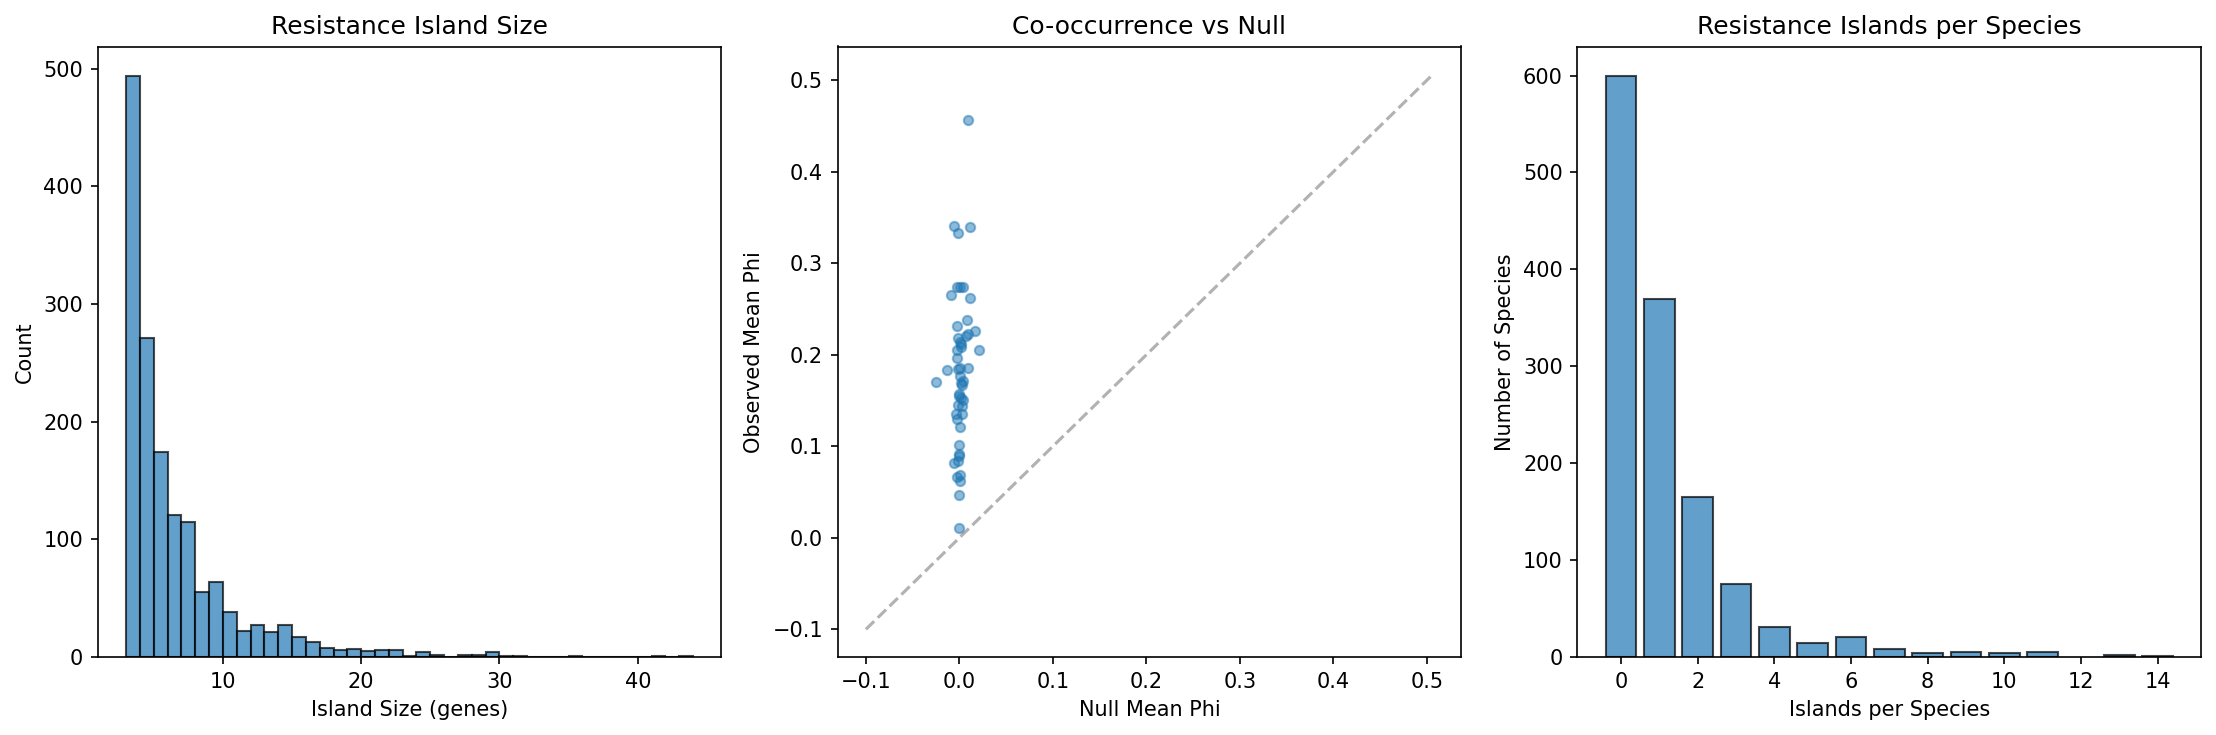 Co-occurrence analysis showing island size distribution, observed vs null phi, and islands per species. From amr_strain_variation.
The complete counts of islands containing each mechanism were: 1
- Other/Unclassified: 1,026
- Efflux: 954
- Enzymatic inactivation: 698
- Oxidoreductase: 694
- Regulatory: 502
- Beta-lactamase: 341
- Target modification: 293
- Cell wall modification: 137
The report suggests that this multi-mechanism composition gives coordinated defense against multiple drug classes. That is an interpretation, not a directly demonstrated functional effect, and co-occurrence does not establish co-selection or functional synergy. 1
AMR variation commonly tracks phylogeny
Mantel tests compared ANI (average nucleotide identity) distance matrices with AMR Jaccard distance matrices across 1,261 species. A Mantel test assesses the correlation between two distance matrices. Of the 1,261 species, 701 (55.6%) showed significant phylogenetic signal at FDR < 0.05, where FDR is the false-discovery rate. The median Mantel r for all AMR genes was 0.247, and 87.8% of species showed a positive correlation, indicating that closely related strains tend to share more AMR genes. 1
Non-core, putatively acquired AMR genes showed stronger phylogenetic signal than core, intrinsic genes. Median Mantel r was 0.222 for non-core genes versus 0.117 for core genes (paired t-test t = -8.35, p = 7.0e-16, n = 489). The authors interpret this as suggesting that “acquired” AMR genes are more often inherited clonally within lineages than randomly acquired via horizontal gene transfer. They propose a model in which resistance genes, once acquired (likely via mobile genetic elements), become stably integrated and vertically inherited, creating clonal AMR lineages. That model is a hypothesis; the Mantel associations do not directly establish it. The report also notes a statistical limitation. Core genes are nearly universal (>=95% prevalence by definition), so their Jaccard distances are near zero with little variance. This inherently suppresses distance-based Mantel r independently of biology and partially explains the lower core signal. 1
In its Literature Context, the report attributes to Maier et al. (2025) and others the finding that AMR gene transfer is largely confined within closely related lineages. It specifically attributes to Maier et al. (2025) the finding that genetic compatibility negatively influences cross-species AMR transfer. These are secondary-literature findings, distinct from this project’s own measurements, which the report cites as consistent with its clonal-maintenance interpretation. 1
Distinct AMR ecotypes occur in a subset of species
Of 974 species with at least 15 genomes suitable for clustering, 190 (19.5%) formed >=2 distinct AMR ecotypes. Ecotypes were identified with UMAP, a nonlinear dimensionality-reduction method, followed by DBSCAN density-based clustering of AMR Jaccard distances. The median silhouette score was 0.620. Environment-ecotype association testing was limited because 52.7% of genomes had no classifiable isolation_source. Only 2 species had sufficient within-species environmental diversity for chi-squared testing after strict expected-frequency criteria were applied. 1
Case-study UMAP plots for Klebsiella pneumoniae, Staphylococcus aureus and Salmonella enterica showed visible environmental structuring. The statistical test is underpowered with current metadata, so these plots do not establish a general environment-ecotype association. Equally, the report states that the weak test does not mean ecotypes are unrelated to environment. Escherichia coli was excluded from case studies because it exceeded the 500-genome computational cap. 1
Temporal trends were not detected after correction
The temporal analysis covered 513 species with >=20 genomes spanning >=3 years after 1990. None showed a significant temporal trend in AMR gene count after Benjamini-Hochberg FDR correction. Slopes were roughly symmetrically distributed around zero, with 251 positive and 262 negative. The report says this null result likely reflects sparse and noisy collection-date metadata in NCBI BioSample records rather than a true absence of temporal trends. It points to well-documented AMR expansions in S. aureus and K. pneumoniae. The metadata explanation is the report’s interpretation, not an established cause, and the null is not evidence that temporal trends are absent. 1
Host-associated species carry more AMR genes
Two approaches were used: rule-based keyword classification approximating BacDive categories, and NCBI keyword-based environment annotation. Both found that host-associated species carried more AMR genes per genome than terrestrial or aquatic species (Kruskal-Wallis, p < 0.05). The NCBI keyword classifier assigned environments to 1,190/1,307 species (91%), while the BacDive approximation classified 459/1,307 species (35%). Both methods agreed in direction, with human-clinical isolates having the highest AMR burden. 1
Scale and Generated Data
The study analyzed 1,305 species, 180,025 genomes, 37,444 AMR gene-species records and 1,517 resistance islands. It ran Mantel tests on 1,261 species, ecotype analysis on 974 species and temporal analysis on 513 species. Generated resources included: 1
- 1,305 genome-by-AMR presence/absence matrices
- 1,305 per-species variation summaries
- 37,444 per-gene prevalence records
- 1,517 resistance-island records
- 1,305 phi summaries
- 1,259 ANI matrices
- 1,261 Mantel results
- 176,177 ecotype assignments
- 974 ecotype summaries
- 2 environment-ecotype tests
- 513 temporal regression results
- 1,307 BacDive/NCBI environment bridge records
- an integrated summary with one row per species across 1,305 species
The analysis drew on the kbase_ke_pangenome collection (tables gene, gene_genecluster_junction, genome, genome_ani and ncbi_env) for genome-level AMR presence/absence, ANI distances and environmental metadata. The eligibility table data/eligible_species.csv lists 1,307 species passing the selection criteria (>=10 genomes, >=5 AMR, >=1 non-core), which differs from the 1,305-species analysis count. The inventory also lists 1,259 ANI matrix files against 1,261 species with Mantel tests. The report does not explain either discrepancy. 1
Figures
figures/nb02_variation_landscape.png: prevalence classes, variability versus openness, diversity by phylum, and prevalence by mechanism. 1figures/nb03_cooccurrence.png: resistance-island size distribution, observed versus null phi, and islands per species. 1figures/nb04_phylogenetic_signal.png: Mantel r distribution, core versus non-core signal, and signal versus diversity. 1
Caveats
- Collection bias. The GTDB/NCBI genome collection is heavily biased toward clinical and human-associated isolates, particularly for Klebsiella pneumoniae, Staphylococcus aureus and Escherichia coli. Environmental species are underrepresented. 1
- Metadata sparsity. This limits interpretation of the temporal and ecological results. Only 70% of genomes had parseable collection dates, and 52.7% had no classifiable isolation_source. 1
- AMR detection method. Detection relies on the AMRFinderPlus database, so novel resistance mechanisms absent from that database are missed. 1
- Mantel size cap. ANI extraction for Mantel tests was limited to species with <=500 genomes. This excluded mega-species such as Escherichia coli (15,388 genomes) and Klebsiella pneumoniae (14,240 genomes) from the phylogenetic-signal analysis. 1
- Environment classification. The BacDive and NCBI keyword classifiers are approximate, and dedicated metadata curation would improve ecotype analyses. 1
- Causality. Resistance-gene co-occurrence in islands does not prove co-selection. The genes may simply be linked on the same mobile genetic element without functional synergy. 1
- Core versus non-core signal. The stronger phylogenetic signal of non-core than core AMR genes may be partly statistical. Core genes are nearly universal by definition, which produces little Jaccard-distance variance and suppresses Mantel r. 1
Future Directions
The report proposes the following work; none of it is a reported result. 1
- Detailed UMAP and heatmap case studies with clinical metadata overlay for six species: Klebsiella pneumoniae, Escherichia coli, Staphylococcus aureus, Pseudomonas aeruginosa, Salmonella enterica and Acinetobacter baumannii.
- Subsampling strategies to run ANI-based Mantel tests on species with >500 genomes.
- Higher-quality collection dates, obtained through NCBI metadata curation, to strengthen further temporal trend analysis.
- Mapping detected resistance islands to their mobile-genetic-element context: plasmid versus chromosome, integron boundaries and IS (insertion sequence) elements.
- Predictive modeling of which AMR genes are likely to be co-acquired in the future, using resistance-island co-occurrence structure in a PanKA-style approach.
- Cross-project linking of AMR ecotypes to virulence-factor profiles and metabolic-pathway variation.
Cited References
The report’s reference list includes a genomic antimicrobial-resistance study of Klebsiella pneumoniae, the GTDB reference “GTDB: an ongoing census of bacterial and archaeal diversity”, and the KBase reference “KBase: The United States Department of Energy Systems Biology Knowledgebase”. 1
Slots Into
- environmental-resistome: adds large-scale evidence that host association, environmental metadata, resistance islands and lineage structure organize AMR repertoires within species, with human-clinical isolates carrying the highest burden. 1
- pangenome-integration: quantifies how atlas conservation classes and pangenome openness relate to within-species AMR prevalence and variation. 1
- cofitness-network-architecture: provides resistance-island co-occurrence evidence and identifies tightly co-inherited multi-mechanism AMR modules. 1
- resistance-island-coinheritance: island counts, phi-based co-inheritance, mechanism composition, the co-selection caveat, and proposed genomic-context and PanKA-style follow-up. 1
- antimicrobial-resistance-fitness-cost: most AMR genes are rare or variable rather than fixed within species. 1
- phylogenetic-confounding-of-pangenome-associations: widespread ANI-AMR Mantel signal, and the core versus non-core contrast with its variance artifact. 1
- chromosomal-and-integrative-gene-transfer: the hypothesis that acquired AMR genes are maintained clonally after acquisition, alongside secondary-literature support. 1
- comparative-conservation-metric-calibration: atlas classes validated at strain resolution, and near-universal core genes suppressing distance-based correlation. 1
- pangenome-core-boundary-and-clade-size-bias: the full Core/Auxiliary/Singleton prevalence breakdown. 1
- pangenome-openness-determinants: the weak negative association between AMR variability and openness. 1
- ecotype-clustering-validity: UMAP plus DBSCAN AMR ecotypes and their silhouette quality. 1
- ecotype-environment-gene-content: visible environmental structuring of ecotypes in case-study plots, where formal environment-ecotype testing was limited to 2 eligible species and underpowered, plus proposed virulence and metabolic linkage. 1
- confirmatory-exploratory-ecological-association-discordance: visual case-study structuring versus an underpowered formal test. 1
- callability-limited-comparative-inference and cultivation-collection-bias-in-ecological-genomics: isolation_source sparsity, classifier coverage, approximate classifiers and clinical collection bias. 1
- null-results-under-limited-statistical-resolution: the corrected temporal null, its symmetric slopes, the likely role of sparse dates and the proposed date curation. 1
- sampling-depth-and-downsampling-effects: genome caps excluding mega-species, and proposed subsampling for Mantel tests. 1
- homology-search-negative-evidence: AMRFinderPlus database dependence missing novel mechanisms. 1
- scale-dependent-mobile-element-associations: unresolved plasmid versus chromosomal context of resistance islands. 1