Raw report: ecotype_env_reanalysis Feeds into: callability-limited-comparative-inference, classifier-database-compatibility-in-taxonomic-quantification, confirmatory-exploratory-ecological-association-discordance, cross-tenant-data-bridging, cultivation-collection-bias-in-ecological-genomics, ecotype-clustering-validity, ecotype-environment-gene-content, environment-embedding-geography, genome-wide-versus-locus-specific-ecological-adaptation, pangenome-integration, phylogenetic-confounding-of-pangenome-associations, sampling-depth-and-downsampling-effects, selection-on-outcome-leakage, study-batch-confounding-of-environmental-associations
Overview
This reanalysis tests whether the clinical sampling bias in the AlphaEarth subset explains the weak relationship between environmental context and gene-content variation. Using genome-level environment classifications and the same within-analysis methodology for comparison groups, it finds no evidence that environmental species have stronger environment–gene content correlations than human-associated species. The result confirms the original ecotype-analysis null conclusion while showing that clinical bias is real but does not account for the weak signal. 1
Key Findings
Environmental versus human-associated correlations
Environmental species (n=37) had a median partial correlation of 0.051, mean 0.073, standard deviation 0.299, and range [-0.50, 0.78]. Human-associated species (n=93) had a median of 0.084, mean 0.110, standard deviation 0.226, and range [-0.30, 0.73]. Mixed/Other species (n=53) had a median of 0.109, mean 0.148, standard deviation 0.261, and range [-0.38, 0.69]. Thus, environmental species did not show stronger correlations; human-associated species showed slightly higher correlations, opposite to the stated hypothesis. 1
Environmental species (n=37, median partial correlation 0.051) did not show stronger environment–gene content correlations than human-associated species (n=93, median 0.084): the one-sided Mann-Whitney U test for Environmental > Human-associated gave U=1536 and p=0.83, so the null hypothesis was not rejected. 1
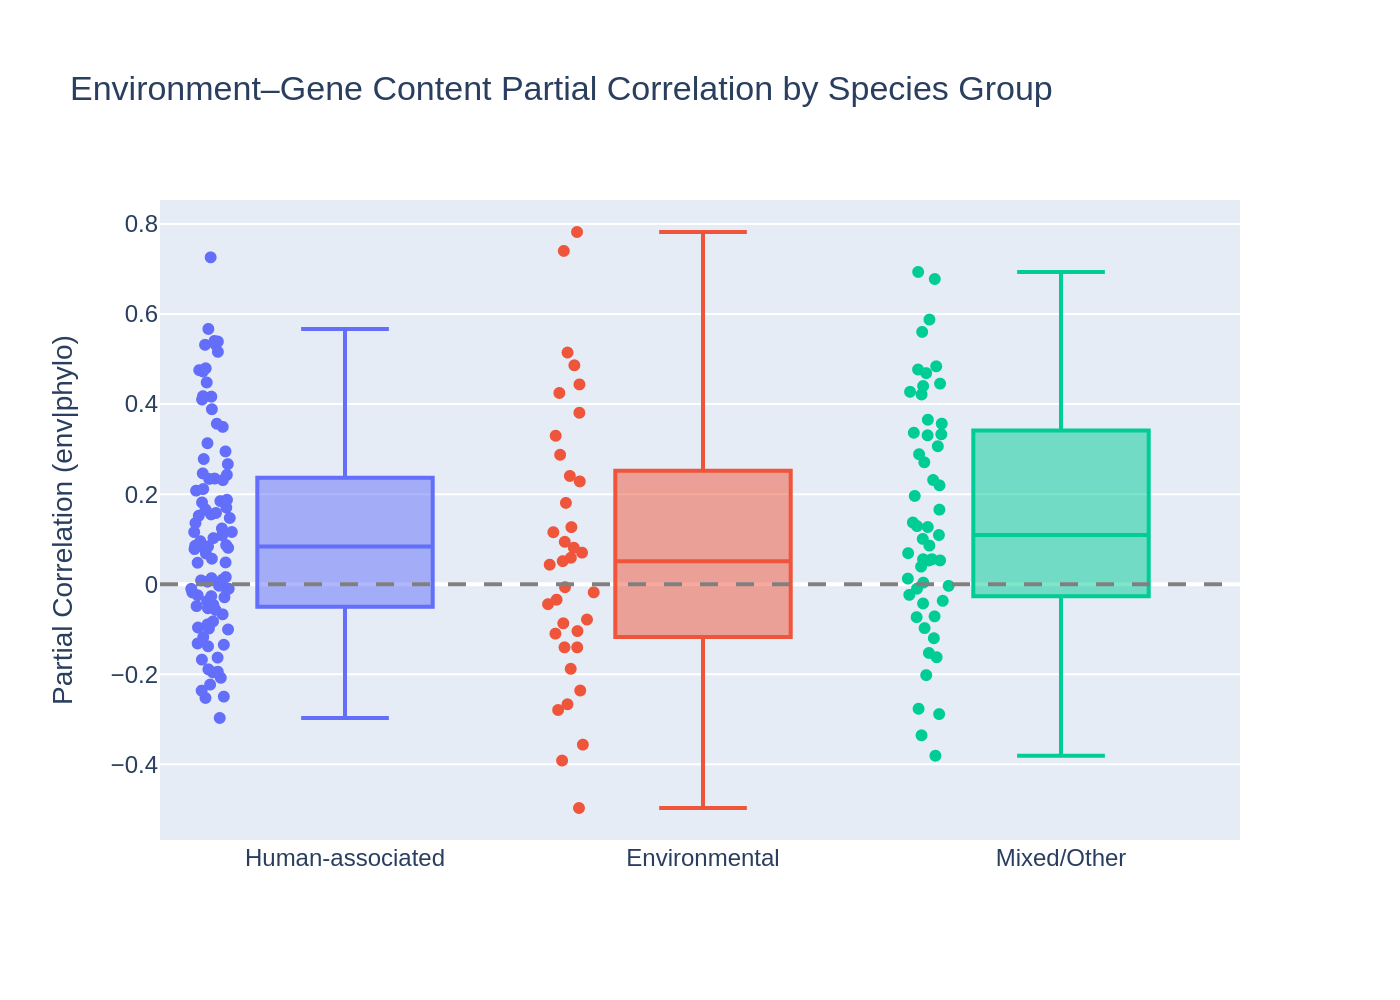 Partial correlations by species group. From ecotype_env_reanalysis.
The continuous Spearman analysis likewise found no relationship between the fraction of environmental genomes per species and partial-correlation strength: rho=-0.085 and p=0.25. The corresponding analysis for the fraction of human-associated genomes gave rho=0.030 and p=0.69. 1
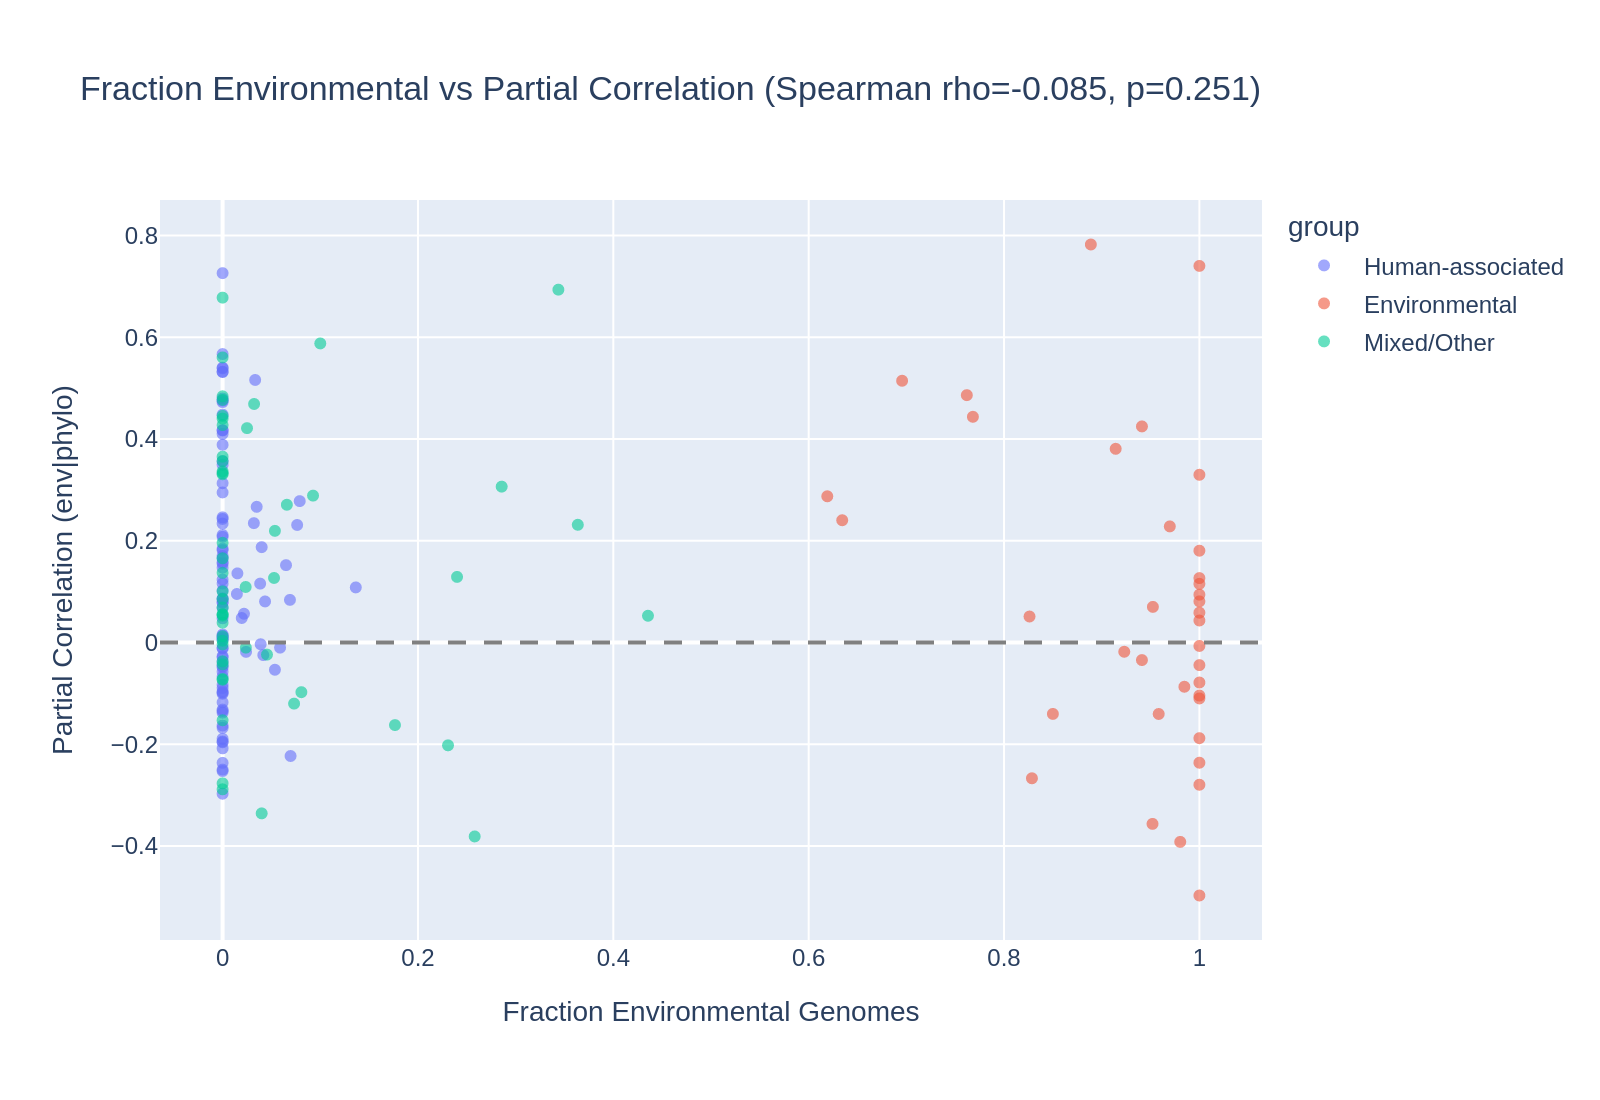 Continuous analysis: fraction environmental vs partial correlation. From ecotype_env_reanalysis.
Species composition and classification
Among 224 species selected for the ecotype analysis, requiring >=20 genomes with AlphaEarth embeddings and >=30% coverage, 106 species (47%) were majority human-associated, 47 (21%) were majority environmental, and 71 (32%) were Mixed/Other. The environmental categories included Soil, Marine, Freshwater, Extreme, and Plant. Classification used the harmonized env_category mapping produced by the env_embedding_explorer project and a majority vote over genome-level isolation_source assignments. 1
The authors interpret this composition as confirming the strong clinical sampling bias in the AlphaEarth subset that the env_embedding_explorer project identified, but their comparison indicates that the bias does not explain the weak environment–gene content relationship. 1
NaN correlations
Of the 30 species with NaN partial correlations, the NaN rate was 10/47 = 21% for Environmental species, 13/66 = 20% for Mixed/Other species, and 7/100 = 7% for Human-associated species. Environmental species were therefore disproportionately lost to NaN filtering rather than human-associated species. The authors acknowledge that this could bias the group comparison. They argue that the filtering would, if anything, favor a stronger environmental signal, so the observed result remains inconsistent with the hypothesis that environmental species have stronger correlations. This bias direction is an interpretation and was not directly tested or corrected. 1
Difference from the original analysis
The median partial correlation across all 183 species in this reanalysis was 0.081, compared with 0.003 in the original ecotype analysis; the report characterizes this as a 27x difference. The reanalysis used all genomes with embeddings, including up to 3,505 genomes per species, rather than diversity-maximizing downsampling with a maximum of 250 genomes. It also used different genome sets, which changed the distance distributions. The report also lists greater power as a possible contributor, because larger sample sizes can detect weaker correlations. 1
The authors describe the overall partial-correlation magnitude as 27x higher than in the original analysis. The absolute correlation values are not comparable across the two methodologies, but the Environmental versus Human-associated comparison was performed within one consistent methodology, preserving the validity of that group comparison. 1
Interpretation
The reanalysis predicted that environmental species would show stronger environment–gene content correlations because their AlphaEarth embeddings carry more geographic signal: a 3.4x ratio versus 2.0x for human-associated embeddings, reported by the parent env_embedding_explorer project. It found no such difference between the environmental and human-associated groups. The report proposes, without testing it here, that embedding similarity is not equivalent to ecological relevance. Environmental embeddings are more geographically differentiated, but the environmental variation they capture (climate, vegetation, land use) may not strongly predict bacterial gene content. 1
The report also proposes that human-associated species can have genuine geographic structure because global epidemiological patterns may cause different lineages of species such as Klebsiella or Enterococcus to dominate different regions. In that interpretation, AlphaEarth embeddings could capture regional epidemiological patterns rather than ecological differences. This is an explanation offered by the report, not a directly established mechanism. 1
Species with more genomes, often clinical species, may have greater statistical power to detect weak correlations. The Mixed/Other group had the highest median partial correlation, 0.109, possibly because it includes diverse sampling campaigns; this is likewise presented as a possible explanation rather than a demonstrated cause. 1
The original ecotype_analysis project (Dehal et al., 2026) reported that phylogeny dominated the environment-versus-host-associated comparison, with p=0.66, using a coarse manual classification. This reanalysis used genome-level harmonized classifications and obtained p=0.83, confirming the null result with a more systematic classification scheme. 1
Data sources, outputs and figures
The kbase-ke-pangenome collection (kbase_ke_pangenome) supplied genome metadata, AlphaEarth embeddings, ANI (average nucleotide identity) distances, and gene-cluster memberships. These came from the genome, alphaearth_embeddings_all_years, genome_ani, gene, and gene_genecluster_junction tables. 1
The generated file data/species_env_classification.csv has 224 rows of species classified by majority env_category. By contrast, data/ecotype_corr_with_env_group.csv, which merges partial correlations with environment-group labels, has 213 rows; the report’s output table does not explain this difference. The reanalysis also draws on the parent ecotype_analysis file data/target_genomes_expanded.csv, which lists 25,205 target genomes with species. 1
Figures referenced by the report: 1
figures/partial_corr_by_group.png— partial correlations by species group.figures/partial_corr_distributions.png— distributions of partial correlations.figures/frac_env_vs_partial_corr.png— continuous analysis of environmental-genome fraction versus partial correlation.figures/species_classification.png— species classification by dominant environment.
Caveats and Future Analyses
- No downsampling: The reanalysis produced partial correlations 27x higher overall than the original analysis. The report states that absolute values are not comparable, although the within-method group comparison is valid. 1
- NaN exclusion: Environmental species had a higher NaN rate, 21%, than human-associated species, 7%, so the environmental group was more filtered. The report states that this would bias toward finding a stronger environmental signal, which was not observed. 1
- K. pneumoniae exclusion: Klebsiella pneumoniae was excluded because it exceeded Spark’s maxResultSize during gene-cluster extraction and consequently had no correlation data. 1
- Majority-vote classification: A species with 51% gut genomes would be classified as Human-associated. The continuous Spearman analysis was used to address this limitation and also found no relationship. 1
- Unresolved methodological discrepancy: A specific comparison of downsampled versus full-genome extraction is needed to explain the 27x partial-correlation discrepancy. 1
- Functional specificity: Testing gene subsets, including transport and secondary-metabolism categories, could determine whether environmental effects are masked by whole-genome Jaccard distances. 1
- Environment ontology: Repeating the analysis with structured ENVO terms from env_broad_scale could test whether more precise environmental classification changes the result. 1
- Genome-count control: Adding genome count as a covariate could test whether unequal sampling depth inflates correlations in species with more genomes. 1
Slots Into
- pangenome-integration — supplies a genome-level environment classification and gene-content correlation reanalysis, showing that clinical sampling composition does not explain the weak environment–gene content signal. 1
- cross-tenant-data-bridging — demonstrates integration of genome metadata, AlphaEarth embeddings, ANI distances, and gene-cluster memberships from the KBase pangenome collection with parent-project correlation results. 1
- ecotype-environment-gene-content — proposed cross-project concept for the null relationship between environment classification and bacterial gene-content variation, including the methodological discrepancy with the original analysis. 1
- confirmatory-exploratory-ecological-association-discordance — a one-sided group test of a stated directional hypothesis and a continuous Spearman test both returned nulls, and the observed group difference ran opposite to the hypothesis. 1
- cultivation-collection-bias-in-ecological-genomics — most species in the AlphaEarth subset are majority human-associated, and this composition was shown not to explain the weak environment signal. 1
- callability-limited-comparative-inference — more environmental than human-associated species were lost to NaN correlations, and the direction of the resulting bias was not tested. 1
- sampling-depth-and-downsampling-effects — the 27x partial-correlation discrepancy between full-genome and downsampled extraction, and uncontrolled genome-count effects. 1
- ontology-and-category-schema-sensitivity — harmonized majority-vote env_category classification versus coarse manual classification, and proposed ENVO env_broad_scale reclassification. 1
- environment-embedding-geography — the higher geographic signal of environmental embeddings did not translate into a stronger gene-content association; Klebsiella and Enterococcus may carry epidemiological geographic structure. 1
- phylogenetic-confounding-of-pangenome-associations — the untested alternative that geographic associations in human-associated species reflect lineage structure rather than ecology. 1
- genome-wide-versus-locus-specific-ecological-adaptation — proposed test of transport and secondary-metabolism gene subsets that whole-genome Jaccard distances may mask. 1