Raw report: euk_in_prok_correlates Feeds into: callability-limited-comparative-inference, classifier-database-compatibility-in-taxonomic-quantification, cross-tenant-data-bridging, environment-embedding-geography, eukaryotic-dna-admixture-in-prokaryotic-metagenomes, multi-omics-integration, pooled-run-pseudoreplication-and-metadata-label-noise, sampling-depth-and-downsampling-effects, study-batch-confounding-of-environmental-associations
Overview
This project quantified eukaryotic read fractions across 2,759 NMDC ReadbasedAnalysis runs from 9 studies using native nmdc.results GOTTCHA2 classifications. It then tested whether sample environment, geography, and sequencing metadata explain variation in eukaryotic signal. The central contribution is a methodological warning: strong cross-study environment associations are largely confounded with study/batch, whereas environmental effects become predictive within a batch-controlled study. 1
Key Findings
Eukaryotic reads are common and mainly photosynthetic
Across the 2,759 runs from 9 studies, GOTTCHA2 detected eukaryotic reads in 77% of runs. Among all runs, the median eukaryotic fraction was 2.7%, the mean was 13.3%, and 20% of runs exceeded 20% eukaryotic reads. Among runs with detectable eukaryotic signal, plastid sequences represented a median 100% of that signal. Contamination in this environmental collection was therefore dominated by plant or algal chloroplast DNA rather than animal-host DNA. 1
The response variable was GOTTCHA2 relative eukaryotic abundance, defined as Eukaryota plus plastid abundance at superkingdom rank for each ReadbasedAnalysis run. It was strongly zero-inflated: 23% of runs had no detectable eukaryotic reads, with a long upper tail in which one in five runs exceeded 20% eukaryotic reads. Because of this distribution and the batch structure, all inference was either non-parametric or cross-validated. The non-parametric tests were Kruskal–Wallis and Mann–Whitney with BH-FDR correction, where FDR means false discovery rate. The cross-validated models were gradient boosting with GroupKFold by study, a cross-validation scheme that holds out complete studies as groups. 1
Kraken2 and Centrifuge produced approximately 0 domain-level Eukaryota signal because their NMDC reference databases were prokaryote-restricted; Kraken’s only eukaryotic kingdom was Metazoa/human. GOTTCHA2 was therefore the only usable estimator of eukaryotic fraction in this analysis. The near-absence of a metazoan or host signal was informative for this largely environmental collection. 1
Figure fig01_euk_distributions.png shows the eukaryotic-fraction distribution, the source split, and source prevalence. 1
Eukaryotic source tracks sample matrix
Eukaryotic composition varied coherently by matrix. Aquatic freshwater samples had 99.5% eukaryotic detection and a plastid share of 1.00, with algal plastids as the dominant source. Terrestrial soil samples had 55.7% detection and a plastid share of 0.43, indicating mixed plant plastid, soil fungal, and protist signal. Plant-root samples had 100% detection and a plastid share of 0.03, with root-associated fungi and protists as the dominant non-plastid source. 1
The eukaryotic fraction differed strongly by matrix in a Kruskal–Wallis test, with H=77.8 and p=1.3×10⁻¹⁷, and all pairwise matrix contrasts were significant after BH-FDR. After excluding the Unknown or missing-metadata bucket, ecosystem_type reduced to the same three biomes (Soil, Freshwater, and Roots). It therefore produced the same test as matrix rather than an independent confirmation. An earlier p≈10⁻⁵⁰ result retained Unknown, the bucket with the highest median eukaryotic fraction; it was a missingness artifact and was removed. 1
Figure fig02_euk_by_environment.png shows eukaryotic fraction by matrix as boxplots and detection by ecosystem_type. 1
The report interprets eukaryotic “contamination” of NMDC prokaryote-targeted metagenomes as largely co-sampled photosynthetic environmental DNA rather than laboratory or animal-host contamination. In this reading, the signal comes from algal chloroplasts in freshwater, plant chloroplasts and soil fungi in terrestrial samples, and root-associated fungi/protists in plant samples. This is an interpretation built on the matrix-level source split above. 1
Cross-study environment effects are batch-confounded
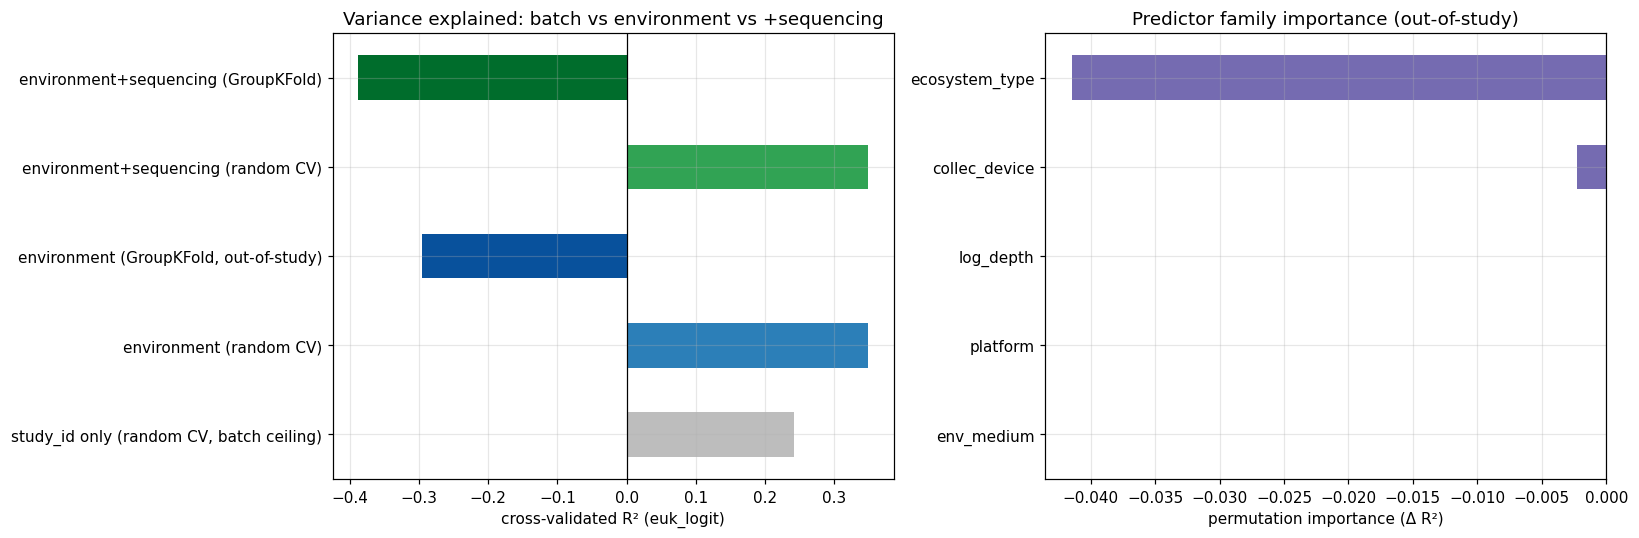
In NMDC, each biome was approximately 80–100% nested within a single study, so the strong univariate environment association could not be cleanly separated from study or batch. A gradient-boosted model of eukaryotic fraction (euk_logit response) gave the R² values listed below. 1
study_idalone under random cross-validation: R²=0.24.- Environment under random cross-validation: R²=0.35.
- Environment under GroupKFold out-of-study validation: R²=−0.30.
- Environment plus sequencing under GroupKFold: R²=−0.39. 1
The report’s prose states that environment explained no more variance than study_id alone. Its own random-CV table, however, gives environment R²=0.35 against study_id-only R²=0.24. The Discoveries text further equates the out-of-study R²=−0.30 with the study_id-only R², which contradicts the table’s study_id-only random-CV R²=0.24. The two models were scored under different CV schemes, so this internal inconsistency is unresolved and is recorded here rather than reconciled. The report is consistent that the out-of-study environment model performed worse than predicting the mean, with an out-of-study detection AUC of 0.56 (approximately chance). It is also consistent that adding sequencing metadata (platform, depth) did not improve prediction. The report therefore concludes that a naive cross-collection regression of eukaryotic fraction on environmental metadata would report a strong but largely batch-driven association. It adds that this likely also qualifies biome-level correlates reported at scale elsewhere. 1
Across the collection, sample depth was negatively associated with eukaryotic fraction (Spearman ρ=−0.29, p=5.2×10⁻⁷, n=292 runs with measured depth). Shallower samples carried more eukaryotic DNA, which is consistent with surface plant/algal input. The association was not batch-controlled: measured-depth runs came from a handful of non-soil studies, while the dominant NEON soil study recorded no depth. It is therefore subject to the same study/batch confounding as the environment effect and should be read as suggestive only. 1
Figure fig03_variance_partition.png compares R² for batch, environment, and sequencing predictors under random versus out-of-study cross-validation, and shows predictor importance. 1
 Variance partition and predictor importance. From euk_in_prok_correlates.
Within one study, vegetation and geography are predictive
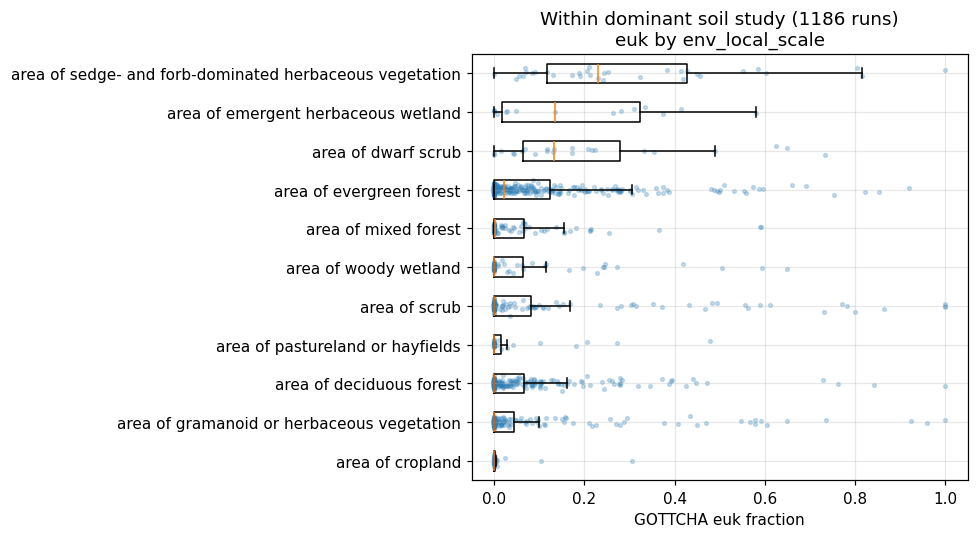
A batch-controlled analysis of the dominant NEON soil metagenome study included 1,186 runs from one sampling program with a constant protocol and batch. Within this study, local vegetation (env_local_scale, 11 levels) was associated with eukaryotic fraction at H=119.1 and p=7.6×10⁻²¹. Median eukaryotic fractions were 23% in sedge/forb herbaceous soil, 14% in emergent wetland, 13% in dwarf scrub, and 2% in evergreen forest. Deciduous forest, cropland, and pasture were approximately 0. 1
Geography also differed strongly across 47 sites, with H=310.4 and p=2.4×10⁻⁴⁶. The highest median fractions occurred at Arctic tundra sites (Utqiaġvik 30%, Caribou-Poker Creeks 22%, and Toolik 17%), compared with 2–8% in temperate forests. 1
A model using local environment and geography achieved within-study five-fold R²=+0.17 ± 0.06, in contrast to the cross-study out-of-study R²=−0.30. This supports a genuine fine-scale environmental signal when batch is held approximately constant. The signal remains subject to possible sub-batch confounding within the study. 1
Figure fig04_within_study_env.png shows within-study eukaryotic fraction by local vegetation for the NEON soil cohort. 1
 Eukaryotic fraction by within-study environment. From euk_in_prok_correlates.
Analysis design and data handling
The analysis used Kruskal–Wallis and Mann–Whitney tests with BH-FDR, plus cross-validated gradient boosting with GroupKFold by study. It analyzed data at the workflow_run_id level rather than the biosample level because 1,067 of 2,759 runs were pooled from multiple biosamples. Biosample-level joins would inflate the sample size through pseudo-replication. 1
The native nmdc.results tables are keyed by data_object_id or workflow_run_id. The bridge to biosamples and studies runs first through nmdc.metadata.biosample_to_workflow_run, joined on workflow_run_id. It then runs through biosample_set_associated_studies, whose child tables are keyed by parent_id. The report states that this path links 99%+ of classified runs. The read-based taxonomy tables are large; for example, kraken2_classification_report has approximately 29M rows. The report therefore advises aggregating each classifier to one row per workflow_run_id before joining to metadata and never scanning these tables unfiltered. 1
Literature context
The report places its results in the context of published work. These are literature claims reported by the source, not project measurements. Eisenhofer, Alberdi & Woodcroft (2026, mSystems, PMID 41854267) report biome-specific prokaryotic fraction across 136,284 metagenomes. Sobolev et al. (2025, IJMS, PMID 41373768) show that sample matrix, with extraction kit, drives eukaryotic admixture. The report describes the plastid/chloroplast dominance as matching Chevokina et al. (2025, Front Plant Sci, PMID 41560914) and the plant-host-depletion literature (Wang et al. 2026, Plant Biotechnol J, PMID 41078118). Anthony et al. (2024, Environ Microbiome, PMID 39095861) likewise attribute poor soil metagenome resolution to plant/eukaryotic DNA. 1
For the confounding and within-study results, the report cites three further sources, again as literature rather than project measurements. Salter et al. (2014, BMC Biology, PMID 25387460) are cited for biomass/batch as the master variable. Ortiz-Chura et al. (2024, Anim Microbiome, PMID 39456104) quantify the metadata- and structure-limitations of public collections (>40% missing basic fields). Holm et al. (2025, Environ Microbiome, PMID 40708004) link vegetation, land use and geography to soil microbial variation. 1
Caveats
The cross-study analysis included only approximately 9 studies, and one soil study accounted for approximately 43% of runs. No on-system source provided per-sample eukaryotic read fraction across many studies. MGnify on the system is a MAG (metagenome-assembled genome) catalog, SPIRE/GEM/Tara are MAG collections, and EMP is 16S. The cross-study generalization test was therefore under-powered. The within-study result was shown for one soil study only and may not extend to aquatic or host-associated collections. 1
NMDC did not populate DNA-extraction kit, size fractionation or filtration, host-depletion method, or library-preparation fields. Processing booleans in biosample_to_workflow_run were near-constant, and has_filtration was all false. The strongest literature-linked wet-lab factors, host depletion and extraction kit, therefore remain unmeasured residuals that NMDC omits. 1
Absolute eukaryotic fractions depend on the classifier and database. Only GOTTCHA2 yielded a usable eukaryotic fraction, so its values should be read as relative or ordinal rather than as calibrated absolute contamination. 1
Even within the NEON soil study, env_local_scale and geography may track sub-batches such as sampling campaigns. The within-study analysis is the best available control, not a randomized design. 1
Of the 2,759 runs, 1,067 were pooled from multiple biosamples. Each pooled run inherited environment and collection metadata from a single representative biosample selected by MIN(biosample_id). Where pooled biosamples differed in local metadata, this introduced label noise into the predictors. The report describes this as a conservative bias that can weaken associations but not manufacture them. 1
The NEON soil study had zero non-null depth values, so sampling depth was not measured there. The depth association is therefore a cross-study statistic and is not part of the batch-controlled within-study result. 1
The classifier databases were not interchangeable for eukaryote quantification. In this NMDC deployment, Kraken2 and Centrifuge were prokaryote-restricted, whereas GOTTCHA2 was plastid- and eukaryote-aware. Cross-collection analyses of contamination-QC correlates should therefore control for study or batch, using GroupKFold by study or within-study contrasts. 1
Future Directions
- Break the batch confound with more studies: import a many-study raw-read resource, such as the SPF corpus (described as 136K metagenomes / thousands of studies), or compute eukaryotic fraction across a broader collection. Either would allow a properly powered cross-study correlate analysis. 1
- Extend the within-study design to the aquatic and plant-associated studies here. This would test whether the vegetation/geography effect generalizes beyond soil, and whether the algal-plastid versus root-fungal source split holds within batch-controlled cohorts. 1
- Acquire wet-lab metadata (extraction kit, host-depletion method, size fraction), either as user-supplied per-study protocols or from a collection that records them. This would allow tests of the literature levers that NMDC omits. 1
- Calibrate GOTTCHA2 eukaryotic fraction against a spike-in or SPF estimate to move from ordinal to calibrated contamination estimates. 1
Slots Into
- eukaryotic-dna-admixture-in-prokaryotic-metagenomes — how common eukaryotic reads are, plastid dominance, and the matrix-specific sources of eukaryotic reads, with the co-sampled environmental DNA interpretation and supporting literature. 1
- study-batch-confounding-of-environmental-associations — biomes are nested within studies, the out-of-study R² is negative, and the report’s internal R² inconsistency is unresolved. The batch-controlled NEON soil contrast shows the opposite pattern. 1
- classifier-database-compatibility-in-taxonomic-quantification — the Kraken2 and Centrifuge databases are prokaryote-restricted, GOTTCHA2 is the only usable eukaryotic estimator, and its estimates are ordinal rather than calibrated. 1
- sampling-depth-and-downsampling-effects — the cross-study sample-depth association is not batch-controlled, depth is absent from NEON soil, and the
Unknown-bucket missingness artifact was removed. 1 - pooled-run-pseudoreplication-and-metadata-label-noise — the analysis is run-level because of pooled runs, and pooled runs inherit representative-biosample metadata. 1
- callability-limited-comparative-inference — wet-lab factors (extraction kit, filtration, host depletion, library prep) cannot be tested because NMDC omits them. 1
- environment-embedding-geography — the within-study vegetation and geography results show that environmental metadata can predict eukaryotic signal when batch is controlled. 1
- cross-tenant-data-bridging — the report documents the NMDC results-to-metadata bridging needed to connect workflow runs with biosamples and studies while avoiding pooled-run pseudo-replication. 1
- multi-omics-integration — the analysis integrates read-based taxonomic results with environmental, study, and sequencing metadata, and exposes classifier/database compatibility limits. 1