Two projects report median partial correlations between environmental similarity and bacterial gene-content similarity at different scales. Differing genome coverage, species inclusion, embedding coverage and sampling procedures prevent treating these values as directly comparable biological estimates. 1 2 A partial correlation is the association between two distance matrices after controlling for a third, here phylogenetic or environmental distance. The question matters because the size of the environmental signal frames claims in genome-wide-versus-locus-specific-ecological-adaptation, sampling-depth-and-downsampling-effects, study-batch-confounding-of-environmental-associations and confirmatory-exploratory-ecological-association-discordance. Averaging the values or preferring either one would hide a real disagreement about comparability.
Evidence Sides
Original ecotype analysis: weak environmental signal
The ecotype analysis reports a median environment partial correlation of 0.0025 and a median phylogeny partial correlation of 0.0143 across its 172-species analysis. 1 It reports no significant environmental effect in 90.7% of species. 1,2 That analysis had only 28.4% embedding coverage, meaning the share of genomes with the environmental embeddings used to define environmental similarity. 1,2 Its coverage and analysis population differ from the reanalysis, so it does not resolve the tension. 1
Ecotype reanalysis: larger overall magnitude, not comparable in absolute terms
The reanalysis reports a median partial correlation of 0.081 across 183 species, compared with 0.003 in the original analysis. 2 It attributes the discrepancy to different genome sets and downsampling procedures. Downsampling means subsampling genomes to equalise sampling depth. 2 The reanalysis states that the absolute values are not comparable because the analyses used different genome sets, sampling strategies and distance distributions. It explicitly preserves only the within-method comparison of environmental and human-associated groups, and that comparison remains stable. 2
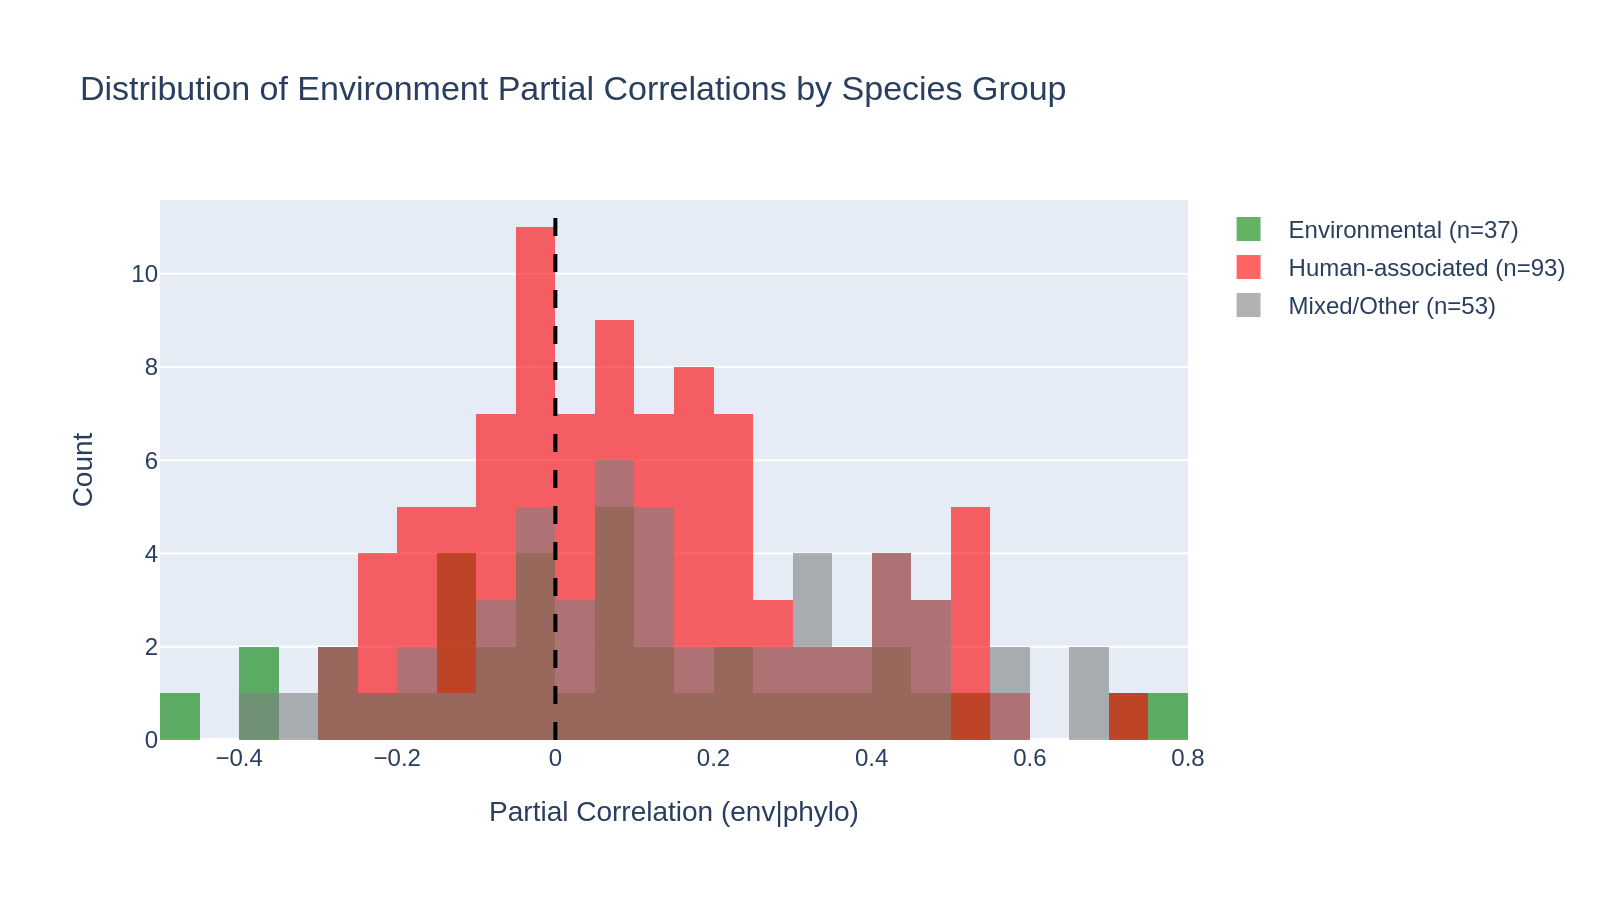 Distribution of partial correlations. From ecotype_env_reanalysis.
The original value appears as 0.0025 in the ecotype analysis and as 0.003 in the reanalysis’s citation of it. Both figures are recorded here as the sources give them. 1,2
Possible Reconciliations
- Hypothesis 1 (measurement artefact): the gap in magnitude reflects differences in genome inclusion, species inclusion, embedding coverage and downsampling rather than biology. On this view, neither absolute value is a portable estimate. 1 2
- Hypothesis 2 (coverage-limited signal): the low embedding coverage in the original analysis suppressed the environmental signal it could detect. The reanalysis’s larger value would then partly reflect a different analysis population. This remains untested. 1
- Hypothesis 3 (confounding): whatever weak signal remains could be ecological, methodological or confounded by study or sampling structure. The current evidence does not distinguish these possibilities.
Resolving Work
- Rerun both pipelines on one shared genome and species set, with identical downsampling. This tests whether the difference in magnitude disappears when inputs are matched.
- Restrict the original method to genomes with environmental embeddings and recompute median partial correlations. This tests whether low embedding coverage drives the small environmental value.
- Vary the downsampling depth systematically within the reanalysis pipeline and track the median partial correlation. This tests how sensitive the magnitude is to sampling procedure.
- Add study or submitter identifiers as covariates in the partial-correlation models. This tests whether the residual environmental signal survives study-level confounding.
- Compare the per-species distributions of distances between the two analyses. This tests whether differences in distance distributions, which the reanalysis gives as a reason the absolute values are not comparable, contribute to the gap in magnitude.