Two lines of work in this corpus touch the same quantity: per-species estimates of how strongly environment and phylogeny shape bacterial gene content. They test different things. One asks whether a summary of pangenome openness predicts those effect sizes. The other asks whether changing genome sampling changes the correlation estimates themselves. 1 Pangenome openness describes whether a species’ total gene repertoire keeps growing as more genomes are added. The question matters because a null result on openness could be misread as evidence against methodological explanations of weak environment signals, or the reverse. Each explanation also implies different follow-up analyses. The disagreement is framed on sampling-depth-and-downsampling-effects.
Evidence Sides
Side A: an openness summary showed null correlations with effect sizes, for reasons not yet identified
The pangenome-openness analysis returned null correlations. It tested whether an openness summary predicts environment or phylogeny effect sizes. It did not test whether changing genome sampling changes correlation estimates. 1 Three readings of the null remain unresolved:
- pangenome structure is genuinely decoupled from eco-phylogenetic dynamics, meaning the joint influence of ecology and shared ancestry on gene content;
- the openness metric is too coarse;
- the matched species sample and the upstream effect estimates limit statistical power. 1
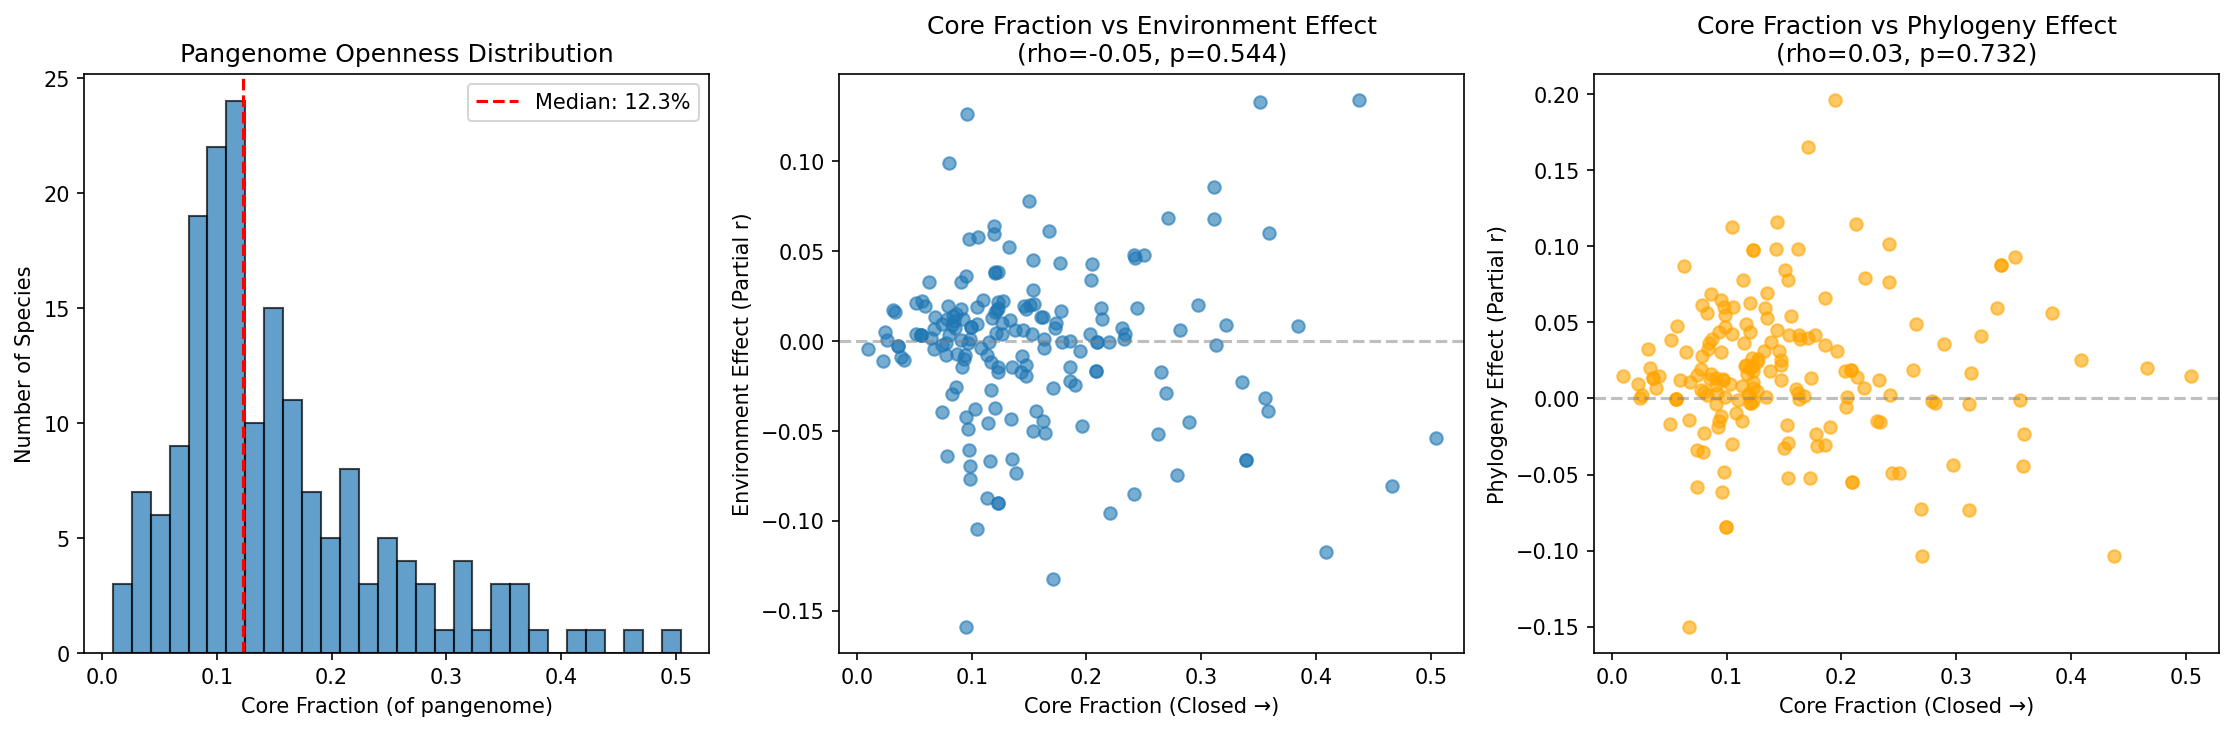 Pangenome Openness vs Effects. From pangenome_openness.
Side B: correlation estimates may depend on methodological factors that remain unseparated
Several candidate factors may drive the correlation-scale difference between analyses:
- downsampling, meaning reducing the set of genomes analysed;
- genome-set composition;
- extraction behavior;
- embedding coverage, meaning how completely the data are represented in the numerical representations used;
- condition coverage;
- missingness, meaning uneven absence of metadata or measurements;
- another methodological factor.
Deciding which of these mainly drives the correlation-scale difference requires a controlled reanalysis. 2,3,4
Possible Reconciliations
- Hypothesis 1: the sides are orthogonal. The openness test does not address whether changing genome sampling changes correlation estimates, so both results may hold at once because they answer different questions. 1
- Hypothesis 2: a shared upstream limitation. The openness null may stem from limited power in the matched species sample and upstream effect estimates. 1 Whether methodological factors such as downsampling or missingness also drive the correlation-scale difference requires a controlled reanalysis. 2,3,4 If both hold, the two lines may share one methodological cause.
- Hypothesis 3: metric resolution. A coarse openness summary may hide a real link that a finer measure of pangenome structure would reveal. 1
Resolving Work
- Recompute effect sizes under downsampling, then retest openness. Take the matched species set used for the openness test, recompute environment and phylogeny effect sizes under controlled genome downsampling, check whether they are stable across replicate downsamples, and retest openness against the recomputed estimates. Question: does the openness null persist once sampling depth is held fixed?
- Vary one factor at a time. Reanalyze the ecotype correlation pipelines, swapping genome-set composition, extraction settings, embedding coverage and missingness handling while holding everything else constant. Question: which single factor mainly drives the correlation-scale difference?
- Replace the single openness summary with finer measures. Use pangenome gene-frequency spectra or accessory-gene functional categories against the same effect estimates. Question: is the null a product of metric coarseness?
- Run a power analysis. Simulate effect-size noise on the matched species sample. Question: could the openness test have detected a modest true relationship given its sample size and upstream estimate uncertainty?
Open Directions
- Combine both tests in one controlled run. A single controlled reanalysis that includes the openness test could test whether the two lines share a methodological explanation, though unresolved metric coarseness and limited power may still leave a shared cause and independence indistinguishable.