Raw report: genotype_to_phenotype_enigma Feeds into: active-learning-experiment-selection, capability-versus-kinetic-predictability, computational-pathway-prediction-validation, condition-specific-fitness, cross-tenant-data-bridging, cultivation-collection-bias-in-ecological-genomics, ecotype-environment-gene-content, environment-embedding-geography, feature-attribution-with-correlated-genomic-features, gene-cooccurrence-ecological-guilds, gene-essentiality, gene-function-acquisition-depth, metabolic-capacity-specialization, multi-omics-integration, phenotype-database-coverage-bias, phylogenetic-confounding-of-pangenome-associations, sample-size-aware-phenotype-consensus, sampling-depth-and-downsampling-effects, subsurface-hydrogeological-zonation, taxonomic-nomenclature-reconciliation, taxonomic-resolution-dependent-functional-inference
Overview
This project integrates ENIGMA growth curves, the ENIGMA Genome Depot, Fitness Browser RB-TnSeq (random barcode transposon sequencing) gene-fitness data, Web of Microbes exometabolomics, Carbon Source Phenotypes (globalusers_carbon_source_phenotypes), pangenome data, and global 16S environmental data to test whether bacterial growth phenotypes can be predicted from genome content and growth condition. The corpus contains 46,389 genome × condition training pairs, and the study distinguishes predictable binary growth capability from poorly predictable continuous kinetics. It also links model failures to a field-relevant active-learning proposal for the Oak Ridge contaminated subsurface site. The report lists Adam Arkin (ORCID: 0000-0002-4999-2931; U.C. Berkeley / Lawrence Berkeley National Laboratory) as an author. 1
Key Findings
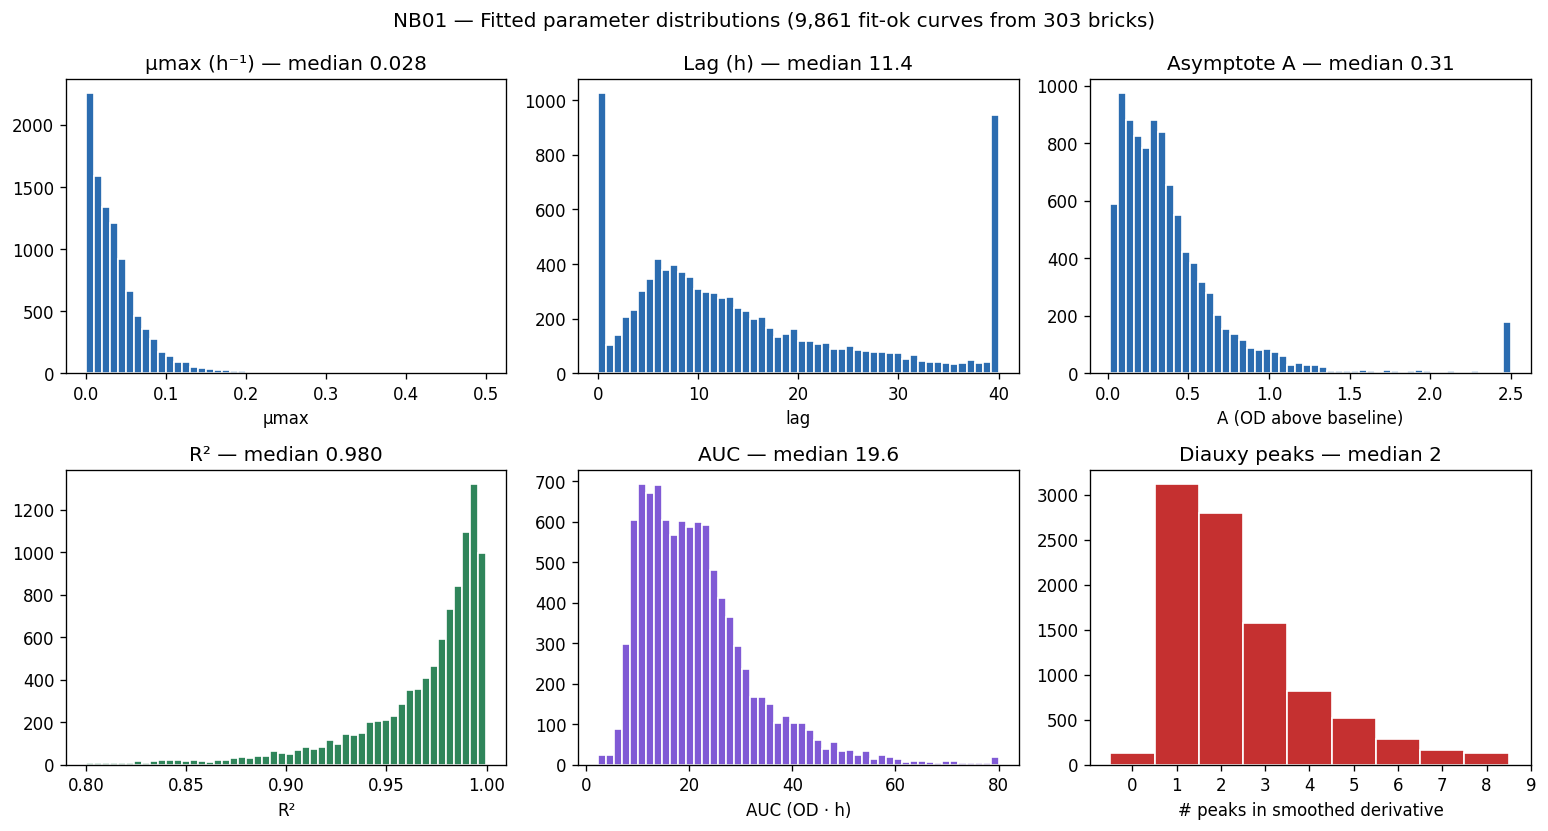
- The integrated ENIGMA growth-curve corpus contains 27,632 curves across 123 strains, 195 molecules, 303 plates, and 7.57M timepoints. Of these, 15,227 curves (55.1%) showed no detectable growth, 9,861 (35.7%) were fit-ok, and modified Gompertz fits had median R² = 0.98. Fit-ok curves had median µmax = 0.028 h⁻¹, median lag = 11.4 h, and median asymptotic OD increase A = 0.315; 40% showed at least two growth phases in their smoothed derivative. In the fit-ok subset (n=9,861), the reported IQRs and ranges were mumax 0.017-0.048 h^-1 (range 0.001-0.50), lag 5.2-18.5 h (range 0-48), and asymptotic A 0.14-0.66 OD (range 0.05-2.77); the median R^2 was 0.980 (IQR 0.96-0.99; range 0.80-1.00), and the median growth-curve area under the curve was 15.8 OD*h (IQR 5.5-31.5; range 0.3-98). The report gives the median µmax as a doubling time of ~24.5 h. It treats the no-growth fraction as a biological signal of substrate incompatibility or stress lethality, not as measurement failure. It reads the frequent multiphase curves as suggesting that sequential substrate utilization is widespread among Oak Ridge isolates; that reading is an interpretation, not a direct measurement. 1
 Growth corpus statistics. From genotype_to_phenotype_enigma.
-
ENIGMA growth data align with Fitness Browser data through 486 strain × condition anchor pairs covering 7 strains and 72 conditions; 275 pairs (56.6%) showed measurable growth, which gives balanced positive and negative labels for binary prediction. Four media names (RCH2_defined_noCarbon, LB, R2A, M9) match exactly between ENIGMA and the Fitness Browser, and 42 molecules align by normalized compound name. Pseudomonas anchor strains grew in 43-61% of conditions, consistent with metabolic generalists, whereas Pedobacter (23.5%) and Acidovorax (22.4%) grew much less often, consistent with more specialized metabolic repertoires; the report treats the no-growth fraction itself as a prediction target. Five conditions—cytidine, glycine, inosine, thymidine, and uridine—occur in all four aligned datasets, while 30 occur in three datasets, including acetate, citrate, ethanol, glycerol, pyruvate, and succinate. A further 107 occur in two datasets, spanning various carbon sources, amino acids, metals, and antibiotics. A separate carbon-source phenotype corpus contains 795 genomes and 379 conditions, and the combined modeling corpus contains 46,389 pairs across 727 genomes and 363 conditions with 4,293 shared kegg orthologs (KOs). 1
-
Hierarchical clustering on Jaccard distance of 7,167 unique KO presence/absence features across 123 strains identified 8 metabolic guilds spanning 20 taxonomic orders. Guilds aligned with, but were not identical to, taxonomy; genome sizes ranged from 2.6 to 11.4 Mb, and strains contained 1,256–3,014 unique KOs with median 2,121. The Pseudomonas_E guild contained 27 strains and averaged 2,658 KOs, while the Flavobacteriales guild contained 6 strains and averaged 1,372 KOs, the fewest functional genes, and is described as the hardest out-of-distribution prediction target. The Pseudomonas_E guild contains 5 of 7 Fitness Browser anchor strains, making it the best-sampled guild for modeling, and genome size correlates strongly with KO diversity. COG (Clusters of Orthologous Groups) class profiles show guild-specific functional enrichment, with the largest differences in categories L (replication/repair/recombination) and M (cell wall/membrane biogenesis). 1
-
Genus-level environmental profiling across all GTDB genomes found that globally sampled Pseudomonas was 37.8% clinical, 12.9% soil/plant, and 9.4% aquatic, whereas all ENIGMA Pseudomonas belonged to the environmental Pseudomonas_E fluorescens/protegens clade. Rhodanobacter was 55% aquatic, 10% contaminated, and 0% clinical in the analyzed profiles. The report infers that ENIGMA’s subsurface field isolates occupy environmental niches underrepresented in the NCBI genome collection, so transfer learning from clinical phenotype databases may be biased. The 14 ENIGMA genera occurred in 4,086–288,686 of 464,000 global 16S samples; Caulobacter occurred in 289K samples, Rhodanobacter in 228K, and Pseudomonas in 206K. 1
-
Local Oak Ridge co-occurrence and global environmental data support a pH-driven niche partition. Across 587 100-Well-Survey communities, two anti-correlated genus clusters produced 47 significant pairs with |rho| > 0.2 and p < 0.01. Cluster A comprised Brevundimonas, Caulobacter, Sphingomonas, Variovorax, and Sphingobium; Cluster B comprised Rhodanobacter, Ralstonia, Dyella, Serratia, and Comamonas. The strongest within-cluster pair in Cluster A had rho = +0.56 and in Cluster B rho = +0.40, and the clusters were negatively correlated with each other (Brevundimonas–Rhodanobacter rho = -0.34). Across 464K global 16S samples, Cluster A averaged pH 6.78 and 15.7°C, while Cluster B averaged pH 5.43 and 22.6°C: a difference of 1.35 pH units and 6.9°C. The acidic cluster appeared in 3,720 exclusive global samples versus 179,023 for the neutral-pH cluster, which the report describes as 48x rarer. Dominant environments were aquatic 33%, plant 23%, and soil 22% for the neutral-pH Cluster A, versus aquatic 39%, soil 23%, and plant 18% for the acidic Cluster B. The report’s narrative text gives these as pH 5.4 and 6.8, argues that the pattern mirrors the Oak Ridge contamination gradient where nitric acid leachate lowers pH in plume wells, and interprets it as a global rather than site-specific pH-driven niche partition; this explanation rests on observational co-occurrence and environmental averages rather than a direct causal test. 1
-
A strain-name collision caused 12 of 32 genus-level mismatches when ENIGMA strains were matched to the KBase Data Lakehouse pangenome through
ncbi_strain_identifiersshort identifiers such as MT20. One collision matched Rhodanobacter glycinis to Streptococcus pneumoniae and introduced 1,751 spurious clinical genomes into environmental profiles. Using CORAL brick 522 GTDB-Tk assignments and checking genus consistency reduced verified linkages from 32 to 20 and eliminated all false matches. The report documents this pitfall as affecting any project that links ENIGMA strains to the pangenome by name. More generally, it describes the pitfall as a systematic data-integration hazard for any project that links field isolates to reference databases by short strain identifiers. 1 -
The initial 7-strain model used 486 anchor pairs with four hierarchical feature levels: 28 phylogeny features, 8 bulk scalars, 4,305 prevalence-filtered KO features plus 23 COG classes, and 7 condition-class and concentration features. The prevalence filter removed 456 core KOs (p > 0.95) and 2,406 rare KOs (p < 0.05), and no PCA was applied, so every retained KO remains a named feature. It achieved AUC 0.633 for binary growth under leave-one-strain-out validation. Here, AUC means area under the receiver-operating-characteristic curve. Correlation-grouped SHAP (SHapley Additive exPlanations) attributed 25.3% of total importance to a 63-feature genome-scale axis and 45.9% to condition class; specific KO blocks such as membrane adaptation, tRNA modification, aromatic catabolism, and flagellar motility contributed approximately 2% each. The report states that naive SHAP on 4,305 KOs splits credit across correlated gene blocks. It also states that correlation grouping at |r|>0.8 reveals a 63-feature genome-scale axis that dominates with small training sets. It cautions that individual SHAP values within a group should be interpreted as “this group matters” rather than “this specific KO matters.” 1
-
In the preliminary model comparison, the ENIGMA-only gradient-boosted decision-tree (GBDT) model achieved AUC 0.633 at 100% coverage, whereas GapMind achieved AUC 0.646, 78.8% accuracy, and 24.3% coverage on 118 testable pairs, with 96.5% recall and 79% precision: it almost never misses a grower but sometimes predicts growth when a pathway is present but unused. Matched-condition Carbon Source Phenotypes transfer achieved AUC 0.800 and 76.8% accuracy at 23% coverage, while internal five-fold Carbon Source Phenotypes validation achieved AUC 0.858. Approximately 76% of ENIGMA conditions lacked GapMind pathway coverage or Carbon Source Phenotypes training data; on these conditions, prediction fell to approximately AUC 0.63. The compared models differ in coverage and evaluation settings, so their AUCs are not directly equivalent. The report’s discussion states GapMind’s performance as 78.8% accuracy and 24% coverage, describes it as mechanistic, and treats it as complementary to the data-driven GBDT (AUC 0.78 on amino acids, broader coverage). In that framing, GapMind serves high-confidence pathway-level predictions, and GBDT gives broader coverage with lower confidence. The H4 hypothesis outcome describes Carbon Source Phenotypes transfer as supported for matched conditions. It reports AUC 0.800 versus 0.633 for ENIGMA-only training on matched conditions, plus full-corpus AUC 0.78 for amino acids. 1
-
Full-corpus LightGBM gradient-boosted decision-tree modeling used 46,389 pairs (13,632 ENIGMA + 32,757 Carbon Source Phenotypes) from 727 genomes, 106 genus-blocked holdouts, and 4,293 shared KOs. Overall binary-growth AUC was 0.620, but performance varied by condition class: amino acids AUC 0.775 across 7,765 pairs, nucleosides AUC 0.780 across 829 pairs, carbon sources AUC 0.695 across 8,965 pairs, other conditions AUC 0.654 across 24,590 pairs, antibiotics AUC 0.619 across 238 pairs, metals AUC 0.605 across 232 pairs, and nitrogen AUC 0.435 across 152 pairs. The report labels nitrogen performance as worse than random. It describes the metals AUC as trivially “predicted” because metal conditions had a 98% growth rate. The report summarizes binary growth as predictable from KO presence/absence on amino acids (AUC 0.775, with tryptophan reaching 0.933) and nucleosides (0.780), moderately predictable on carbon sources (0.695), and not predictable on metals, antibiotics, or nitrogen from KO content alone; 95 of 343 tested conditions achieve AUC > 0.75. The report’s headline statement summarizes full-corpus genotype-to-phenotype prediction across 727 genomes this way: binary growth on amino acids/nucleosides is predictable from KO content (AUC 0.78), while growth rate is not. The report presents this as establishing the boundary between what gene content can and cannot predict about bacterial physiology. The report also finds that the growth-predictive KOs identified cross-genus and the metabolite-production-associated KOs identified within-genus are different feature sets (Spearman rho=0.043), answering different biological questions. 1
-
Adding KEGG-pathway-based KO × condition interaction features increased mean AUC from 0.620 to 0.653. These features ask whether a genome has KOs relevant to the tested condition’s catabolic pathway. The report states the gain as +0.032, with improvement in 80 of 106 held-out genera; the effect was strongest for Microbacterium (+0.088) and Sphingomonas (+0.074). Across 343 individually testable conditions, 95 achieved AUC > 0.75. The best individual conditions were tryptophan (0.933), phenylalanine (0.932), valine (0.927), mannose (0.904), and galactose (0.895); the worst were turanose (0.059) and adonitol (0.010), which the report describes as complex sugars with rare catabolic pathways. In the full-corpus GBDT modeling (46K pairs, 106 genus-blocked holdouts), SHAP identified condition-specific predictors including K03762 (proP, proline/betaine transporter), K10440 (rbsC, ribose transporter), K01857 (pcaB, protocatechuate cycloisomerase for aromatic catabolism), K13633 (ftrA, AraC-family carbon catabolism regulator), and K01214 (treX, isoamylase for complex carbohydrates). The report describes these as the mechanistically correct transporters and catabolic enzymes. 1
-
Continuous µmax, lag, and yield-related max_A were not predictable under genus-blocked holdout from KO presence/absence or bulk genomic features, producing negative R² in both the 46K-pair model and dedicated bulk-feature regression. Weak univariate correlations—n_unique_KOs with µmax at r = +0.42 and n_tRNA with µmax at r = +0.30—were phylogenetically confounded and provided zero cross-genus predictive power. The report interprets this as a biological limitation: gene content encodes whether an organism can use a substrate, whereas rate depends on enzyme kinetics, expression, regulatory context, and ribosome efficiency. Ribosome efficiency is captured by codon usage bias (CUB), which requires nucleotide sequences that are not accessible on JupyterHub. The report states that predicting continuous growth parameters would require CUB computation from GenBank files, which are available on the CGCMS server, or expression data. The same null appeared in the preliminary n = 7 anchor analysis, where continuous mumax, lag, and max_A regressions also had negative R². 1
-
Comparing 7 strains with 46K pairs showed a qualitative shift from genome-scale to condition-specific prediction. With 7 strains, the model learned a genome-size and condition-class pattern equivalent to “big genomes grow on amino acids”; with 46K pairs, it identified substrate-relevant transporters, catabolic enzymes, and regulators. The report therefore concludes that mechanistic gene-specific prediction requires hundreds of genomes per condition rather than a small number of anchor strains. In SHAP terms, the n = 7 anchor model assigned 45.9% importance to condition class and 25.3% to genome-scale features. The 46K-pair model instead surfaced the ribose transporter (K10440), the proline transporter (K03762), protocatechuate cycloisomerase (K01857), and AraC regulators (K13633). In the full-corpus SHAP beeswarm, KO presence pushed predictions toward growth and KO absence pushed them toward no-growth. This matches the expectation that having the catabolic gene enables growth on the corresponding substrate. 1
-
SHAP features were mechanistically coherent—for example, a ribose transporter predicted ribose growth and protocatechuate cycloisomerase predicted aromatic catabolism. Fitness Browser concordance, however, was weak but positive: 18.7% of top SHAP KOs expanded into correlation-grouped gene blocks (|r|>0.8; 57 KOs → 335 Fitness Browser loci) showed significant matched-condition fitness effects (|t|>4), compared with a 16.3% random baseline, giving 1.19× enrichment. Enrichment ranged from 1.72× for Cup4G11 to 0.83× for pseudo1_N1B4. The report interprets this as a distinction between gene presence across genera and gene essentiality within one strain, rather than evidence that the SHAP features are non-mechanistic. A gene can be critical for cross-genus prediction yet show no fitness defect when disrupted in one strain, because of redundant pathways or differences between the lab condition and the growth assay. SHAP also spreads credit across correlated features, so the causal gene may be a correlated neighbor of the highlighted one, which dilutes concordance. The report further cautions that the model predicts growth correctly (AUC 0.78 for amino acids) through combinations of prevalence-variable KOs that act as genus-level proxies, not through individually mechanistically causal genes. It characterizes the features as barely more fitness-significant than random genes under matched conditions. 1
-
In the Web of Microbes analysis of 6 strains and 105 metabolites, multivariate GBDT failed at n = 6 strains with AUC = 0.500, whereas univariate per-metabolite point-biserial correlations identified 940 strong associations with |r| > 0.7 across all 62 variable metabolites. The associations included 454 production relationships and 486 consumption relationships, using a feature set of 156 Fitness Browser-cognate KOs, defined as KOs with significant fitness effects on rich media in Pseudomonas Fitness Browser anchor organisms that are also variable across the 6 Web of Microbes strains. Examples included K01048 with taurine production, K05710 with thymine production, K02613 with lactate consumption, and K07334 with hypoxanthine consumption. Growth-predictive KOs and metabolite-production-associated KOs had Spearman rho = 0.043, which the hypothesis-outcomes section reports as ρ ≈ 0.04, indicating different feature sets and biological questions. The report’s methodological conclusion is that method choice should follow sample size: multivariate GBDT identifies condition-specific features for cross-genus growth prediction at n = 46K pairs, whereas univariate per-metabolite correlation recovers within-genus metabolite signal at n = 6 strains that multivariate models miss. The report argues that gene content explains both “can it grow?” and “what does it produce?” when each question is analyzed with the method suited to its sample size and biological resolution. These six-strain associations are correlational and do not constitute independent causal validation. 1
-
Auditing 42,771 genus-blocked holdout predictions gave 65.1% overall accuracy, 7,844 false positives, and 7,101 false negatives. Filtering to confident predictions with |p − 0.5| > 0.25 identified 1,276 high-confidence errors concentrated in genus × condition-class cells including Methylobacterium on amino acids, Sphingomonas on other carbon sources (described in the report’s summary as complex carbons), and Microbacterium on nucleosides. The report offers three explanations for these confident errors. One is a missing feature, where the gene family is not in the KO ontology or is not shared across the genus holdout. Another is a regulatory mismatch, where the gene is present but not expressed under the test condition. The third is a genuine biological oddity. These are alternative hypotheses, not resolved causes. Pairing the confident errors with uncertainty-rich regions produced the active-learning candidate ranking. 1
-
Active learning ranked 343 conditions using error rate × model uncertainty × field-relevance weight and proposed 50 next experiments. Field relevance doubled the weight for conditions matching Oak Ridge geochemistry: nitrogen sources including nitrate, organic acids associated with necromass decomposition, low-pH-compatible substrates, and aromatic compounds. The ranking prioritized organic acids, nitrate, and low-pH-relevant substrates where the model is least confident and field relevance is highest; these are proposed experiments, not measured outcomes. The top conditions included fumaric acid, melibionic acid, fumarate, itaconic acid, 2-hydroxypropanoic acid (lactic acid), hydroxy-glutaric acid γ-lactone, difumarate, L-glutamic acid, nitrate, and pyruvic acid. The report describes these as overwhelmingly organic acids and nitrogen-cycle compounds. That is the class where the full-corpus model performs worst (AUC 0.654 for “other” carbon metabolism, 0.435 for nitrogen). It is also where Oak Ridge contamination chemistry matters most, through the nitric-acid-driven pH drop and organic acid accumulation in plume sediments. Prescottella, with 16% growth across tested conditions, and Microbacterium, with 23%, were selected as especially informative genera. The proposed experiments correspond to 7,844 current prediction failures, but formal retrospective comparison with random selection remains outstanding. 1
Data and Methods
-
The report describes the ENIGMA growth curves as 123 strains x 194 conditions = 13,632 (strain x condition) pairs from
enigma_coralgrowth bricks. Binary growth is defined as any OD increase above 0.05, and continuous parameters (mumax, lag, max_A) come from fit-ok modified Gompertz fits. The Carbon Source Phenotypes corpus (globalusers_carbon_source_phenotypes; Dileep et al., a preprint in preparation) is described as 795 genomes x 379 conditions = 53,301 pairs with literature-curated binary growth labels. It also carries pre-computed KofamScan KO and BacFormer embeddings and is available for pretraining. The combined corpus contains 46,389 pairs across 727 genomes and 363 conditions, with 4,293 shared KEGG orthologs (KOs) as features. 1 -
KO presence/absence features came from Genome Depot protein → KO annotations. They were prevalence-filtered across the combined 727-genome corpus by removing 456 core KOs (present in >95% of genomes) and 2,406 rare KOs (present in <5%). The report gives 4,293 retained named features, for example K10440 = ribose transporter rbsC. The initial 7-strain model description instead gives 4,305 prevalence-filtered KOs under the same removal counts, and the two counts are reported separately. Condition class was one-hot encoded (amino acid, carbon source, metal, antibiotic, nitrogen, nucleoside, other) plus log10(concentration in mM), which the report describes as 7 features. Three KEGG-pathway interaction features (n_relevant_KOs, frac_relevant, has_any_relevant) count the genome’s KOs in the KEGG pathway relevant to the tested condition. That pathway is mapped by keyword matching to KEGG pathway descriptions. Features correlated at |r|>0.8 were grouped into connected-component blocks. The largest block, 63 features covering genome size, gene count, operons, rRNA/tRNA, and co-inherited KOs, is the “genome scale axis.” 1
-
All models used LightGBM (v4.6) gradient-boosted decision trees (GBDT) with num_leaves=31, min_data_in_leaf=20, feature_fraction=0.3, bagging_fraction=0.8, bagging_freq=5, reg_alpha=0.5, reg_lambda=2.0, n_estimators=300, and learning_rate=0.05. The report justifies GBDT over linear models by non-linear gene × condition interactions such as epistasis and threshold effects. That justification is a modeling rationale, not a reported head-to-head performance comparison. 1
-
In the genus-level blocked holdout, each of 106 genera with ≥50 pairs was held out while the model trained on all other genera. AUC, accuracy, and balanced F1 were reported per held-out genus. Per-condition AUC was computed only for the 343 conditions with ≥30 predictions and both growth classes. The 7 Fitness Browser anchor strains served as a biological validation set, not as training data. Top SHAP features were expanded to correlation-grouped gene blocks, mapped to Fitness Browser loci via
fb_pangenome_link.tsv, and checked for significant fitness effects (|t|>4) in matched experiments against a genome-wide random baseline. The overall Fitness Browser concordance table (data/fb_concordance.tsv) covers 7 anchor strains. The condition-matched concordance table with enrichment (data/fb_concordance_matched.tsv) also covers 7 anchor strains. 1 -
The report’s data inventory lists the following sources. ENIGMA growth curves: 303 plates, 27,632 curves, and 7.57M timepoints across 123 strains x 195 molecules. ENIGMA Genome Depot: 3,110 genomes and 6.8M proteins, with 3.7M KO and 6.4M COG annotations. Fitness Browser: 7 anchor strains and 27M fitness scores, giving 486 anchor (strain x condition) pairs. Web of Microbes: 6 strains and 630 metabolite observations, covering 105 compounds per strain. Carbon Source Phenotypes: 795 genomes x 379 conditions, with ~53K binary growth labels. Microbial Atlas (16S): 464K samples and 260M OTU counts, with the 14 ENIGMA genera in 4K-289K samples each. Local CORAL data: 596 locations and 587 ASV communities, with 123 strains mapped to 24 wells. 1
-
The report’s notebook and output inventory covers several analyses.
NB01_curve_fitting.ipynbperforms modified Gompertz fitting of 27,632 growth curves.NB07_full_corpus_prediction.ipynbruns the full-corpus GBDT (46K pairs) with genus-blocked holdout, per-condition analysis, and SHAP. NB08 (per-metabolite correlation) covers Web of Microbes exometabolomic prediction. It reports GBDT failure at n=6, a null result that the NB08 prediction figure gives as AUC=0.500. It also reports per-metabolite point-biserial correlation, with 940 KO-metabolite associations, which the report calls mechanistic, across 62/62 variable metabolites. NB09 (conflict detection) audits 42,771 predictions against ground truth and identifies 1,276 confident errors, together with per-genus × condition-class error patterns used for candidate ranking. NB10 (active learning) produces a 50-condition proposal ranked by error × uncertainty × field relevance, giving top candidates for the next ENIGMA experiments. The correlation-expanded SHAP KO → Fitness Browser locus mapping table (data/fb_ko_mapping.tsv) has 335 rows. 1
Caveats
-
Condition alignment was based on normalized names and produced 42 molecular matches; the report estimates that ChEBI-ID-based canonicalization could expand this to 60–80 matches through programmatic ChEBI ID resolution. That would enlarge the cross-dataset anchor frame for Fitness Browser concordance checks, but the expansion is proposed, not demonstrated. 1
-
Only 35.7% of growth curves were fit-ok. Although the 55.1% no-growth fraction is interpreted as biological, approximately 9% of curves failed fitting for technical reasons including monotone violations, short duration, and edge-well effects. 1
-
Genus-level biogeography used Microbial Atlas 16S data. Species-level biogeography was available for only 20 pangenome-linked strains with verified GTDB matches. 1
-
Spearman co-occurrence measures correlation rather than causation. Spearman co-occurrence suggests shared or exclusive niches but does not prove direct interaction. The report recommends compositionally aware SparCC analysis on the full 100WS ASV matrix to strengthen the niche-partition result. The report’s expectations that Cluster B strains should show different pH-dependent growth profiles than Cluster A strains, and that cluster-distinguishing genomic features should predict pH tolerance, are proposals rather than validated results. 1
-
Uranium, nitrate, and metal concentrations are available in CORAL bricks 10/80, but sample-to-location name resolution is incomplete, preventing a completed local test of contamination levels for the acidic Cluster B strains. The proposed test would link strain-isolation-well coordinates, already in
coral_strain_locations.tsv, to per-well geochemistry. It would ask whether Cluster B (acid-tolerant) strains come from higher-contamination wells locally, not just globally. 1 -
GC%, codon usage bias (CUB), and Morgan molecular fingerprints were not used: GC% was available for only 32 of 727 genomes, CUB required nucleotide sequences inaccessible from JupyterHub, and Morgan fingerprints required RDKit. CUB computation from GenBank files is proposed as the next test of continuous growth-rate prediction. The proposed measure is gRodon S-value or ENC computed from CDS nucleotide sequences. It would test whether ribosomal efficiency explains the µmax variation that KO presence cannot. It requires GenBank files on the CGCMS server (
/data/www/CGCMS/static/enigma1/genomes/gbff/), which are not currently accessible from JupyterHub. The report cites Xu et al. (2025, Phydon) as showing that this is the natural next feature. 1 -
The Fitness Browser concordance analysis produced 1.19× enrichment after correlation-group expansion, but full validation with KEGG-module expansion remains to be done. That pathway-level expansion would include all KOs in the same KEGG module as a top-SHAP KO. It may recover additional mechanistic signal, distinguishing “wrong feature, right pathway” from “wrong pathway,” but remains untested. The H3 hypothesis-outcomes section instead states that full Fitness Browser concordance validation with correlation-group expansion remains to be done. That sits uneasily with the 1.19× result being described as following correlation-group expansion. Both statements are retained as reported, not reconciled. The report also notes that the n = 7 initial analysis—4 Pseudomonas_E strains and one each of Cupriavidus, Acidovorax, and Pedobacter, evaluated by leave-one-strain-out—did not test cross-genus generalization, per-condition prediction quality, or condition-specific features. 1
-
The active-learning framework is actionable but H6 is only partially supported. The report links the proposed 50 experiments to 7,844 prediction failures in the current corpus. It suggests that resolving even a fraction of them would move overall accuracy from 65.1% toward the per-class ceiling of ~78% seen on amino acids and nucleosides. This is a projection, not a measured gain. A formal retrospective subsampling test comparing AL-ranked additions with random selection, followed by wet-lab execution of the 50-condition proposal, remains necessary. The H6 passage calls Prescottella (16%) and Microbacterium (23%) the two genera with the least reliable current predictions. It does not define those percentages there, so they should not be read as prediction-accuracy figures. The formal H6 test, called AL retrospective subsampling, would measure accuracy improvement per labeled pair when experiments are added in AL-ranked order versus random order, using held-out current data. The NB10 ranking framework for it is already in place, but the test has not been run. The 50-experiment list (fumaric acid, melibionic acid, nitrate, etc. × Prescottella/Microbacterium) is the report’s deliverable. Executing it in the wet lab is an ENIGMA experimental decision, not an analytical one. 1
-
The report states the interaction-feature gain as +0.032, which does not exactly match the difference between its stated mean AUC endpoints of 0.620 and 0.653. Both values are retained as reported, not reconciled. 1
-
The stated concordance rates of 18.7% and 16.3% do not yield exactly the stated 1.19× enrichment ratio. All three reported values are retained without reconciliation. 1
-
The ENIGMA growth-curve dimensions stated as 123 strains x 194 conditions are not consistent with the stated 13,632 pairs. The reported dimensions and the pair count are preserved separately. 1
-
The report states that its Act I–III backbone is complete. Remaining work is either extensions that require data outside JupyterHub reach or formal validations of already-delivered frameworks. 1
Figures
The report’s figures show condition overlap across four datasets, an anchor-strain growth heatmap, growth-corpus parameter distributions, example growth-curve fits, a plate-level quality-control summary, KO-profile PCA colored by guild and taxonomy, COG functional profiles by guild, genome size versus KO diversity, a genus environment heatmap, pangenome species environment profiles, global genus occurrence, the Oak Ridge and global genus co-occurrence matrices, a cluster environment comparison, well guild distribution, an Oak Ridge strain isolation map, the modeling feature summary, the KO prevalence filter, target distributions, variance partitioning, grouped SHAP importance, the top 20 SHAP features, a feature-correlation matrix, and a preliminary model comparison. Further figures show the prediction-coverage gap and full-corpus model results. They also show bulk genomic features versus continuous growth parameters, ROC curves by condition class, confusion matrices, per-condition AUC, and model diagnostics. Others cover full-corpus SHAP features, a SHAP comparison of the n=7 and full-corpus models, and a SHAP beeswarm. Others cover detailed and overall condition-matched Fitness Browser concordance, high-confidence prediction-error detection, active-learning candidates, and the proposed active-learning experiments. The exometabolomic figures show a metabolite-production KO heatmap, mechanistic gene–metabolite examples, Fitness Browser cognate results, and an exometabolomic method comparison. 1
Named figure files include the following 1:
NB00_growth_corpus_stats.png: growth-corpus scale summary.NB00_per_strain_curves.png: per-strain curve counts.NB00_strain_tiers.png: strain data-availability tiers.NB01_curve_fit_examples.png: 12 representative Gompertz fits.NB01_parameter_distributions.png: mu, lag, A, R^2, and AUC distributions.NB01_qc_summary.png: per-plate QC pass rates.NB01_single_brick_qc.png: single-brick validation.NB02_anchor_growth_heatmap.png: growth matrix for 7 anchor strains x conditions. 1NB00_condition_overlap.png: initial condition overlap assessment.NB02_condition_overlap_4way.png: 4-dataset condition overlap.NB02_coverage_summary.png: coverage matrix distributions.NB03_ko_pca_guilds.png: KO PCA by guild and taxonomy.NB03_cog_by_guild.png: COG profiles by metabolic guild.NB03_genome_vs_ko.png: genome size vs KO diversity.NB04_genus_env_heatmap.png: genus x environment (GTDB-wide).NB04_pangenome_env_profiles.png: species-clade environment profiles.NB04_global_genus_occurrence.png: global 16S genus occurrence.NB04_oak_ridge_strain_map.png: Oak Ridge well locations.NB04_well_guild_distribution.png: guild composition per well.NB04_oakridge_cooccurrence.png: local Spearman co-occurrence.NB04_global_cooccurrence.png: global Jaccard co-occurrence.NB04_cluster_env_comparison.png: pH/temperature niche comparison.NB05_feature_summary.png: feature dimensionality per level + condition class distribution.NB05_target_distributions.png: binary growth and continuous target distributions in anchor set.NB06_variance_partition.png: cumulative AUC + incremental + SHAP by feature level.NB06_shap_top20.png: top 20 SHAP features with KEGG annotations.NB06_feature_correlation.png: correlation matrix of top-50 features showing correlated blocks.NB06_group_shap.png: group-level SHAP after correlation grouping.NB07_model_comparison.png: GapMind vs CSP (Carbon Source Phenotypes) transfer vs ENIGMA-only comparison.NB07_coverage_gap.png: condition coverage gap by condition class.NB07_full_corpus_results.png: per-condition-class and per-genus AUC (genus-blocked holdout).NB07_full_corpus_shap.png: top 20 SHAP features from full-corpus model.NB07_bulk_vs_continuous.png: bulk genomic features vs continuous growth parameters.NB07_confusion_matrices.png: confusion matrices per condition class (7 panels + overall).NB07_roc_curves.png: ROC curves overlaid by condition class.NB07_shap_beeswarm.png: SHAP beeswarm (feature value + direction for top 20).NB07_shap_comparison_n7_vs_full.png: feature importance shift, n=7 genome-scale → n=46K condition-specific.NB07_per_condition_auc.png: per-condition AUC (top 10 per class, 60 conditions).NB07_model_diagnostics.png: genus holdout AUC distribution + interaction feature scatter.NB07_fb_concordance_detail.png: SHAP vs random per strain with enrichment fold.NB08_wom_prediction.png: Web of Microbes GBDT prediction (AUC=0.500), SHAP overlap, per-metabolite accuracy.NB08_production_ko_heatmap.png: 6 strains × 30 metabolites with paired KO presence sidebar.NB08_mechanistic_examples.png: 4 worked examples, taurine/thymine production and lactate/hypoxanthine consumption.NB08_method_comparison.png: GBDT (random) vs per-metabolite correlation (62/62 explained).NB08_fb_cognate_results.png: 940 KO-metabolite associations, production vs consumption.NB09_conflict_detection.png: confusion breakdown, confident errors, per-genus × condition-class error heatmap.NB09_active_learning_candidates.png: top 30 AL candidates by combined error × uncertainty score.NB10_active_learning_proposal.png: final 50-experiment proposal ranked by field-relevance-weighted score. 1
Slots Into
- condition-specific-fitness — binary growth is predictable for some condition classes and individual substrates, while antibiotics (AUC 0.619) are marginal, metals (AUC 0.605) are only trivially “predicted” given a 98% growth rate, and nitrogen (AUC 0.435 across 152 pairs) performed worse than random, a null result for KO-based prediction; the result also separates condition-specific growth capability from continuous kinetics. 1
- gene-function-acquisition-depth — the 7-strain to 46K-pair comparison shows that larger training corpora shift predictors from genome-scale proxies to substrate-specific catabolic genes. 1
- gene-essentiality — weak 1.19× Fitness Browser concordance demonstrates that cross-genus gene presence and within-strain gene essentiality answer different questions. 1
- multi-omics-integration — growth curves, KO annotations, RB-TnSeq fitness, exometabolomics, pangenomes, and environmental metadata are integrated, with method choice matched to sample size and phenotype resolution. 1
- environment-embedding-geography — global 16S data connect Oak Ridge co-occurrence to a pH difference of 1.35 units and a temperature difference of 6.9°C between genus clusters. 1
- ecotype-environment-gene-content — eight functional metabolic guilds, ENIGMA environmental outlier status, and the pH-partitioned Cluster A/Cluster B ecology link gene content to environmental distribution. 1
- cross-tenant-data-bridging — the study establishes 486 condition-matched Fitness Browser anchors and documents a strain-name collision that generated 1,751 spurious clinical genomes. 1
- subsurface-bacillota-specialization — the Oak Ridge-focused active-learning proposal prioritizes acidic, nitrogen-related, and organic-acid conditions relevant to contaminated subsurface physiology. 1
- capability-versus-kinetic-predictability — binary growth capability is partly predictable from KO content while µmax, lag, and yield are not under cross-genus holdout, and gene-specific signal emerges only with the large training corpus. 1
- active-learning-experiment-selection — 50 proposed Oak Ridge conditions ranked by error, uncertainty, and field relevance, not yet retrospectively compared with random selection. 1
- computational-pathway-prediction-validation — GapMind shows high recall but lower precision, and roughly three-quarters of ENIGMA conditions lack GapMind or Carbon Source Phenotypes coverage. 1
- metabolic-capacity-specialization — Pseudomonas anchors grow on far more conditions than Pedobacter and Acidovorax, consistent with generalist versus specialized repertoires. 1
- cultivation-collection-bias-in-ecological-genomics — clinical dominance of global Pseudomonas genomes contrasts with environmental ENIGMA isolates. 1
- phenotype-database-coverage-bias — transfer from clinically skewed phenotype databases may bias predictions for subsurface isolates. 1
- subsurface-hydrogeological-zonation — anti-correlated genus clusters across 587 100-Well-Survey communities at Oak Ridge. 1
- taxonomic-nomenclature-reconciliation —
ncbi_strain_identifiersname collisions caused genus mismatches that GTDB-Tk assignments resolved. 1 - feature-attribution-with-correlated-genomic-features — correlation grouping at |r|>0.8 produced a 63-feature genome-scale axis, and SHAP credit sharing among correlated features dilutes Fitness Browser concordance. 1
- phylogenetic-confounding-of-pangenome-associations — univariate genome-feature correlations with µmax were phylogenetically confounded and did not transfer across genera, and predictive KO combinations can act as genus-level proxies. 1
- cross-condition-metabolic-comparability — media and normalized compound-name alignment linked ENIGMA, Fitness Browser, Carbon Source Phenotypes, and Web of Microbes conditions. 1
- sampling-depth-and-downsampling-effects — training-set size changed what the model learned: with 7 anchor strains it learned genome scale (25.3%) and condition class (45.9%), and with 46K training pairs it learned condition-specific KOs. 1
- taxonomic-resolution-dependent-functional-inference — Microbial Atlas biogeography was resolved only at genus level (16S), and species-level analysis was available for only 20 pangenome-linked strains with verified GTDB matches. 1
- gene-cooccurrence-ecological-guilds — the anti-correlated Oak Ridge genus clusters rest on Spearman co-occurrence, which does not prove direct interaction; the report proposes compositionally aware SparCC on the full 100WS ASV matrix. 1