Raw report: ecotype_functional_differentiation Feeds into: adaptive-versus-housekeeping-functional-differentiation, ecotype-clustering-validity, ecotype-environment-gene-content, genome-wide-versus-locus-specific-ecological-adaptation, genomic-under-representation, horizontal-gene-transfer-driven-innovation, phenotype-database-coverage-bias, phylogenetic-confounding-of-pangenome-associations, research-attention-inequality, sampling-depth-and-downsampling-effects, selection-on-outcome-leakage, taxonomic-resolution-dependent-functional-inference, two-speed-bacterial-genome
Overview
This report tests whether within-species gene-content ecotypes differ functionally by clustering bacterial genomes from the KBase Data Lakehouse pangenome database and comparing their COG (Clusters of Orthologous Groups) profiles. PCA followed by KMeans clustering of auxiliary gene presence/absence matrices identified valid gene-content ecotypes in 12 of 15 sampled species (80%), assigning 1,820 genomes across 12 species spanning 6 phyla; species averaged 3.7 ecotypes, with a range of 2–6 and a mean silhouette score of 0.215 (median: 0.174). The results indicate that ecotype gene-content variation is systematically differentiated in function, especially in adaptive categories, although ecotype boundaries are overlapping and the analysis is limited by sampling, annotation coverage, clustering assumptions, and possible phylogenetic confounding. 1
Key Findings
Gene-content ecotypes are widespread
Valid gene-content ecotypes were detected in 12 of 15 sampled species (80%). The clearest separation occurred in Erwinia amylovora (silhouette = 0.468, 2 ecotypes) and Bacteroides xylanisolvens (silhouette = 0.366, 6 ecotypes), while the weakest signals occurred in Staphylococcus simulans (0.118) and Streptococcus pseudopneumoniae (0.131). Valid clusters required at least 2 ecotypes with at least 10 genomes each and at least 20 assigned genomes in total. 1
The 12 successful species, given as (genomes, ecotypes, silhouette, assigned genomes), were Staphylococcus simulans (78, 3, 0.118, 63), Enterococcus D gallinarum (95, 3, 0.245, 86), Pectobacterium carotovorum (57, 2, 0.196, 57), Streptococcus pseudopneumoniae (127, 4, 0.131, 118), Bacillus safensis (120, 3, 0.141, 117), Limosilactobacillus fermentum (118, 4, 0.143, 107), Enterobacter cloacae M (136, 4, 0.178, 123), Enterobacter kobei (252, 2, 0.159, 252), Enterobacter cloacae (216, 5, 0.170, 210), Erwinia amylovora (231, 2, 0.468, 231), Bacteroides xylanisolvens (207, 6, 0.366, 207), and Mycobacterium avium (249, 6, 0.263, 249). The source lists Enterobacter cloacae M and Enterobacter cloacae as separate species. 1
The report states that the 1,820 assigned genomes span 6 phyla but names only four (Bacillota, Pseudomonadota, Actinomycetota, Bacteroidota); this internal discrepancy is unresolved in the source. The report presents widespread ecotypes as consistent with a prior observatory ecotype analysis (ecotype_analysis, 172 species) and with Hoarfrost et al. 2019 and Ahlgren et al. 2020; these serve as secondary context rather than new evidence. 1
The moderate silhouette scores (mean 0.215) indicate overlapping ecotype boundaries rather than discrete populations. The report treats the ecotypes as statistical tendencies in gene content rather than sharply defined lineages, which it considers biologically expected because auxiliary gene acquisition and loss is ongoing. 1
Ecotypes show pervasive COG functional differentiation
Across 257 chi-square or Fisher’s exact tests covering 12 species and 23 COG categories, 170 tests (66.1%) were significant after BH-FDR (Benjamini–Hochberg false-discovery-rate) correction at q < 0.05. All 12 species had at least one significantly differentiated COG category, rejecting the null hypothesis that ecotype gene-content variation is functionally random. 1
The most frequently differentiated categories were E (amino acid metabolism), significant in 11/12 species (91.7%); S (unknown function), 11/12 (91.7%); V (defense), 11/12 (91.7%); and G (carbohydrate metabolism), 10/12 (83.3%). The least frequently differentiated categories were A (RNA processing), 1/9; B (chromatin), 1/8; and Z (cytoskeleton), 2/6. 1
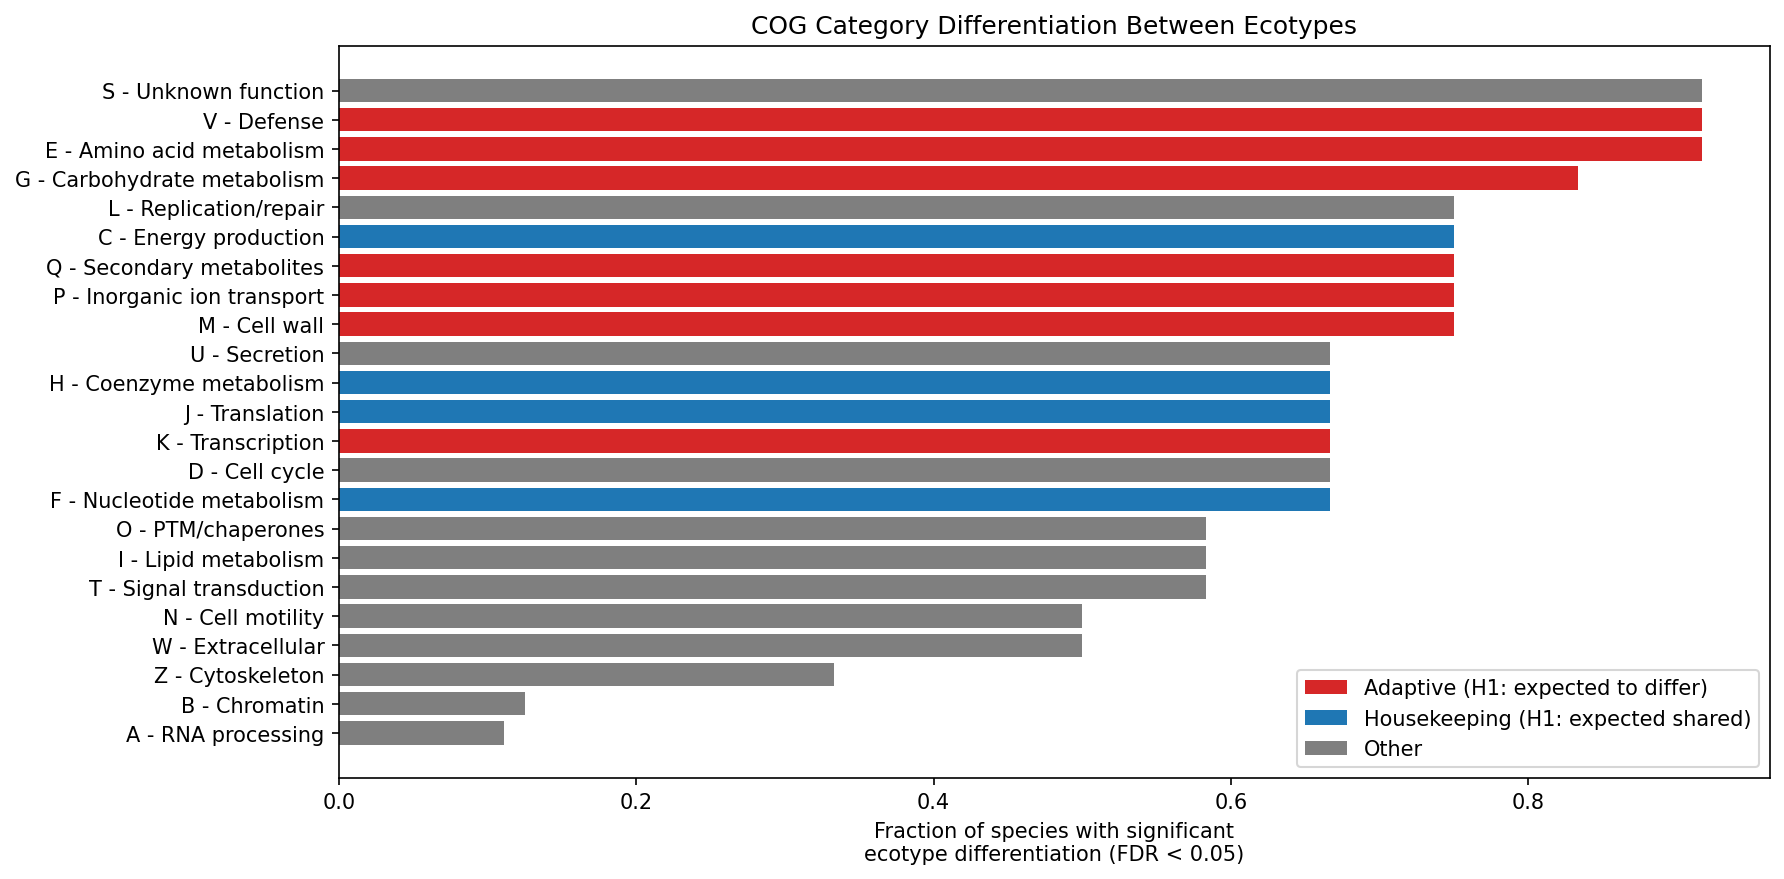 COG differentiation rates by category, colored by adaptive (red) vs housekeeping (blue) vs other (gray). From ecotype_functional_differentiation.
The report compares these results with Moulana et al. (2020), which found that COG categories P and S showed the most variation between Sulfurovum ecotypes at hydrothermal vents. Here P was differentiated in 9/12 species and S in 11/12 species with the largest effect, which the report presents as extending that single deep-sea-species finding to 12 diverse species; the earlier study is secondary evidence for this page. 1
Adaptive categories have larger effect sizes than housekeeping categories
The hypothesis that adaptive categories V, P, G, E, Q, M, and K would differentiate more than housekeeping categories J, F, H, and C received partial support. Adaptive categories had a significance rate of 79.8% (67/84), compared with 68.8% (33/48) for housekeeping categories, a 1.16x ratio. Their mean effect size was 0.0136 versus 0.0064 for housekeeping categories, a 2.13x ratio, and the one-sided Mann–Whitney U test gave p = 2.53 x 10^-6. 1
Housekeeping categories also differentiated in most species, so the significance-rate difference is modest (1.16x). However, the report’s narrative states that the magnitude of differentiation (effect size) is 2.1x larger for adaptive categories, a difference it describes as highly significant (p = 2.53 x 10^-6, Mann–Whitney U, one-sided). The report interprets this as evidence that ecotypes differ in both adaptive and housekeeping functions, with stronger differentiation in defense, transport, secondary metabolism, and cell-wall functions than in translation, nucleotide metabolism, coenzyme metabolism, and energy production. 1
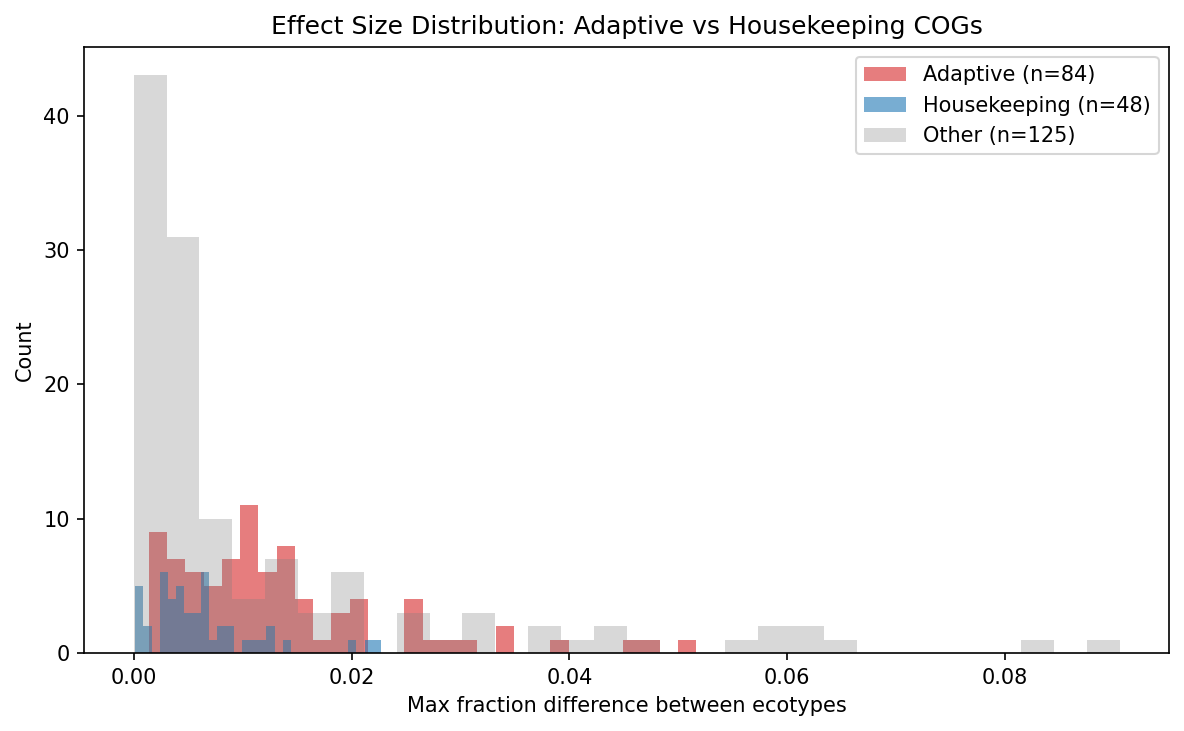 Effect size distributions for adaptive vs housekeeping COG categories. From ecotype_functional_differentiation.
Replication/repair and unknown-function categories drive large differences
S (unknown function) had the largest mean effect size, 0.039 in the report’s narrative (0.0392 in the detailed table), and was significant in 11/12 species. L (replication, recombination, and repair) had the second-largest mean effect size, 0.034 in the narrative (0.0337 in the detailed table), and was significant in 9/12 species. Category L includes transposases, integrases, and mobile genetic element machinery, while the large S-category effect indicates that a substantial fraction of ecotype differentiation involves genes whose functions remain uncharacterized. 1
The report links the prominence of L to the “two-speed genome” pattern from the cog_analysis project, where novel genes were enriched in L (+10.88%) and V (+2.83%) relative to core genes. This is a cross-project interpretation, not direct evidence of a mobile-element mechanism in this analysis. 1
In the detailed per-category table, S: 11/12 significant, rate 0.917, mean effect 0.0392; L: 9/12, 0.750, 0.0337; and the remaining reported per-category results were E: 11/12 significant, rate 0.917, mean effect 0.0120; V: 11/12, 0.917, 0.0078; G: 10/12, 0.833, 0.0176; M: 9/12, 0.750, 0.0155; C: 9/12, 0.750, 0.0095; P: 9/12, 0.750, 0.0170; Q: 9/12, 0.750, 0.0112; K: 8/12, 0.667, 0.0141; J: 8/12, 0.667, 0.0051; F: 8/12, 0.667, 0.0041; and H: 8/12, 0.667, 0.0069. 1
Sampling and analysis
From 27,702 bacterial species in the KBase Data Lakehouse pangenome collection kbase_ke_pangenome (kbase-ke-pangenome; tables pangenome, genome, gene, gene_cluster, gene_genecluster_junction and eggnog_mapper_annotations, supplying pangenome structure, genome metadata, gene-cluster membership and COG functional annotations), 457 had at least 50 genomes and 456 remained eligible after filtering for COG annotation coverage. A stratified random sample of 15 species was drawn, with 5 species per genome-count bin of 50–100, 100–200, and 200–300 genomes; two species experienced transient Spark S3 read errors, and Limisoma sp. had insufficient structure for valid clustering. 1
Clustering used PCA with up to 50 components followed by KMeans, searching k = 2–6 and selecting the best silhouette score; valid clusters required at least 2 ecotypes with at least 10 genomes each and at least 20 assigned genomes in total. Differential enrichment used 257 chi-square/Fisher’s exact tests with BH-FDR correction at alpha = 0.05. The generated datasets included 456 eligible species, 1,820 genome-to-ecotype assignments (data/ecotype_assignments.csv), 12 clustering-statistics records, 894 rows of COG category counts and fractions per ecotype per species (data/ecotype_cog_profiles.csv), and 257 COG differentiation-test results with FDR-corrected q-values (data/cog_differentiation_tests.csv). 1
The report’s figures are figures/cog_differentiation_rates.png, a horizontal bar chart of per-COG-category differentiation rates colored by adaptive (red), housekeeping (blue) or other (gray) grouping; figures/effect_size_distributions.png, a histogram comparing effect-size distributions for adaptive versus housekeeping COG categories; and figures/cog_differentiation_heatmap.png, a heatmap of -log10(q-value) across species x COG categories. 1
The report’s Literature Context cites secondary findings that are not direct results of this project: Gao et al. (2025) found source-specific enrichment of COG category L in Cronobacter sakazakii pangenomes; a core = housekeeping, accessory = adaptive/defense functional gradient was reported in single-species studies of Pasteurella multocida, Lactococcus garvieae, Mycobacterium bovis and Lysinibacillus boronitolerans (the cited title names strain MSR1); and Moulana et al. (2020) studied Sulfurovum ecotypes, as described above. The report presents its own contribution as showing that the gradient holds within ecotypes across 12 species. SAR86 and pipolins appear only in titles of cited papers, and the report establishes no findings about them. 1
Caveats and Limitations
- The analysis covered 12 species from a 15-species sample (80%), out of 456 eligible species; although the stratified sample represented pangenome-size bins, it may not capture broader phylogenetic or ecological diversity. 1
- KMeans was used because HDBSCAN was unavailable on the cluster; KMeans assumes spherical clusters and requires a selected k, whereas HDBSCAN could better handle variable-density subpopulations. 1
- Approximately 38% of gene clusters had COG annotations, leaving 62% unannotated; unannotated ecotype-specific adaptive genes may therefore be missed or the results may be biased toward better-characterized functions. 1
- Without within-species phylogenetic controls such as core-genome trees, the analysis cannot distinguish ecological adaptation from phylogenetic or demographic substructure. 1
- Effect sizes were small: the largest mean effects were 0.039 for S and 0.034 for L in the report’s rounded narrative, while the detailed table gives 0.0392 and 0.0337; these represent approximately 3–4 percentage-point differences in COG-category proportions, and statistical significance may partly reflect large sample sizes. 1
- Variable Spark query times of 94s–1642s during heavy cluster usage caused two species to be lost to S3 read errors. 1
Future Directions
The report proposes scaling the analysis to all 456 eligible species, overlaying core-genome phylogenetic trees on ecotype assignments, characterizing S-category genes with AlphaFold or domain analysis, integrating habitat metadata to test environmental associations, and comparing the KMeans results with HDBSCAN. 1
Slots Into
- ecotype-environment-gene-content — adds multi-species evidence that within-species gene-content ecotypes are widespread and functionally differentiated, while identifying phylogenetic control and environment metadata as unresolved tests. 1
- pangenome-integration — contributes a KBase Data Lakehouse pangenome analysis linking auxiliary gene-content clustering to COG functional differentiation across 12 species. 1
- multi-omics-integration — identifies unannotated ecotype-differentiating genes as a target for integrating functional annotation and protein-structure evidence. 1
- adaptive-versus-housekeeping-functional-differentiation — supplies the partial support for adaptive-over-housekeeping differentiation: a modest significance-rate contrast but larger adaptive effect sizes, plus per-category rates and effects. 1
- ecotype-clustering-validity — contributes per-species silhouettes, validity criteria, the overlapping-boundary interpretation and KMeans-versus-HDBSCAN limits. 1
- two-speed-bacterial-genome — the report ties category L prominence to the two-speed genome pattern, as a cross-project interpretation. 1
- horizontal-gene-transfer-driven-innovation — COG category L, which differentiated ecotypes in 9/12 species, includes transposases, integrases and mobile-element machinery; the report links this to horizontal transfer only as an interpretation, and the analysis does not show that these genes drive the measured differentiation. 1
- phylogenetic-confounding-of-pangenome-associations — without core-genome phylogenetic controls the ecotypes cannot be separated from demographic substructure. 1
- genomic-under-representation — only ~38% of gene clusters carried COG annotations, which may bias functional comparisons. 1
- research-attention-inequality — the large unknown-function (S) effect points to annotation gaps in niche-specific genes. 1
- ontology-and-category-schema-sensitivity — the result depends on the prespecified assignment of COG letters to adaptive versus housekeeping groups. 1
- sampling-depth-and-downsampling-effects — 12 valid species from a 15-species stratified sample of 456 eligible species limits phylogenetic and ecological representativeness. 1