The original ecotype analysis and its reanalysis give contrasting summaries of the environmental signal. The original reports a weak environmental signal overall. The reanalysis, run under a different pipeline, reports a median partial correlation of 0.081 1,2. A partial correlation measures the association between two variables after the influence of other variables is statistically removed. The disagreement matters for selection-on-outcome-leakage. A gap in magnitude between pipelines could be misread as evidence that one result was inflated or suppressed by selecting observations on the outcome being tested. The concept page instead frames the gap as a tension in measurement and sampling 1,2.
Evidence Sides
Side A: the environmental signal is weak overall
The original ecotype analysis reports a weak environmental signal overall 1,2. The TENSION text gives no threshold or summary statistic for this side beyond the qualitative description “weak”. No magnitude is stated here for it.
Side B: the reanalysis reports a median partial correlation under a different pipeline
The reanalysis reports a median partial correlation of 0.081 under a different pipeline 1,2. This figure is a median across the species analysed by that pipeline. It is not a per-species significance threshold. The TENSION text does not state the denominator or the proportion of species with significant effects.
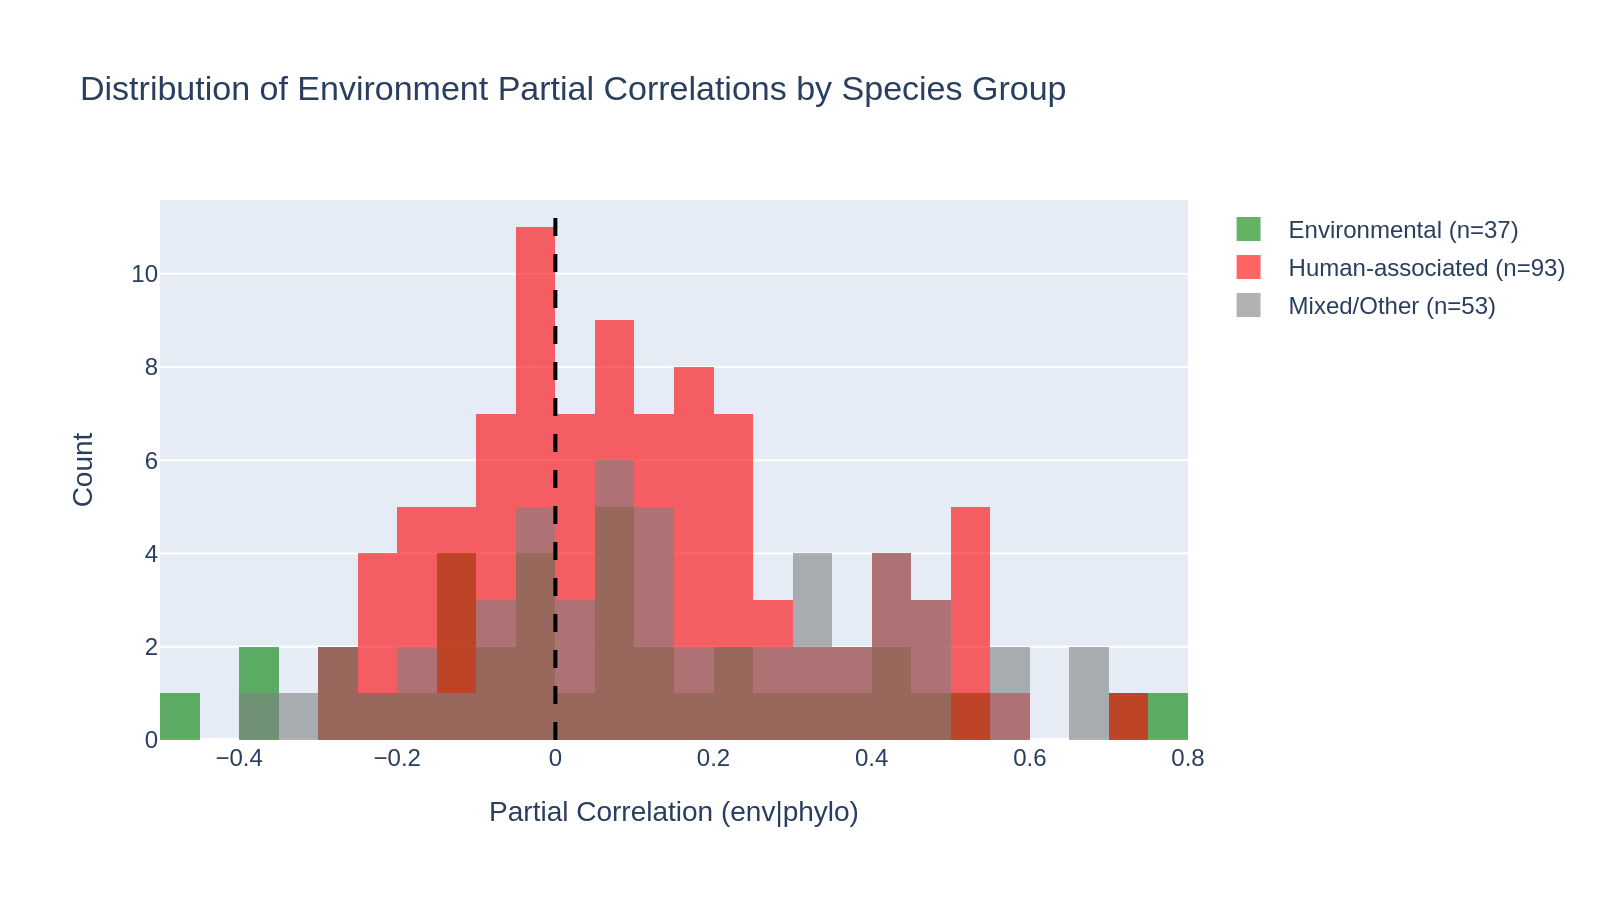 Distribution of partial correlations. From ecotype_env_reanalysis.
How the concept page reads the pair
The concept page treats this contrast as one that supports reading cross-pipeline magnitude comparisons as a tension in measurement and sampling, rather than as evidence that leakage caused either result 1,2. Neither side is preferred, and the magnitudes are not averaged.
Possible Reconciliations
- Hypothesis 1 (pipeline definitions): The pipelines may define “environment” or “gene content” differently. Under that hypothesis, the medians estimate different quantities and are not directly comparable.
- Hypothesis 2 (species sampling): The pipelines may include different species sets. A shift in which species enter the median could move the summary without any change in the per-species biology.
- Hypothesis 3 (phylogenetic control): The pipelines may remove phylogenetic signal differently. If so, the partial correlations would condition on different covariates.
- Hypothesis 4 (summary choice): “Weak overall” and a median of 0.081 may not conflict at all. A small median can coexist with a weak overall signal, depending on the reference scale each report uses.
Resolving Work
- Shared species set: Recompute both pipelines’ partial correlations on the intersection of species they each cover. This tests whether the difference in magnitude persists when sampling is held fixed.
- Swapping one component at a time: Swap the environmental-distance definition, then the gene-content distance, then the phylogenetic covariate, applying each change to the shared species set. This tests which methodological change accounts for the shift in the median.
- Leakage check: Check whether either pipeline groups or filters species using environmental or gene-content features that are later tested. This tests whether selection-on-outcome leakage contributes at all, or whether the gap is purely one of measurement.
- Full distributions: Report each pipeline’s full per-species distribution with matched significance criteria and multiple-testing correction. This tests whether “weak overall” and the reanalysis median describe the same distribution summarised differently.