Raw report: bacdive_phenotype_metal_tolerance Feeds into: adversarial-research-quality-assurance, callability-limited-comparative-inference, composite-resistance-score-limitations, confirmatory-exploratory-ecological-association-discordance, cross-tenant-data-bridging, environmental-resistome, metal-cross-resistance, pangenome-integration, phenotype-database-coverage-bias, phylogenetic-confounding-of-pangenome-associations, research-attention-inequality, sample-size-aware-phenotype-consensus, selection-on-outcome-leakage, taxonomic-nomenclature-reconciliation
Overview
This study links bacdive phenotypes to genome-based metal tolerance scores from the metal-fitness-atlas. It tests whether classical microbiology features independently predict metal tolerance or mainly reflect phylogenetic structure. The bridge contains 97,334 BacDive strains. Of these, 37,368 (38.4%) match a pangenome species and a metal score, representing 5,647 unique gtdb (Genome Taxonomy Database) species; 3,994 of those species have at least 5 phenotype features. Ten phenotype features were tested (8 binary, 2 continuous). Seven of the 10 were significant after FDR (false discovery rate, the expected share of false positives among significant calls) correction. 1
The BacDive collection supplied phenotype features for the 97K strains from its strain, physiology, metabolite-utilization, enzyme, isolation, taxonomy and sequence-information tables. The kbase-ke-pangenome collection supplied, via Metal Fitness Atlas scores, genome-based metal-tolerance predictions for 27,702 species. The kescience-fitnessbrowser collection supplied organism mapping and metal-experiment metadata for 12 direct Fitness Browser–BacDive organism matches. 1
Key Findings
Phenotype associations
Gram-negative species had higher metal tolerance scores than Gram-positive species (cohens d, a standardized mean difference: d = -0.61, p < 1e-60, n = 3,272 species). This was the largest effect among the tested phenotype features. Class-stratified analysis could not test the association within taxonomic classes, because the signal is almost entirely between lineages, especially Gram-positive Actinomycetes versus Gram-negative Proteobacteria. The data contain no Gram-positive Proteobacteria and no Gram-negative Actinomycetes, so in a predictive model the Gram-stain effect cannot be told apart from “being a Proteobacterium”. The association is mechanistically plausible, since the Gram-negative outer membrane can restrict metal-cation uptake, but it is statistically confounded with phylogeny. 1
Seven features passed FDR correction at q < 0.05: Gram stain, oxidase, motility, urease, enzyme breadth, nitrate reduction and catalase. Three did not: H₂S production, metabolite breadth and acetate utilization. The H₂S estimate is unreliable because there were only 8 negative controls, and it is likely inflated by small-sample bias. 1
- Gram stain (+): d = -0.610, n = 3,272, p = 4.0e-61, q = 4.0e-60 (significant). 1
- Oxidase (+): d = +0.530, n = 1,799, p = 2.7e-25, q = 1.3e-24 (significant). 1
- Motility: d = +0.345, n = 3,138, p = 2.2e-23, q = 7.2e-23 (significant). 1
- Urease (+): d = -0.175, n = 3,035, p = 3.7e-06, q = 9.1e-06 (significant). 1
- Enzyme breadth: rho = -0.058, n = 3,746, p = 4.1e-04, q = 8.2e-04 (significant). 1
- Nitrate reduction: d = +0.100, n = 3,088, p = 4.4e-03, q = 7.4e-03 (significant). 1
- Catalase (+): d = +0.104, n = 2,930, p = 2.8e-02, q = 4.1e-02 (significant but marginal; see the within-class reversal below). 1
- H₂S production: d = -0.867, n = 880, p = 5.8e-02, q = 7.3e-02 (not significant). 1
- Metabolite breadth: rho = -0.013, n = 3,930, p = 4.2e-01, q = 4.7e-01 (not significant). 1
- Acetate utilization: d = +0.005, n = 422, p = 7.9e-01, q = 7.9e-01 (not significant). 1
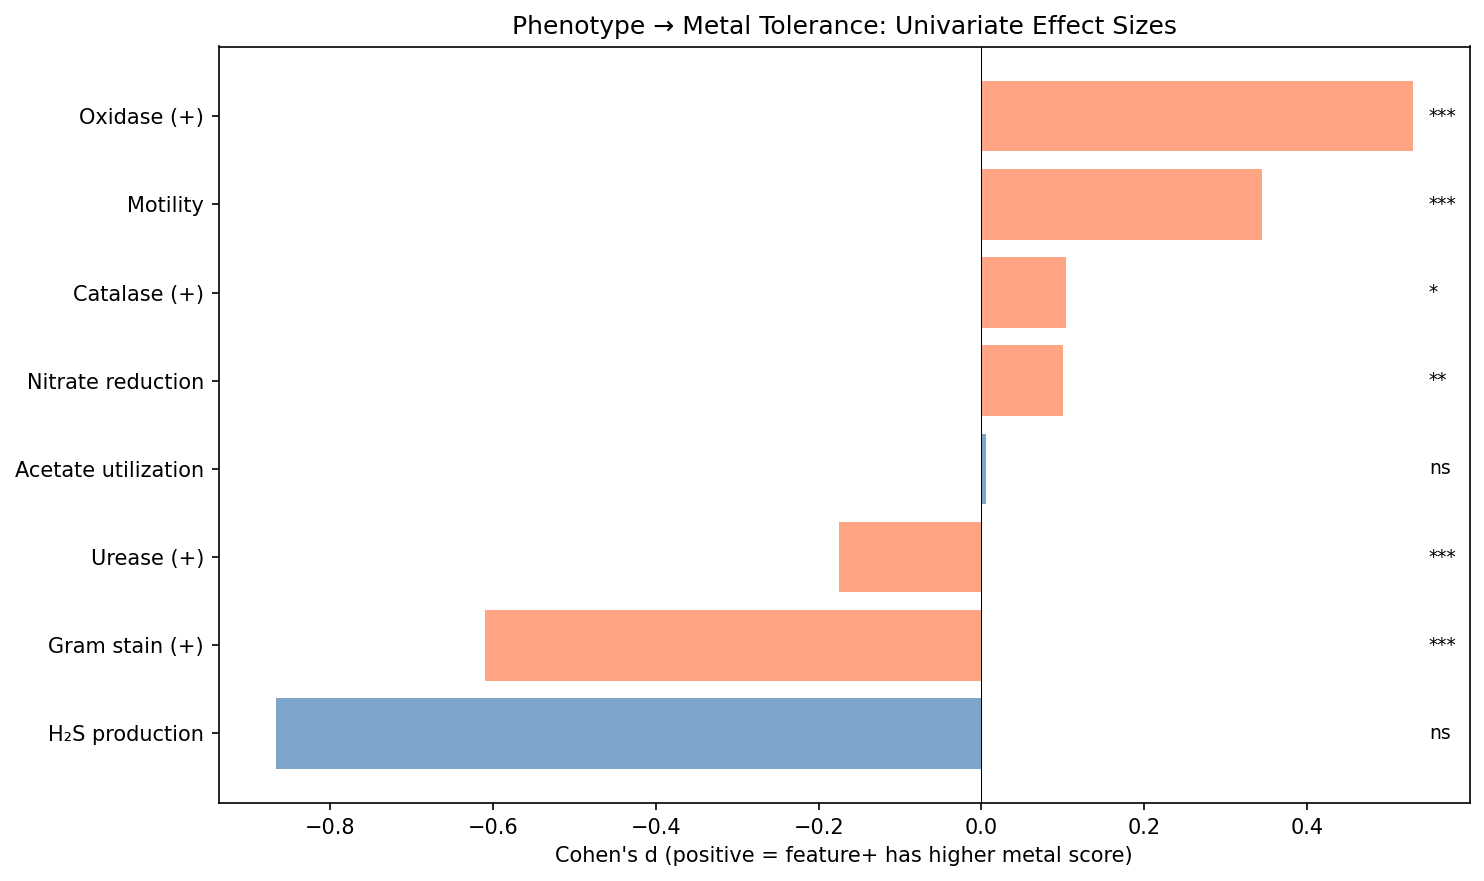 Univariate effect sizes. From bacdive_phenotype_metal_tolerance.
Urease-positive species had lower metal tolerance scores (d = -0.18, p < 1e-5). This is the opposite of the prediction that urease positivity, which requires nickel import machinery, would confer nickel tolerance. The effect was driven by Actinomycetes (d = -0.59, p < 1e-16), where urease-positive species form a distinct low-metal-score subgroup. It disappeared within Gammaproteobacteria (d = +0.08, ns) and Bacilli (d = +0.06, ns), which is further evidence of phylogenetic confounding. The report reads the reversal as a lineage-composition effect, not as evidence about nickel-specific tolerance. In this reading, urease positivity correlates with Actinomycetes and other lineages that carry fewer metal resistance genes overall. Urease-associated nickel handling is narrowly nickel-specific, not a broad tolerance mechanism. 1
The anaerobe–aerobe difference was negligible (d = -0.016, p = 0.55) among 3,751 species with oxygen-tolerance data. Facultative anaerobes had the highest mean score (0.221), compared with aerobes (0.216) and anaerobes (0.215). The three-group kruskal-wallis-test was marginally significant (H = 8.53, p = 0.014), but the report judges the effect biologically trivial. 1
Catalase showed a Simpson’s-paradox pattern. The overall association was positive (d = +0.10), marginally supporting H1d. Within classes, however, catalase-negative species scored higher: in Actinomycetes (d = -0.62, p < 1e-5), Gammaproteobacteria (d = -0.49, p = 0.004) and Betaproteobacteria (d = -0.51, p = 0.006). The report attributes the overall positive association to between-class composition, because the catalase-positive classes (Proteobacteria) happen to have higher metal scores. This mirrors the urease pattern. 1
The hypothesis that metabolically versatile organisms carry more resistance genes was not supported: metabolite-utilization breadth showed no correlation with metal score (rho = -0.01). The report suggests that metabolic versatility operates in different genomic neighborhoods than metal resistance, but this is an interpretation and was not directly tested. 1
Predictive models and phylogenetic confounding
Taxonomy alone (phylum/class/order) explained 35.4% of metal tolerance variance, and phenotype features alone explained 16.3%. Combining taxonomy and phenotype gave R² = 34.5%, slightly worse than taxonomy alone. The report gives this change as delta R² = -0.009 and concludes that phylogenetic structure captures the whole phenotype signal. Adding the number of metal resistance gene clusters (n_metal_clusters) raised the full model to R² = 0.63. 1
| Model (5-fold phylogenetic-blocked CV) | R² | RMSE | n | Features |
|---|---|---|---|---|
| Gene count only | 0.063 | 0.045 | 3,994 | 1 |
| Phenotype only | 0.163 | 0.043 | 3,994 | 13 |
| Taxonomy only | 0.354 | 0.038 | 3,994 | 3 |
| Taxonomy + Phenotype | 0.345 | 0.038 | 3,994 | 16 |
| Full (all combined) | 0.633 | 0.028 | 3,994 | 17 |
| Source | src: [[sources/bacdive_phenotype_metal_tolerance | bacdive_phenotype_metal_tolerance]] |
The report contradicts itself on gene count. In its 5-fold phylogenetic-blocked cross-validation (n = 3,994), R² was 0.063 for gene count alone, 0.163 for phenotypes alone, 0.354 for taxonomy alone, 0.345 for taxonomy plus phenotypes and 0.633 for the full model. Yet the narrative says that genome metal-resistance gene content (n_metal_clusters) explains more variance than all phenotype features combined and is “the true predictor”. The report credits gene count with most of the full model’s R² = 0.63 and its delta R² = +0.28 over taxonomy alone. The evidence supports gene count as adding substantial information to taxonomy in the full model. It does not show gene count to be a stronger standalone predictor than phenotypes. The report also cites Schwan et al. (2023), who found genotype–phenotype concordance for metal resistance genes in Salmonella and E. coli, as consistent with its result. 1
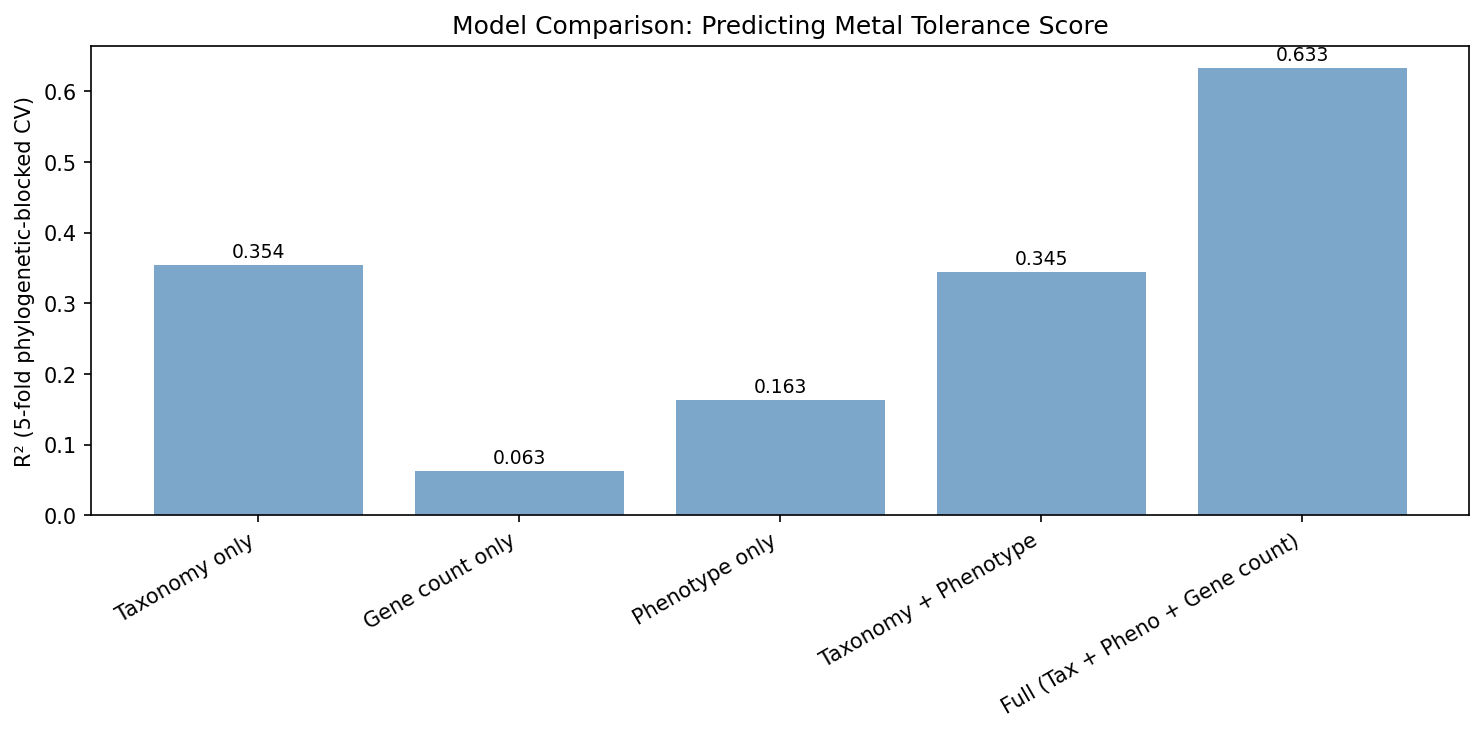 Model comparison. From bacdive_phenotype_metal_tolerance.
SHAP (Shapley additive explanation) feature importance from the full xgboost model placed taxonomic class/order codes and n_metal_clusters among the top predictors. Phenotype features contributed minimally to individual predictions once taxonomy was included. The report takes this to mean that the measured phenotypes are phylogenetic proxies, not independent predictors of the composite metal tolerance score. 1
Data coverage and direct validation
The analysis covered 97,334 BacDive strains, 37,368 matched strains (38.4%), 5,647 unique GTDB species, 3,994 species with at least 5 phenotype features, 10 tested phenotype features and 9 taxonomic classes with at least 50 species. Coverage varied sharply by feature. BacDive strain counts ran from 43,378 with isolation-source data and 29,784 with metabolite-breadth data down to 5,254 with H₂S-production data and 1,980 with acetate-utilization data. Matched strains ranged from 22,581 to 475, and species with metal scores ranged from 4,531 (isolation source) to 422 (acetate utilization). 1
The direct Fitness Browser–BacDive validation matched 12 organisms by taxonomy ID, representing 6 unique species: Cupriavidus basilensis, methanococcus-maripaludis, ralstonia solanacearum, Pseudomonas simiae, azospirillum-brasilense and pseudomonas-fluorescens. All Gram-typed organisms were Gram-negative, which prevented within-set testing of the strongest association. All urease-typed organisms were urease-negative, yet they are routinely tested against nickel; the report treats this as consistent with the pangenome-scale finding that urease status does not predict metal tolerance. The single anaerobe, Methanococcus maripaludis, had only 1 metal tested versus 4–5 for aerobes, and n = 1 is not interpretable. 1
The study’s hypothesis outcomes were as follows. H1a, that Gram-negative species score higher, was supported univariately but phylogenetically confounded. H1b, that anaerobes better tolerate redox metals, was not supported (d = -0.02, ns). H1c, that broader metabolism predicts higher scores, was not supported (rho = -0.01, ns). H1d, that catalase-positive organisms better tolerate selected redox metals, was marginally supported (d = +0.10, q = 0.04). H1e, that urease-positive organisms better tolerate nickel, was reversed (d = -0.18) and driven by Actinomycetes. H1f, that H₂S producers better tolerate Zn, Cu and Cd, was unreliable: with only 8 negative controls, the effect estimate is likely inflated by small-sample bias. 1
Figures
univariate_effect_sizes.png: univariate phenotype effect sizes. 1model_comparison.png: comparison of the predictive models. 1feature_completeness.png: phenotype-feature completeness. 1shap_summary.png: SHAP feature importance from the full XGBoost model. 1coverage_waterfall.png: coverage from BacDive to matched strains to species. 1fb_bacdive_phenotype_table.png: BacDive phenotypes for the 12 Fitness Browser-matched organisms. 1
Caveats
The Metal Fitness Atlas scores are genome-based predictions rather than direct metal-tolerance measurements. Controlling for n_metal_clusters in partial correlations only mitigates circular reasoning. The tested associations remain phenotype-to-genome correlations rather than phenotype-to-phenotype measurements. 1
The report says BacDive species-name matching achieved 38.4%, citing 5,647 of 27,702 GTDB species. That percentage is inconsistent with the stated species numerator and denominator. The report uses the same 38.4% elsewhere for 37,368 matched strains out of 97,334 BacDive strains, which suggests that the strain-level rate was carried over to the species-level count. The report does not give a correct species-level rate. GCA accession matching was not implemented. The report proposes that it could recover 10–30% more species, but that gain is prospective, not measured. 1
Erratum. The report gives 38.4% for two different denominators. 37,368 of 97,334 matched strains is 38.4%; 5,647 of 27,702 GTDB species, the figure this sentence uses, is about one fifth, roughly half what the percentage suggests. 1
The 12-organism direct validation was underpowered: all Gram-typed organisms were Gram-negative, which prevented within-set testing of H1a. 1
BacDive testing is biased toward well-studied organisms such as Pseudomonas and Escherichia coli, which have many phenotype tests. Poorly studied species have sparse data. 1
The H₂S result is underpowered because only 8 H₂S-negative species were present in the matched set. Its d = -0.87 is therefore unreliable and likely inflated by small-sample bias. The H₂S–chalcophilic-metal link remains a hypothesis; the report proposes testing it experimentally with sulfate-reducing bacteria under zinc/copper challenge. 1
The composite-score analysis does not establish metal-specific mechanisms. Testing whether particular phenotypes predict tolerance to particular metals (for example catalase and copper, urease and nickel, or H₂S and zinc, copper and cadmium) would require per-metal scores for the 27K species. 1
The analysis used only measured BacDive phenotype values. Adding BacDive’s machine-learning-predicted Gram stain, motility and oxygen tolerance could increase coverage substantially, but would introduce model-dependent bias. 1
Whether urease-positive organisms are specifically nickel-tolerant, rather than generally metal-tolerant, remains unresolved. The proposed test is per-metal fitness profiling of urease-positive versus urease-negative bacteria from the same taxonomic class. Gammaproteobacteria are the preferred class, because there the pangenome-scale urease effect is near zero. RB-TnSeq (random barcode transposon sequencing, a pooled mutant-fitness assay; see tnseq) of matched urease+/- strains under nickel versus other metals would test this directly. 1
Other suggested follow-up includes GCA accession matching. It also includes phylogenetic-generalized-least-squares (PGLS, a regression that models phylogenetic non-independence) or phylogenetic PCA, to formally remove phylogenetic signal before testing phenotype–metal associations. 1
Slots Into
- phylogenetic-confounding-of-pangenome-associations: the Gram stain, urease and catalase associations are between-lineage or reverse within classes. Taxonomy plus phenotype (R² = 0.345) does no better than taxonomy alone (R² = 0.354). 1
- composite-resistance-score-limitations: associations between phenotypes and the composite genome-based score cannot show metal-specific mechanisms, so per-metal scores are needed. 1
- confirmatory-exploratory-ecological-association-discordance: the oxygen, metabolite-breadth and acetate nulls, together with the reversed urease prediction, show plausible mechanistic hypotheses failing at scale. 1
- phenotype-database-coverage-bias: species coverage ranges from 4,531 to 422 across features, and BacDive testing is biased toward well-studied organisms. 1
- adversarial-research-quality-assurance: the report’s narrative claim about gene count conflicts with its own table (0.063 versus 0.163), and it reuses the 38.4% figure for an inconsistent species denominator. 1
- callability-limited-comparative-inference: in the 12-organism direct validation, all Gram-typed organisms are Gram-negative and all urease-typed organisms are urease-negative, so the key contrasts cannot be tested within the set. 1
- cross-tenant-data-bridging: the BacDive-to-pangenome bridge matched 37,368 strains by species name and left accession-based matching unimplemented. 1
- taxonomic-nomenclature-reconciliation: name-based species matching limits the linkable set. 1
- selection-on-outcome-leakage: the outcome is a genome-based score, so controlling for
n_metal_clustersonly mitigates circularity. 1 - research-attention-inequality: BacDive phenotype tests concentrate on well-studied organisms such as Pseudomonas and E. coli. 1
- metal-cross-resistance: the proposed urease+/- RB-TnSeq comparison under nickel versus other metals would separate nickel-specific from general metal tolerance. 1
- environmental-resistome: adding
n_metal_clustersto taxonomy and phenotypes raised the full model to R² = 0.633, linking genome-encoded resistance repertoire to the score. The gene-count-only model (R² = 0.063) was still weaker than phenotype only (R² = 0.163). 1 - pangenome-integration: the BacDive-to-pangenome bridge matched 37,368 strains (38.4%) and enabled species-level integration of phenotypes and metal scores across 5,647 GTDB species. 1
- condition-specific-fitness: the proposed per-metal analyses and matched-strain nickel experiments address whether phenotypes predict metal-specific rather than composite tolerance. 1