A pangenome is the full set of gene clusters across the genomes of a species 1,2. Its core is the conserved component. Some projects define it as ≥95% prevalence 3,4, and another as majority presence within a species clade 5. Auxiliary (accessory) genes vary between genomes 6. Most evidence here comes from the KBase Data Lakehouse pangenomes. Several analyses join these to Fitness Browser fitness data, GTDB (Genome Taxonomy Database) phylogeny and environmental metadata 7,6,8. The corpus covers four questions:
- which functions sit in the conserved core and which in the variable genome;
- how new genes arrive;
- what makes some pangenomes more open, meaning more gene-rich as more genomes are sampled;
- how sampling and shared ancestry distort all of these measurements.
Literature Context
The pangenome concept describes a bacterial species as a “core genome” of genes present in all strains plus a “dispensable genome” of genes shared by two or more strains or unique to single strains. Mathematical modelling predicted that new genes would keep appearing even after hundreds of genomes per species were sequenced PMID 16185861. In the founding empirical case, six newly sequenced Streptococcus agalactiae strains were analysed together with genomes available in databases. The core accounted for approximately 80% of any single genome, and the authors extrapolated a vast gene reservoir PMID 16172379. That figure comes from one pathogenic species. A later review attributes pangenomes to horizontal gene transfer (HGT, the movement of genes between lineages) and differential gene loss. It highlights conflict between host chromosomes and the mobile genetic elements that mediate exchange, and it calls current understanding “phenomenological and incomplete” PMID 31639358. Automated annotation errors from fragmented assemblies, contamination and mis-assemblies accumulate across a population and distort pangenome analyses PMID 32698896. Clustering tools also perform differently depending on input genome composition PMID 32893299.
This corpus is largely consistent with the classical picture and extends it across many species. Novel genes are enriched in mobile-element and defense functions and core genes in translation, which fits the review’s emphasis on mobile genetic elements as drivers of accessory content PMID 31639358. Two further results fit the same emphasis. Costly, dispensable genes were 7.45× more likely than costly+conserved genes to carry mobile-element keywords. In addition, 21.8% of high-quality MAGs (metagenome-assembled genomes, reconstructed from environmental DNA) carried T4SS (type IV secretion system) or conjugative machinery. Neither result establishes a transfer mechanism. Photosystem II, the best-supported cross-clade innovation, showed no mobile-element cargo enrichment, which limits how far the mobile-element explanation generalises. The 82.0% core share among Fitness Browser gene-to-cluster links sits near the approximately 80% reported for S. agalactiae PMID 16172379. The two figures measure different things: linked fitness genes in one case, a per-genome fraction in the other.
The corpus is in tension with the literature over the definition of “core”. The founding papers define the core as genes present in all strains PMID 16185861, PMID 31639358. Corpus projects instead use ≥95% prevalence or majority presence, and they show that a 2-genome clade makes shared genes trivially core. This extends the methodological caution in the tool literature PMID 32698896, PMID 32893299 from annotation and clustering error to sampling and clade-size bias. It also extends that caution to identifier-join failures such as the 0% Dyella79 join. These issues are documented on pangenome-core-boundary-and-clade-size-bias.
The corpus’s openness results are comparatively novel. Variable GapMind pathways predicted openness at partial rho=0.530 after controlling for genome count. That adjustment is not full phylogenetic correction, so residual phylogenetic confounding remains possible. Separately, openness did not predict environment or phylogeny effects, but that null came from a different predictor set and is not an equivalent test. One commentary reports that the presence of almost one-third of genes can be reliably inferred by machine learning PMID 38580497. That report summarises another study and does not address metabolic mechanism, so the corpus’s metabolic link remains a hypothesis (pangenome-openness-determinants).
What the Corpus Shows
A two-speed genome, with leaks in both directions. Clusters of Orthologous Groups (COG) assigns genes to broad functional categories. Across 32 species spanning 9 phyla and 357,623 genes, novel or singleton genes were enriched in COG L, the mobile-element category, by +10.88% with 100% consistency. They were also enriched in COG V (defense) by +2.83% 9. Core genes were enriched in translation (COG J) and in other metabolic categories. The report gives the COG J value as -4.65% in its novel-versus-core contrast, with 97% consistency, and does not state its sign convention explicitly 9. The report reads this pattern as a conserved metabolic engine alongside a variable layer of mobile, defense and unknown functions. That is the model described on two-speed-bacterial-genome 9.
Antimicrobial resistance (AMR) genes support the accessory side of the model, though not cleanly. Only 30.3% of AMR clusters were core, against a 46.8% baseline, yet intrinsic resistance genes such as ampC are described as core residents 10. Metal fitness genes lean the other way, but they are a fitness-defined cohort rather than a pangenome-wide cluster set. Across 22 organisms and 14 metals, metal-important genes were 87.4% core versus 76.9% for baseline genes (odds ratio, OR=2.08, p=4.3e-162) 11. Species still diverge in aggregate metal-tolerance capacity. This is the layered model of within-species-conservation-between-species-functional-divergence 12.
Novelty is tied to mobile elements, but the route is rarely identified. Horizontal gene transfer (HGT) is the movement of genes between lineages. Several lines of evidence, collected on horizontal-gene-transfer-driven-innovation, support the hypothesis that HGT drives novelty. None of them establishes causation 9,13:
- Costly and dispensable genes. These genes impose a laboratory fitness cost and are not conserved across the species. They were 7.45× more likely than costly+conserved genes to carry mobile-element keywords (OR=7.45, p=4.6e-71) 13.
- Conjugative machinery in environmental genomes. Metagenome-assembled genomes (MAGs) are genomes reconstructed from environmental DNA. Among 30,497 high-quality MAGs, 6,652 (21.8%) carried T4SS (type IV secretion system) or conjugative machinery 14.
- Gene-tree evidence. The GT2 glycosyltransferase gene tree showed 77 detected HGT events, including 32 normalized high-confidence cross-phylum events 14.
chromosomal-and-integrative-gene-transfer reads these data as supporting a possible chromosomal or integrative route 14. ICEfinder did not detect CAZy (carbohydrate-active enzyme) genes on plasmids, but that is a database- and detection-dependent negative 14. The T4SS-mediated mechanism remains an observational hypothesis 14.
Acquisition depth gives each function class a recognisable signature. Sankoff parsimony infers the minimum set of state changes on a tree. It assigned 17,073,194 gain events across an 18,989-species GTDB tree 8. Gains were binned by recipient rank, from recent (genus-level gain) to ancient (phylum-or-above); they are not dated acquisition events 8:
| Function class | Recent-to-ancient ratio |
|---|---|
| CRISPR-Cas (an adaptive anti-phage defense system) | 24.5× src: [[summaries/gene_function_ecological_agora |
| β-lactamases | 9.0× src: [[summaries/gene_function_ecological_agora |
| Strict tRNA synthetases (housekeeping control) | 2.3× src: [[summaries/gene_function_ecological_agora |
8. The method locates where a gain landed on the tree, not who donated the gene. These ratios therefore describe recipient-side gains, not transfer flows 8. See gene-function-acquisition-depth.
“Core” is a measurement, not a biological fact. Of 177,863 Fitness Browser gene-to-cluster links, 82.0% fell in core clusters 6. Essential genes were 86.1% core versus 81.2% for non-essential genes, with a median odds ratio of 1.56 6. Across approximately 194,000 genes the gradient ran from 82% core (essential) to 66% core (always-neutral). Fitness breadth was only weakly associated with core status (Spearman rho=0.086, p=8.1e-230) 15.
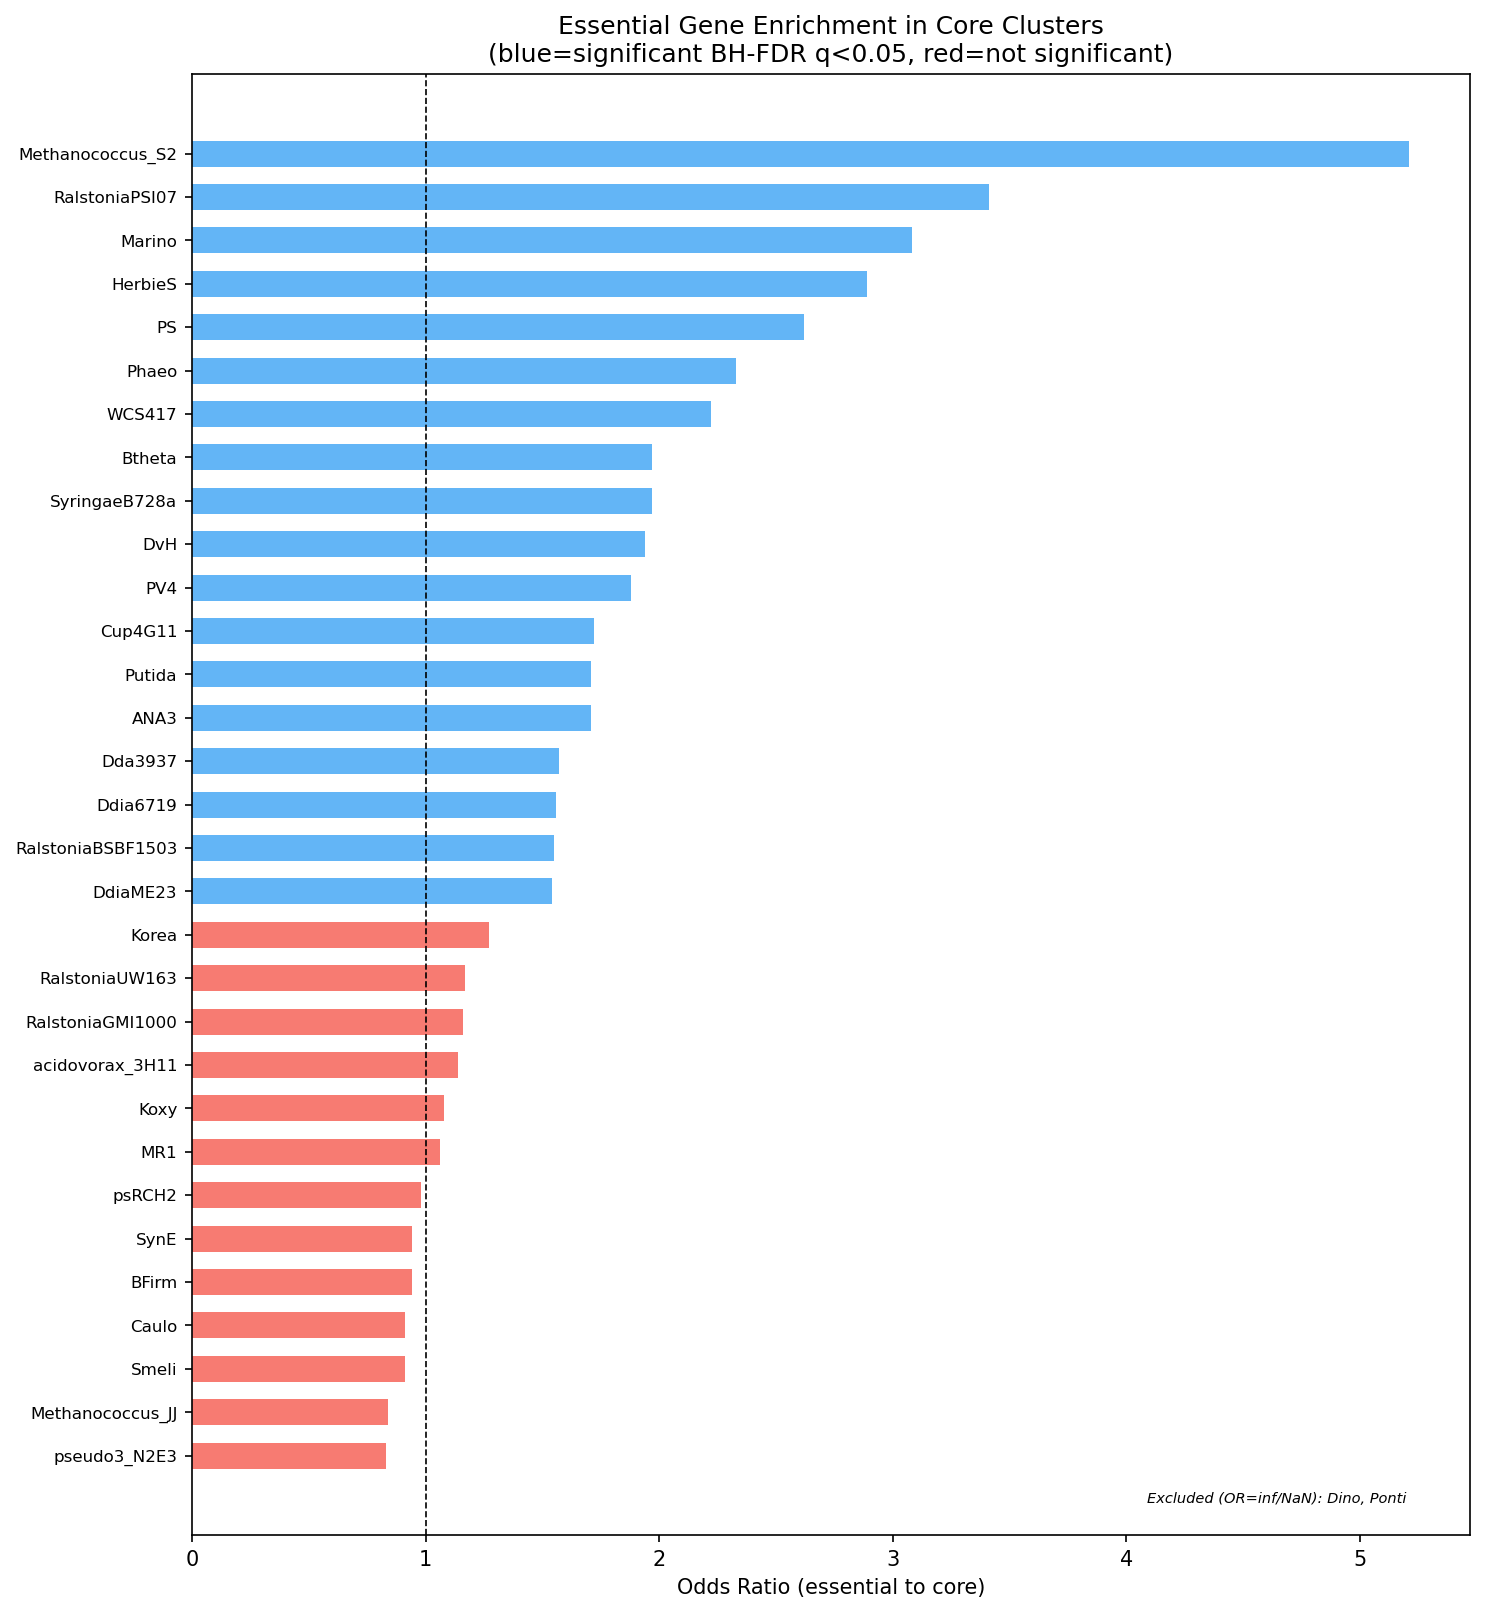 Essential vs Core Forest Plot. From conservation_vs_fitness.
Clade size is one reason the core label is unstable. In a 2-genome clade, any gene present in both genomes is trivially 100% core 6. pangenome-core-boundary-and-clade-size-bias and pangenome-integration document how clade sampling, join coverage and identifier mismatches shape the core label. For example, the Dyella79 locus-tag mismatch produced a 0% join rate 6.
Openness tracks metabolic variability; the environment null is a different test. Openness did not predict the environment effect (rho=-0.05, p=0.54) or the phylogeny effect (rho=0.03, p=0.73) on gene content 16. A separate analysis covered 2,810 GTDB species with at least 10 genomes and used 80 GapMind pathways. It defined variable pathways as those present in 10-90% of genomes, and openness as the fraction of accessory gene clusters 17. Variable pathways predicted openness at rho=0.327 (p=7.2e-71). The correlation rose to partial rho=0.530 (p=2.83e-203) after controlling for genome count 18,17. That adjustment is not full phylogenetic correction, so residual phylogenetic confounding remains possible 17. Niche breadth, measured as AlphaEarth embedding diversity across 1,872 species, also correlated with openness (r=0.324, p=5.6e-47) 18. These analyses used different predictor sets and are not equivalent tests 18. pangenome-openness-determinants treats the metabolic link as a hypothesis, not a demonstrated cause 17.
Pooled nulls can hide lineage-level signal. Pooled across species, openness correlated with AMR count at only rho=0.006. Within phyla, however, the correlation was positive in 8/10 phyla, for example Bacillota (rho=0.219, p=1.0e-16) 10. Within species, 55.6% of 1,261 species showed significant correlation between ANI (average nucleotide identity) distance and AMR-content distance at FDR (false discovery rate) < 0.05 19. phylogenetic-confounding-of-pangenome-associations therefore requires lineage-aware tests before any pangenome association is attributed to environment.
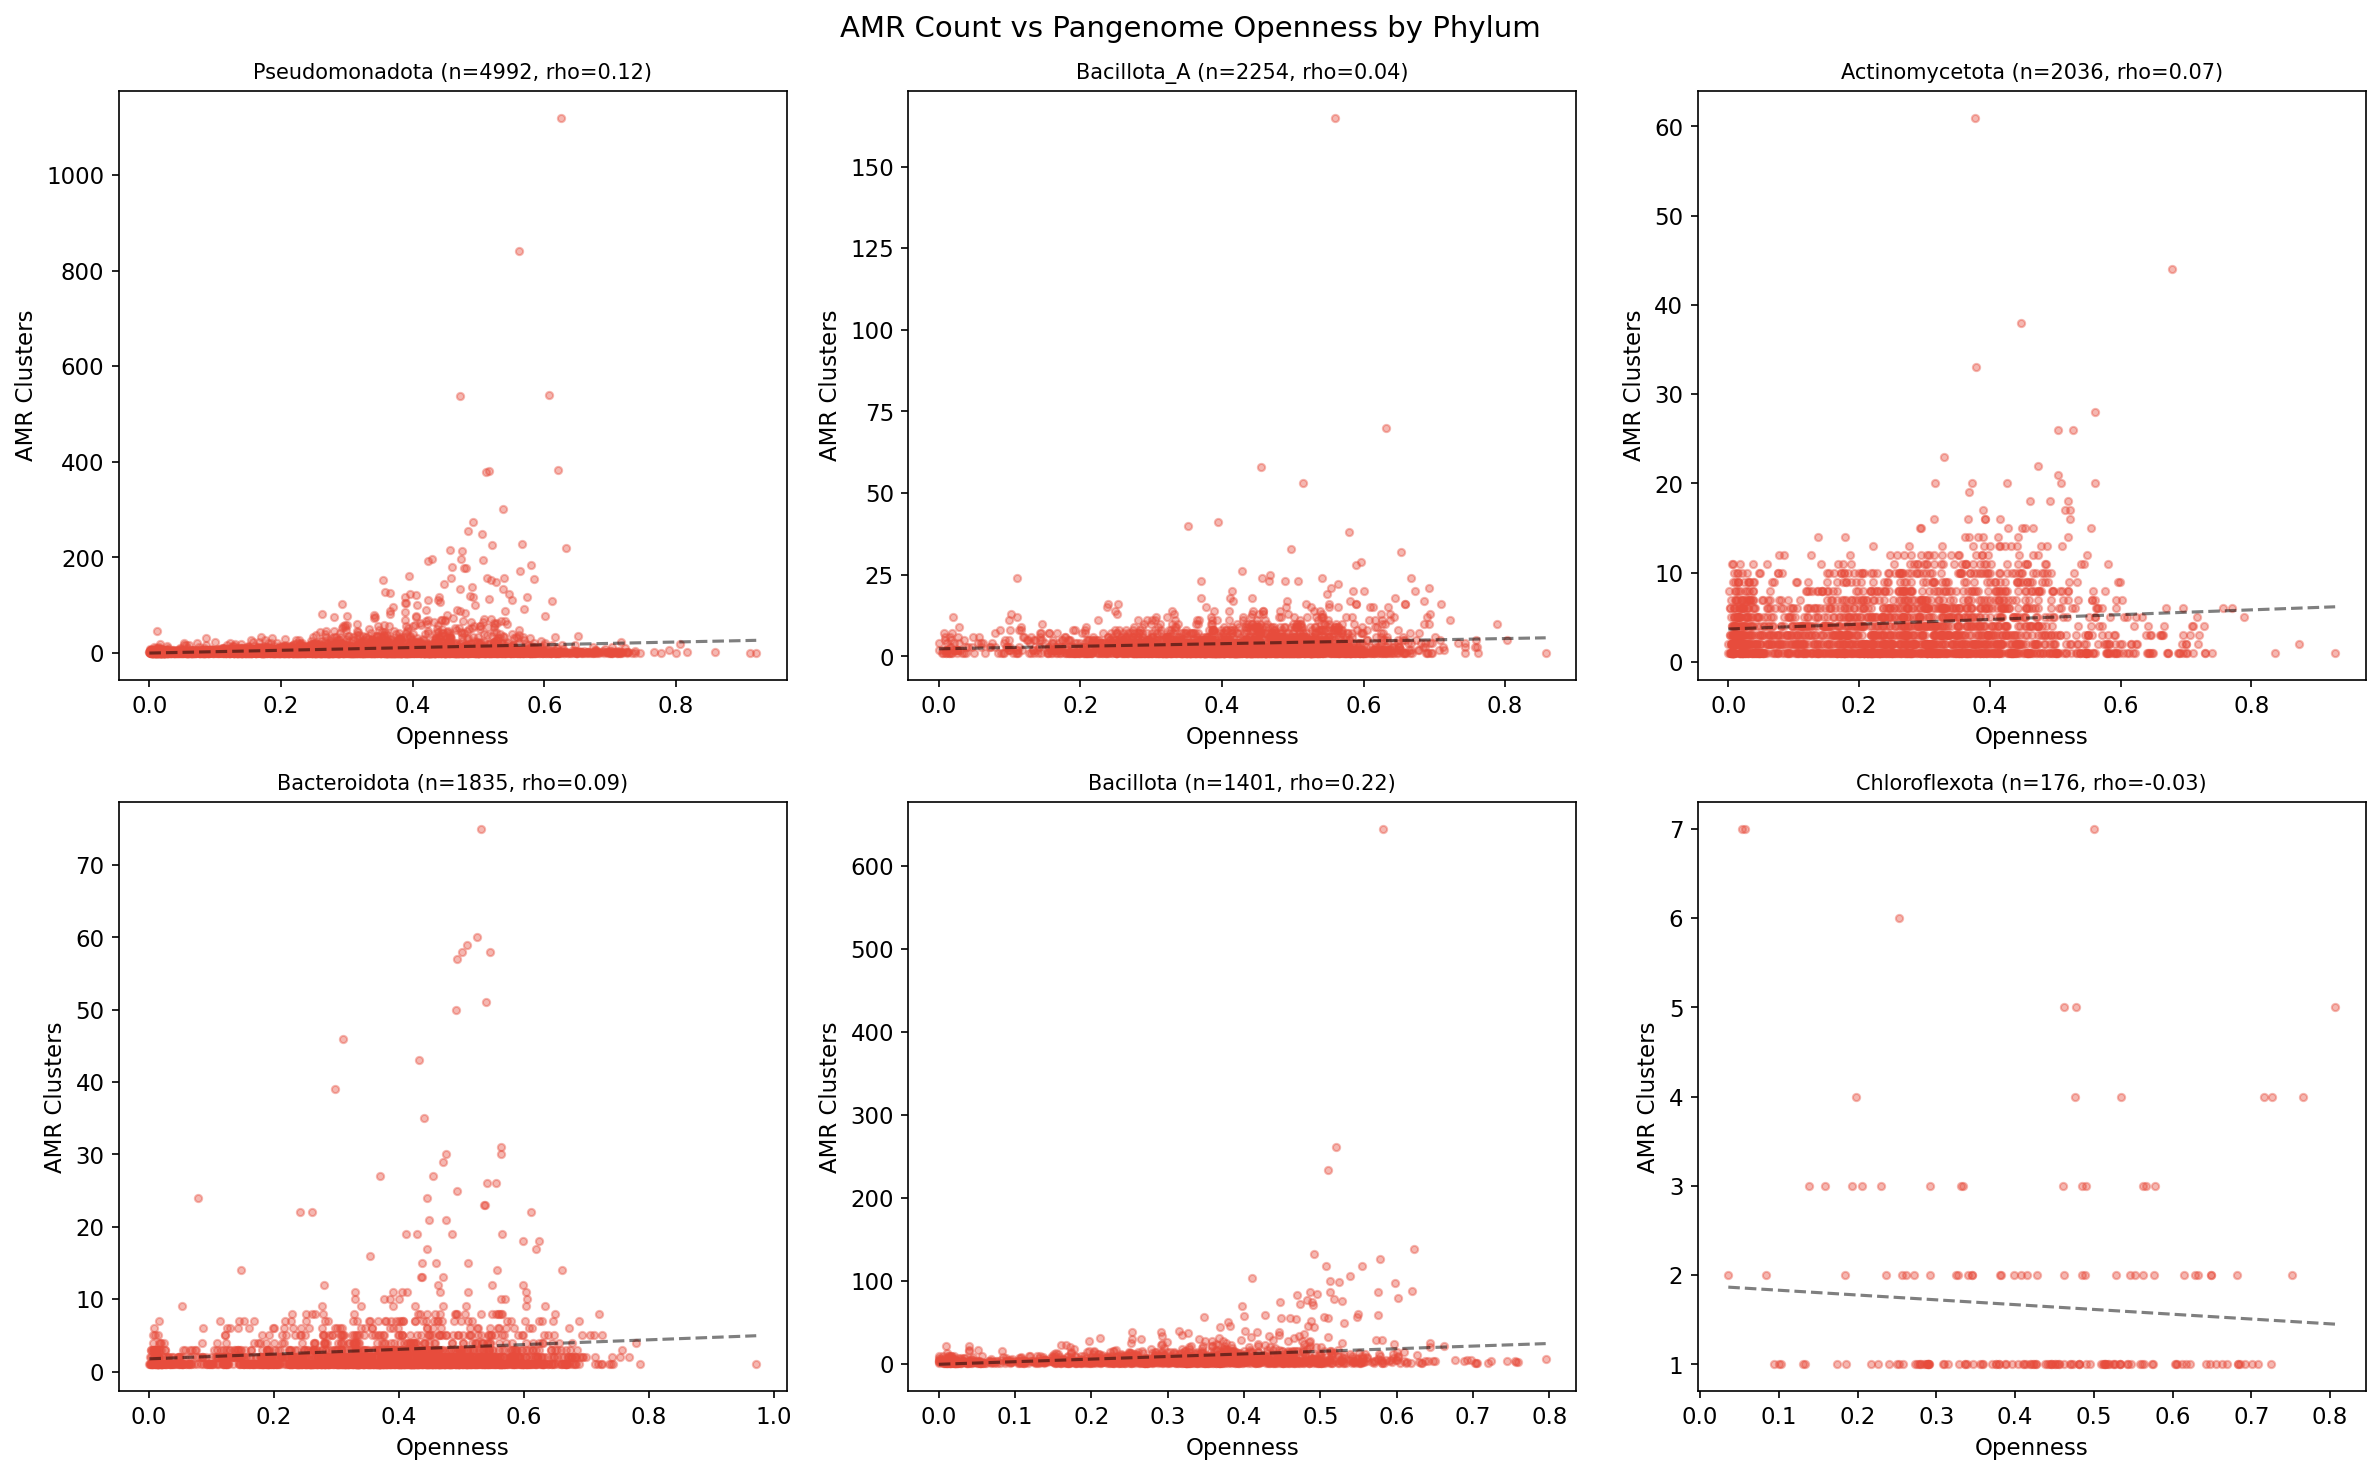 AMR vs pangenome openness by phylum. From amr_pangenome_atlas.
Tensions and Caveats
How much novelty mobile elements carry. The COG report suggests, as a hypothesis, that most genomic novelty comes from mobile elements 9. The costly-gene report proposes HGT-mediated expansion as the primary source of costly non-conserved genes 13. Yet the best-supported cross-clade innovation, photosystem II, showed no MGE-cargo enrichment, where MGE means mobile genetic element 8. See conflicts/conflict—horizontal-gene-transfer-driven-innovation—60dc31ce.
Plant-growth-promoting traits. One project reads PGP traits as vertically inherited core genes. Another finds them co-occurring with transposases 20,1. See conflicts/conflict—horizontal-gene-transfer-driven-innovation—9137941d.
The housekeeping baseline. The central digest reports a ~1× recent-to-ancient ratio for strict housekeeping classes, while the project report lists tRNA-synth at 2.3× 18,8. See conflicts/conflict—horizontal-gene-transfer-driven-innovation—afc5d92e.
What “core” means. The core flag is described in some places as ≥95% prevalence 3,4 and elsewhere as majority presence 5. See conflicts/conflict—pangenome-core-boundary-and-clade-size-bias—95ccf0a3.
Clade size and essential-core enrichment. The integrated analysis calls the enrichment robust across clade-size strata 6. The digest says it was strongest in larger clades 18. See conflicts/conflict—pangenome-core-boundary-and-clade-size-bias—b490a636.
Effect size of the essentiality–conservation link. Two cohort definitions yield different magnitudes 15,6. See conflicts/conflict—core-genome-burden-paradox—39aa8e5b.
Openness determinants. The environment null and the metabolic and ecological associations used different predictor sets 18. Only 6.8% of species had sufficient coverage for the AlphaEarth associations 18. The digest’s 18/21 group tally also does not match the report’s 13 of 18 positive genera 18,17. See conflicts/conflict—pangenome-openness-determinants—37cb32ff, conflicts/conflict—pangenome-openness-determinants—0ec0a9e1, conflicts/conflict—pangenome-openness-determinants—0f0709ff and conflicts/conflict—pangenome-core-boundary-and-clade-size-bias—f5ff24c2.
Phylogenetic correction. Correction strengthened an association in one project, removed enrichments in another and left a small positive effect in a third 21,22,23. The projects used different controls, so these outcomes are not directly comparable 17,20,21,23,8. See conflicts/conflict—phylogenetic-confounding-of-pangenome-associations—6afa1ce0. Related scope tensions cover:
See conflicts/conflict—phylogenetic-confounding-of-pangenome-associations—782017fa, conflicts/conflict—phylogenetic-confounding-of-pangenome-associations—7b9c5a6c and conflicts/conflict—phylogenetic-confounding-of-pangenome-associations—5a54a7b7.
Metal scores and isolation environment. Heavy-metal contamination isolates showed Cohen’s d = +1.00 for n=10 isolates 12. A species-scale test found rho approximately -0.02 (p > 0.8). It retained only 20 independent species, so that test was underpowered 26. The analyses differ in matching, aggregation and outcome definition, so the disagreement cannot be resolved directly 26. See conflicts/conflict—composite-resistance-score-limitations—be666d4d.
Two-speed boundaries. Several results blur the core/accessory split:
- Nitrogen-fixation core fractions disagree. One project reports nifH clusters as 63.8% core 20. Another reports nitrogen fixation as 72.3% core in one analysis and NifH at a 32.4% core-genome fraction in another 1.
- Singleton baselines differ: 35.3% versus 37.9% 1,2.
- Functional classes split across both sides 9,18,10.
- The 32-species COG sample may miss phylum-specific patterns 9.
See conflicts/conflict—two-speed-bacterial-genome—c03a2981, conflicts/conflict—two-speed-bacterial-genome—925df07d, conflicts/conflict—two-speed-bacterial-genome—a9e6e6ef and conflicts/conflict—two-speed-bacterial-genome—ec20299a.
Where to Go Deeper
- two-speed-bacterial-genome — the functional core/accessory partition and its exceptions.
- horizontal-gene-transfer-driven-innovation — how far mobile-element evidence supports HGT as the source of novelty.
- gene-function-acquisition-depth — tree-based gain timing and its recipient-only limit.
- chromosomal-and-integrative-gene-transfer — T4SS, integrative elements and resistance-gene retention.
- pangenome-core-boundary-and-clade-size-bias — why core fractions depend on sampling and coverage.
- pangenome-openness-determinants — metabolic, ecological and sampling predictors of openness.
- phylogenetic-confounding-of-pangenome-associations — when pooled associations mislead.
- pangenome-integration and within-species-conservation-between-species-functional-divergence — the identifier bridges behind these joins, and layered metal-function conservation.
Key entities: kbase-ke-pangenome, gtdb, gapmind, independent-component-analysis, bakta, alph-aearth.
Key reports: COG Functional Category Analysis, Gene Function Ecological Agora, Conservation vs Fitness — Linking FB Genes to Pangenome Clusters, Pangenome Openness Analysis, Pan-Bacterial AMR Gene Landscape, T4SS–CAZy Environmental HGT, Metabolic Capability vs Dependency.