Raw report: berdl_data_atlas Feeds into: cross-tenant-data-bridging, data-landscape-ownership-and-coverage-bias, environmental-resistome, gene-essentiality, multi-omics-integration, pangenome-integration, provenance-aware-resource-discovery, taxonomic-nomenclature-reconciliation
Overview
The BERDL Data Atlas inventories the KBase Data Lakehouse. That platform holds 1,740 deduplicated tables across 119 databases, 17 tenants (the data-owning namespaces), and 10 funding agencies or programs. It covers 17 biological topics, with billion-row biological datasets on one Spark cluster. The atlas maps data volumes, agency and topic coverage, 536 schema-level cross-tenant bridges defined by 29 canonical join keys, and realized use across 66 BERIL projects. It also identifies five high-leverage unused bridges. It sample-validates one of them, UC1, a structural fitness atlas joining FitnessBrowser to AlphaFold through SwissProt best hits. 1
This is a meta-atlas project, a catalog of data systems rather than a test of biological hypotheses. Its literature references are canonical citations for the data systems being catalogued. They should not be read as support for any biological effect proposed in its use cases. 1
The report describes several deliverables as firsts. One is a comprehensive, machine-readable catalog of the KBase Data Lakehouse (table_topic_map.csv) with tenant, agency, program, and biological-topic provenance. Another is a cross-tenant linkage atlas, mapping 29 canonical keys to 536 schema-level bridges, that shows which biological IDs bridge which tenant/topic cells. A third is a realized-versus-theoretical bridge overlay that surfaces the 51 cross-tenant BERIL projects and identifies which high-leverage bridges remain unused. A fourth is a per-entity-class depth inventory of 65 headline tables, counted with COUNT(*) or COUNT(DISTINCT), that presents the platform’s billion-row biological mass in audience-readable units. The last is UC1, described as the first sample-validated synergy use case, with a corrected, executable join recipe and live-cluster coverage statistics. 1
Key Findings
Billion-row biological depth
The atlas queried 65 curated headline tables on the live cluster. They show the platform to be simultaneously deep across genomes, genes, proteins, structures, phenotype/fitness, samples, community profiles, mass spec, viruses, biochemistry, ontology, environment, and literature. The single largest entity table is kbase_ke_pangenome.gene at 1,011,650,903 rows (~3.4K genes × 293K genomes). 1
Genomes, pangenomes and clusters include:
- 293,059 KBase ke_pangenome genomes
- 27,690 GTDB species clades / pangenomes
- 132.5M gene clusters
- 1,011,650,903 KBase pangenome genes
- 1,158,553 SPIRE MAGs (metagenome-assembled genomes) and 52,515 JGI GEM-MAGs in refdata
- 3,110 ENIGMA depot genomes (6,705 ENIGMA SDT genomes)
- 4,923 PROTECT MIND genomes
- ~1,950 PhageFoundry host genomes across 5 host species 1
Proteins and structures include 215,130,942 UniProt proteins. UniRef clusters (2026-01) number 475,217,233 for UniRef100, 188,848,220 for UniRef90, and 60,315,044 for UniRef50. The inventory also holds 241,070,489 AlphaFold predicted structures and ~253K PDB experimental structures. 1
Phenotype, fitness and growth data include:
- 27,410,721 FitnessBrowser per-gene fitness measurements across 7,552 experiments and 228,709 genes
- 97,334 BacDive strain phenotype profiles
- 57,302 carbon-source phenotype measurements
- 10,744 Web of Microbes growth observations across 37 organisms 1
Field samples and environmental data include the items below. Here an OTU (operational taxonomic unit) is a cluster of similar 16S sequences, and an ASV (amplicon sequence variant) is an exact, error-corrected amplicon sequence.
- 463,972 MicrobeAtlas 16S samples (98,919 OTUs, 260,831,135 OTU-count rows)
- 114,943 USGS produced-water samples
- 16,640 NMDC biosamples
- 5,438 NETL produced-water DNA samples
- 4,346 ENIGMA SDT samples plus 579 ENIGMA DDT measurement “bricks”
- 2,371 Planet Microbe samples
- 218,510 ENIGMA SDT ASVs
- 83,287 AlphaEarth environment embeddings indexed to KBase genomes 1
Community multi-omics include 75,119,498 metatranscriptomic abundance rows (NMDC GOLD). There are also 29,023,980 Kraken and 482,669 Gottcha taxonomic profile rows, and 9,928,244 NOM mass-spectrometry assignments. 1
Phage, virus and mobile-element data include 24,435,662 MetaVR and 15,677,623 IMG/VR viral sequence records in refdata. PhageFoundry adds 933,103 strain-modelling gene records. 1
Biochemistry, ontology and literature data include:
- 56,012 ModelSEED reactions and 45,708 ModelSEED compounds
- 17,783 Rhea reactions
- 48,196 GO terms and 8,813 EC terms (NMDC integrated)
- 255,096 PaperBLAST curated gene assignments
- 39,994,988 PubMed article records 1
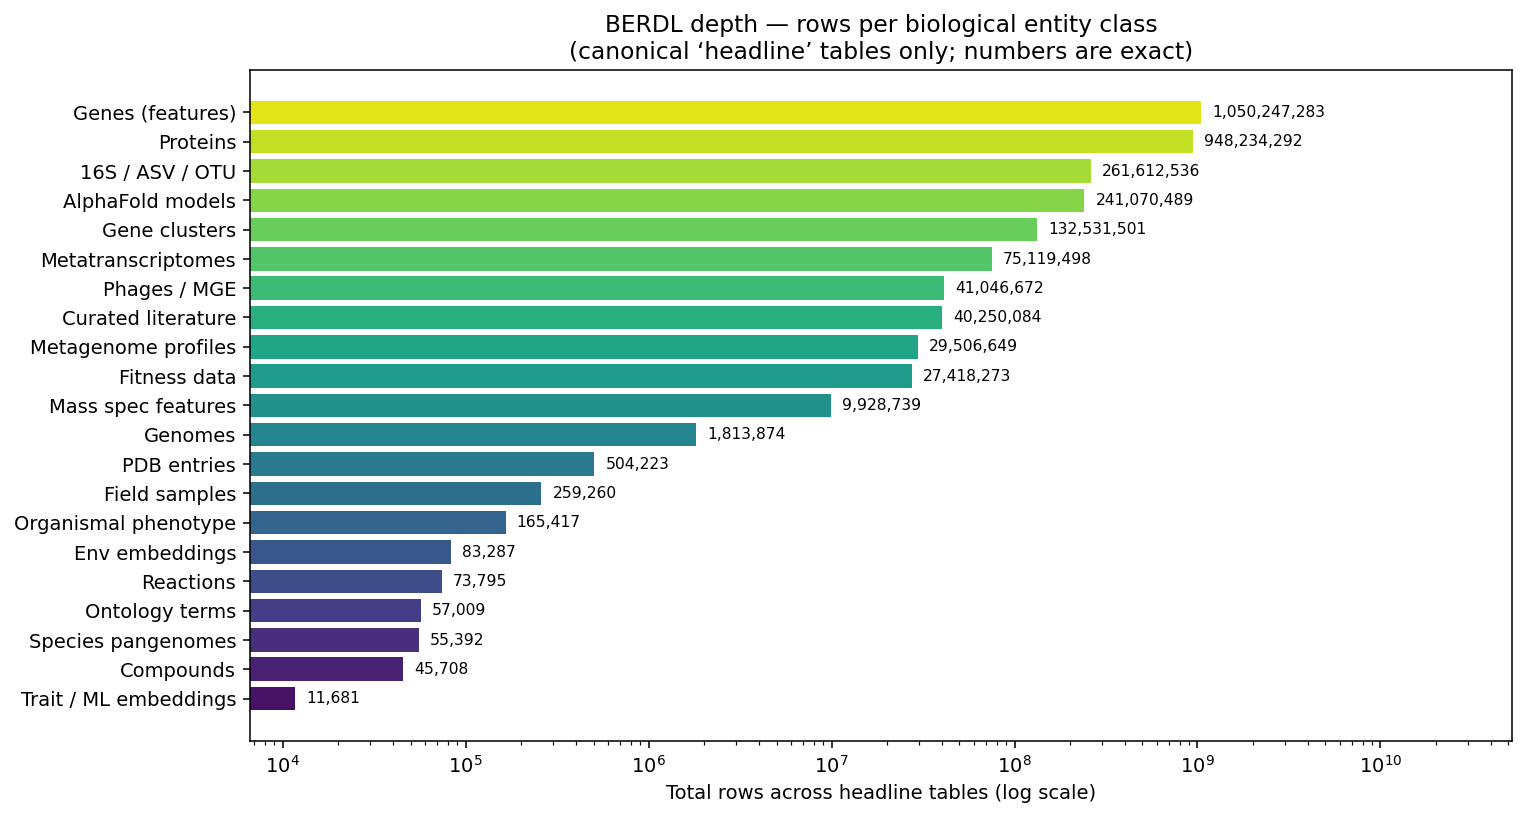 Per-entity-class data volume (log scale). From berdl_data_atlas.
Agency and topic coverage
DOE accounts for approximately 78% of the KBase Data Lakehouse tables. Within that, DOE-BER contributes 63%, DOE BRaVE 14%, DOE/NSF 0.6%, and DOE-FE 0.4%. ARPA-H (PROTECT) contributes 4% and NSF (Planet Microbe) 3.5%. DOI (USGS) and the academic, multi, and user namespaces fill the rest. DOE-BER is the only agency covering all 15 biological topics. 1
DOE-BER spans every topic (15/15). The report’s topic-coverage passage calls Defense/HHS mono-topic, because its PhageFoundry tables are all mobile_phage. That label rests on an earlier inference. The report’s Limitations say phagefoundry was first inferred as “likely” Defense/HHS and later user-corrected to DOE BRaVE, which is the attribution behind the 14% DOE BRaVE share. The Defense/HHS label should therefore be read as superseded. The mono-topic character of the PhageFoundry tables is unaffected. ARPA-H (PROTECT) spans 6 topics. NSF (Planet Microbe), DOE-FE (NETL), and DOI (USGS) are narrow in topic but cover unique sample types. Six topics are more than 75% single-owner, including mobile_phage (96% PhageFoundry), pangenome (79% KBase), and reference_protein (78% refdata). Seven topics are cross-tenant, with the top tenant holding a share of 55% or less. taxonomy spans 12 tenants and has the broadest cross-tenant surface. The agency analysis counts 15 biological topics, while the catalog headline reports 17. The report does not reconcile the two counts. 1
The field_observational topic represents 40% of tables and is dominated by ENIGMA SDT/DDT structure. mobile_phage (PhageFoundry) represents 14%, fitness_phenotype 11%, and genome 6.4%. Every other primary topic is below 4%. Sixteen tables, or 0.9%, remain unclassified; all are personal scratch or one-off survey data. 1
Tenants differ in topic breadth and topic entropy:
- KBase: 10 topics, entropy 2.87; the most evenly cross-topic tenant and the biological reference hub
- NMDC: 11 topics, entropy 2.61; the broadest coverage
- PROTECT: 6 topics, entropy 2.37; described as punching above its size
- KEScience: 11 topics, entropy 1.83; the knowledge-engine layer
- ENIGMA: 5 topics, entropy 0.43; deep but narrow
- PhageFoundry and USGS: mono-topic 1
Cross-tenant linkage surface
The atlas scanned 29 canonical join keys across the catalog, covering genome, taxonomy, sample, annotation, pathway, biochemistry, protein, phage, literature, and KBase workspace relationships. From them it identifies 536 unordered cross-tenant bridges. The most widespread keys are sample_id (10 tenants), genome_id (9), ncbi_taxon_id (9), feature_id (9), and ec_number (8). The top bridges share up to 7 keys, including kbase.pathway with kescience.pathway, and kescience.pathway with phagefoundry.mobile_phage. Another is refdata.structural with kescience.structural, via alphafold_pdb, pfam, and protein_id. 1
The 536 bridges are counted at tenant × topic cell granularity, not as validated record-level joins. Schema-level compatibility does not establish value-space overlap; for example, genome_id means a UPA in KBase, an accession in NCBI, and a hash in MAG pipelines. UC1 is the only bridge whose value-space validity was sample-executed in this study; UC2–UC5 each require their own first sample execution before publication. 1
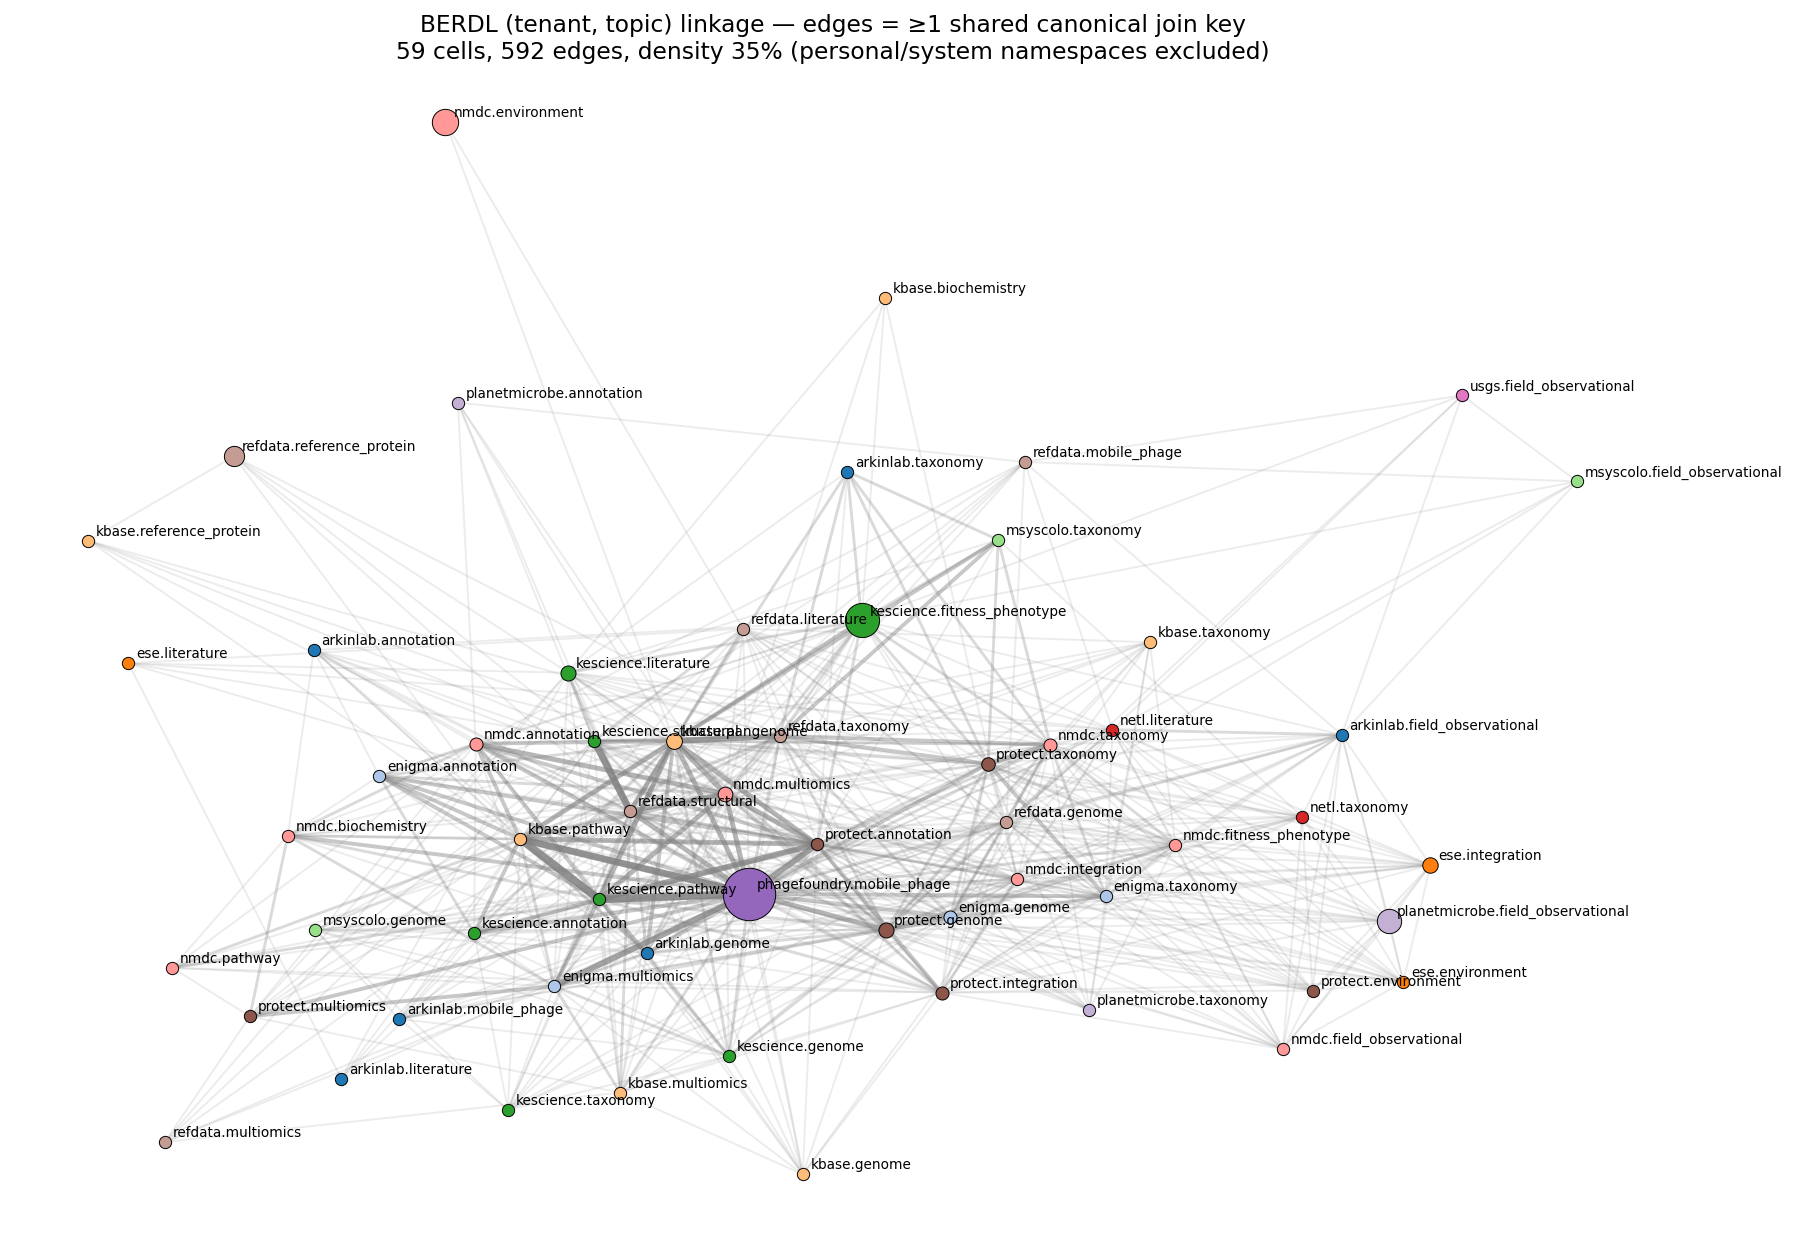 (Tenant, topic) linkage graph — edges = ≥1 shared canonical join key. From berdl_data_atlas.
Realized cross-tenant use
Among 66 audited BERIL projects, 51 (77%) span multiple tenants. KBase appears in 53/66 projects (80%) and KEScience in 35/66 (53%). The report also says the realized kbase × kescience bridge alone accounts for 36 cross-tenant projects, mostly pangenome-by-fitness joins through genome_id and ncbi_taxon_id. These two counts are inconsistent, because a bridge involving KEScience should not appear in more projects than KEScience itself. The report does not reconcile them, so both figures are kept here as reported. A large share of tables does not translate into heavy reuse. ENIGMA holds 36% of tables but appears in only 6 projects. PhageFoundry holds 14% of tables and appears in 5 projects, and PROTECT holds 4% and appears in 2. 1
The report gives three reasons why the kbase × kescience axis dominates realized analyses. Both tenants are intra-DOE-BER, both are well documented, and together they cover the most cross-tenant topics (genome × phenotype). This is the report’s interpretation, not a tested causal finding. It frames UC1–UC5 as the next class of analyses: extending into refdata for structural and GTDB joins, and into nmdc_arkin for multi-omics and environmental context. It also points to PhageFoundry and PROTECT for cross-agency biology, and to ENIGMA for subsurface ecology. 1
Untapped bridges and proposed use cases
The untapped-bridge ranking reflects schema-level join surface and project use at audit time only. At that time, five high-leverage bridges had zero realized use:
- kescience ↔ refdata: 12 keys, including AlphaFold IDs
- enigma ↔ phagefoundry: 11 keys
- kbase ↔ refdata: 11 keys, including gtdb_taxonomy
- nmdc ↔ protect: 10 keys
- nmdc ↔ refdata: 9 keys 1
The five derived use cases are posed as questions; only UC1 has been sample-validated, and none reports a biological result:
- UC1 (kescience ↔ refdata, 12 keys): do high-fitness-impact genes have structural signatures detectable in AlphaFold? 1
- UC2 (enigma ↔ phagefoundry, 11 keys): do subsurface prophages mobilize metal resistance along the Oak Ridge contamination gradient? This is a proposed question, not a demonstrated effect. 1
- UC3 (kbase ↔ refdata, 11 keys): where do GTDB clades and KBase species pangenomes disagree, and what does that imply for gene flow? Both the disagreement and its gene-flow implications remain untested. 1
- UC4 (nmdc ↔ protect, 10 keys): where do clinically relevant pathogens live in the environment, and what biogeochemistry tracks them? No pathogen occurrence is reported as a result. 1
- UC5 (nmdc ↔ refdata, 9 keys): what fraction of NMDC biosamples carry well-formed ENVO terms, and where does coverage break? ENVO is the Environment Ontology, a controlled vocabulary for describing sample environments. No coverage fraction is reported. 1
UC1 structural fitness atlas validation
The proposed UC1 recipe used protein_id as the bridge column, but FitnessBrowser does not expose protein_id. It instead uses a composite (orgId, locusId) primary key. SQL probing found the correct path. genefitness joins to besthitswissprot on (orgId, locusId), and besthitswissprot.sprotAccession then joins to uniprot_accession in alphafold_entries. 1
Live-cluster validation found 27,410,721 FitnessBrowser gene-fitness measurements and 79,180 genes with a SwissProt best hit. It also found 241,070,489 AlphaFold entries. SwissProt-best-hit coverage in AlphaFold was 99.5% (78,753 / 79,180). The corrected join yields 55,454 FitnessBrowser genes across 48 organisms with both fitness data and an AlphaFold model, covering 22,303 distinct AlphaFold models. This is a sample validation of the join, not an analysis of structure–fitness relationships. 1
Example Escherichia coli rows confirm semantic validity: thrA links to AF-P00561-F1, thrB to AF-P00547-F1, thrC to AF-P00934-F1, and talB to AF-Q3Z606-F1. Within the 55,454-gene cohort, 6,635 genes were essential (min_fit ≤ −4), 8,271 strong-defect, 10,950 moderate, 29,467 mild, and 131 no defect. Genes were tested at an average of 121–187 conditions per gene. The report describes the cohort as strongly enriched for essentiality signal and ready for downstream structure-function analysis. 1
Data-use guidance
The atlas assigns roles to key collections. kbase_ke_pangenome (tables genome, gtdb_species_clade, gtdb_metadata, gene, gene_cluster, pangenome, alphaearth_embeddings_all_years) holds KBase computed pangenomes. These serve as the canonical genome reference and the cross-program join anchor. kescience_fitnessbrowser (genefitness, besthitswissprot, gene, experiment) provides per-gene fitness across hundreds of conditions; its SwissProt best hits are the structural-bridge pivot used in UC1. kescience_alphafold holds 241M AlphaFold predicted structures keyed by UniProt accession. kescience_bacdive supplies 97K curated strain phenotype profiles and kescience_webofmicrobes curated growth observations. kescience_paperblast supplies 255K curated gene–paper assignments. 1
For genome and pangenome work, the atlas recommends kbase_ke_pangenome (293K genomes, 27.7K species, and 132.5M gene clusters), with genome_id and ncbi_taxon_id as cross-reference anchors. Other recommended sources are:
- environmental abundance and multi-omics: nmdc_arkin
- field samples: enigma_coral
- phage and mobile-element data: PhageFoundry catalogs
- pathogen genomes: protect_genomedepot
- structures: kescience_alphafold and refdata_pdb
- reference proteins: refdata_uniref50_2026_01, refdata_uniref90_2026_01, refdata_uniref100_2026_01, and refdata_uniprot
- literature: kescience_paperblast and kescience_pubmed 1
The atlas’s universal heuristic is that analyses crossing topics such as genome, phenotype, and environment will almost certainly cross tenants. The canonical bridge is whichever of genome_id, ncbi_taxon_id, sample_id, or feature_id both sides expose. data/cross_tenant_bridges.csv lists the exact key set per pair. 1
Headline collection catalog
Reference protein, structure, literature and reference-genome collections in the report’s catalog:
kescience_pubmed(pubmed_article_wide): 40M PubMed records 1kescience_pdb(pdb_entries): PDB experimental structures, a kescience copy 1refdata_pdb(pdb_entries,pdb_uniprot_mapping): PDB experimental structures plus a UniProt mapping 1refdata_uniprot(protein,entity): 215M UniProt protein records 1refdata_uniref50_2026_01,refdata_uniref90_2026_01,refdata_uniref100_2026_01(cluster): UniRef protein clusters at 3 redundancy levels from the 2026-01 snapshot 1refdata_jgi_gem_mags,refdata_spire,refdata_jgi_virus(genome_metadata,imgvr_sequence_info,metavr_main): reference MAGs and viral sequence catalogs 1
Sample, environmental and community collections:
nmdc_metadata(biosample_set): the NMDC biosample registry 1nmdc_arkin(kraken_gold,gottcha_gold,metatranscriptomics_gold,nom_gold,embeddings_v1,trait_features,rhea_reactions,go_terms,ec_terms): integrated multi-omics, machine-learning embeddings, ontology, and reactions 1enigma_coral(sdt_sample,sdt_genome,sdt_asv,ddt_ndarray): ENIGMA field samples, MAGs, ASVs, and multidimensional measurement datasets 1planetmicrobe_planetmicrobe(sample): NSF Planet Microbe samples 1netl_pw_dna(dna_metadata): DOE-FE NETL produced-water DNA samples 1usgs_produced_waters(usgspwdb_c,usgspwdb_n): DOI / USGS produced-water sample data 1arkinlab_microbeatlas(otu_counts_long,otu_metadata,sample_metadata): MicrobeAtlas 16S OTU profiles 1
Genome-depot, phage, biochemistry and phenotype collections:
enigma_genome_depot_enigma(browser_genome,browser_gene,browser_protein): the ENIGMA genome / gene / protein browser depot 1protect_genomedepot(browser_genome,browser_gene,browser_protein): the PROTECT MIND pathogen genome depot 1phagefoundry_acinetobacter_genome_browser,phagefoundry_klebsiella_*,phagefoundry_paeruginosa_*,phagefoundry_pviridiflava_*,phagefoundry_ecoliphagesgenomedepot,phagefoundry_strain_modelling(browser_genome,browser_gene,strainmodelling_genome,strainmodelling_gene): DOE BRaVE Phage Foundry host-specific genome browsers and strain models 1kbase_msd_biochemistry(reaction,molecule): the ModelSEED biochemistry reference 1globalusers_carbon_source_phenotypes(phenotype_data_table): carbon-source phenotype measurements, shared across tenants 1
Data deliverables
The project’s canonical data files, with their reported row or key counts:
data/table_topic_map.csv(1,740): the canonical inventory of every (tenant, agency, program, database, table) with primary and secondary topic tags and column names 1data/tenant_to_agency.csv(15): the curated tenant → agency / program / primary-funder map, incorporating user corrections for phagefoundry and msyscolo; the report does not state how these 15 rows relate to the 17 tenants in its headline count 1data/join_keys.json(29 keys): for each canonical key, the (tenant, topic, db, table) cells where it appears 1data/cross_tenant_bridges.csv(536): cross-tenant (tenant × topic) bridges with shared-key counts and key inventory 1data/realized_use.csv(66): per-BERIL-project tenant and database usage, with a cross_tenant flag and topic focus 1data/theoretical_vs_realized.csv(72): a tenant-pair overlay of theoretical shared keys against realized project count 1data/data_volume.csv(65): the per-entity-class depth inventory, withCOUNT(*)/COUNT(DISTINCT)per headline table 1
data/untapped_bridges.csv lists 20 highest-leverage unrealized bridges, defined as having ≥1 shared key and 0 realized projects. These are bridges with no realized use at audit time, not bridges shown to be unusable or biologically uninformative. 1
Proposed next steps
The report’s recommended follow-up work:
- Validate UC2–UC5 against the live cluster. Each is estimated to need ~15–30 min of SQL probing to confirm value-space overlap and surface any join-recipe corrections. UC3 (kbase ↔ refdata, GTDB harmonization) is named the next lowest-friction case because it is intra-DOE-BER and both tenants are well documented. 1
- Promote UC1 into its own project, with the validated 55,454-gene cohort as the seed dataset. The known gap is that
kescience_alphafold.alphafold_entrieslacks per-residue pLDDT and structural-feature data; these must be ingested or computed from PDB files as a derived KBase Data Lakehouse collection. 1 - Verify the two remaining tenant → agency mappings,
evaluationandlambda, with program documentation; the user-confirmed corrections forphagefoundry(DOE BRaVE) andmsyscolo(DOE/NSF) are already folded intodata/tenant_to_agency.csv. 1 - Refresh the inventory as the lakehouse grows.
build_inventory.pyanddata_volume.pyare designed to be re-run and rebuild the canonical CSVs from the live cluster in ~95 s and ~60 s, respectively; the report recommends re-running them at each major ingest milestone. 1
Literature context
The report cites three papers as literature context only, not as project findings. The most-used realized bridge (kbase × kescience, 36 BERIL projects) builds on the FitnessBrowser pangenome cross-reference of Price et al. (2018). That bridge is now backed by the cross-organism pangenome of the KBase KE pipeline (Arkin et al. 2018). UC1’s validated SwissProt-best-hit-to-AlphaFold path is described as realizing the structure-function loop opened by Jumper et al. (2021). 1
The report’s reference list gives canonical citations for the catalogued data systems:
- Price et al. (2018), “Mutant phenotypes for thousands of bacterial genes of unknown function,” Nature 557, 503–509, PMID: 29769710 — the FitnessBrowser primary citation 1
- Jumper et al. (2021), “Highly accurate protein structure prediction with AlphaFold,” Nature 596, 583–589, PMID: 34265844 1
- Arkin et al. (2018), “KBase: The United States Department of Energy Systems Biology Knowledgebase,” Nature Biotechnology 36, 566–569, PMID: 29979655 1
- Eloe-Fadrosh et al. (2022), “The National Microbiome Data Collaborative Data Portal: an integrated multi-omics microbiome data resource,” Nucleic Acids Research 50, D828–D836, PMID: 34850110 1
- Söhngen et al. (2014), “BacDive — The Bacterial Diversity Metadatabase,” Nucleic Acids Research 42, D592–D599, PMID: 24214959 1
- Schmidt et al. (2023), “SPIRE: a Searchable, Planetary-scale Index of Metagenomic data and Reference genome assemblies,” Nucleic Acids Research 52, D777–D783, PMID: 37994744 — the SPIRE MAG catalog 1
- Hurwitz et al. (2020), “Planet Microbe: a platform for marine microbiology to discover and analyze interconnected ‘omics and environmental data,” Nucleic Acids Research 49, D792–D802, PMID: 33010169 1
Authorship
The report lists Adam Arkin (University of California, Berkeley, ORCID: 0000-0002-4999-2931) as author. 1
Figures
The report’s figures:
nb05_volume_by_entity_class.png: per-entity-class data volume on a log scale, with exact counts. 1nb01_agency_topic_heatmap.png: agency × biological-topic coverage. 1nb01_topic_concentration.png: topic concentration as a per-topic stacked bar of tenant share, with the top-tenant share annotated. 1nb02_linkage_graph.png: the (tenant, topic) linkage graph, with edges meaning at least one shared canonical join key and edge width proportional to key count. 1nb02_key_tenant_heatmap.png: table counts for each join-key × tenant combination, on a log color scale with exact counts; blank cells mean the key is absent. 1nb03_tenant_frequency.png: tenant reuse frequency across 66 audited BERIL projects. 1nb03_theoretical_vs_realized.png: a per-tenant-pair scatter of shared keys against realized projects; top-right is used and rich, and untapped bridges sit bottom-right. 1nb04_atlas_composite.png: a composite of tenant × topic heat, per-tenant realized reuse, and a theory-versus-practice scatter. 1nb05_volume_per_table.png: every headline table, log-scaled and colored by entity class. 1nb00_topic_distribution.png: primary-topic distribution across 1,740 tables. 1nb00_tenant_topic_heatmap.png: a tenant × primary-topic cross-tab, on a log color scale with exact counts. 1nb01_synergy_capacity.png: a per-tenant scatter of synergy capacity (distinct topics × topic entropy), with point size proportional to table count. 1
Caveats
- Join-key presence demonstrates schema-level compatibility, not valid value-space overlap. UC2–UC5 require live-cluster execution; UC1 is the only sample-validated use case. 1
- Two tenant-to-agency mappings, evaluation and lambda, remain unverified by program documentation; together they account for 4 tables. The phagefoundry and msyscolo mappings were first inferred as “likely” Defense/HHS and NSF/USDA. They were then user-corrected to DOE BRaVE and DOE/NSF, respectively. 1
- The realized-use audit mined project README files and may have missed data-source mentions in research plans or notebook source. The reported tenant breadth is therefore a lower bound. 1
- Most NB05 depth counts are COUNT(*) row totals; only the canonical KBase genome count uses COUNT(DISTINCT genome_id). A pangenome gene row represents one genome-gene pair, so 1.01B gene rows correspond approximately to 293K genomes multiplied by approximately 3.4K genes per genome. 1
- Across-tenant deduplication was not performed. Refdata and KBase may contain the same UniProt entries through different cluster indices. ENIGMA and genome-depot tables share genome records with the ENIGMA SDT layer. 1
- The inventory-audit notebook (
00_inventory_audit.ipynb) walks the Spark catalog, tags every table by tenant, agency and biological topic, deduplicates dotted-namespace duplicates, and audits the unclassified residual (0.9 %). This catalog-level deduplication is distinct from the across-tenant record deduplication that was not performed. 1 - The validated UC1 cohort lacks per-residue pLDDT (AlphaFold’s per-residue confidence score) and structural-feature data in kescience_alphafold.alphafold_entries. These features must be ingested or computed from PDB files before downstream structure-function analysis. 1
- The report says, citing agent memory rather than a live-cluster count in this study, that NMDC metabolomics (3.1M), proteomics (346K), and lipidomics (1.4M) layers are largely untapped despite being a primary cross-validation source. Both the layer sizes and the underuse assessment therefore carry that provenance. UC4 and UC5 both depend on this layer. 1
Slots Into
- data-landscape-ownership-and-coverage-bias — DOE-BER table dominance, single-owner topics, tenant entropy, and the mismatch between table share and project reuse (ENIGMA 36% of tables, 6 projects). 1
- cross-tenant-data-bridging — 536 schema-level bridges from 29 keys, 51/66 multi-tenant projects, five untapped bridges, and the corrected, sample-validated UC1 join. 1
- provenance-aware-resource-discovery — The machine-readable table-topic catalog with tenant, agency, program, and topic provenance, plus exact headline-table inventory counts. 1
- taxonomic-nomenclature-reconciliation — UC3 poses, but does not answer, where GTDB clades and KBase species pangenomes disagree. 1
- pangenome-integration — The atlas quantifies KBase pangenome depth, GTDB species-clade coverage, and the dominant realized kbase × kescience pangenome-to-fitness bridge. 1
- condition-specific-fitness — UC1 validates a 55,454-gene cohort linking FitnessBrowser condition-specific measurements to AlphaFold models. 1
- gene-essentiality — The UC1 cohort contains exact essential, strong-defect, moderate, mild, and no-defect fitness classes across 48 organisms. 1
- multi-omics-integration — The atlas inventories NMDC metatranscriptomics, taxonomy profiles, mass spectrometry, ontology, and underused metabolomics, proteomics, and lipidomics layers as cross-tenant integration opportunities. 1
- environmental-resistome — UC2 and UC4 identify untapped bridges connecting environmental or subsurface samples with phage, pathogen, resistance, and biogeochemical data; both remain proposed questions. 1