Two projects in the corpus report very different values for how often nitrogen-fixation genes sit in the core genome, the conserved component of bacterial genomes, as opposed to the more variable accessory component. pgp_pangenome_ecology reports nifH clusters as 63.8% core 1. plant_microbiome_ecotypes reports nitrogen fixation as 72.3% core in one analysis and NifH as 32.4% core-genome fraction in another 2. This matters for two-speed-bacterial-genome: whether nitrogen fixation belongs with the conserved core or the variable accessory component depends on which value holds. The sources do not reconcile these values, so the degree of nitrogen-fixation core conservation remains unresolved 1,2.
Evidence Sides
Side A: nifH is majority-core at the gene-cluster level. pgp_pangenome_ecology reports nifH clusters as 63.8% core 1. The measure is the share of nifH gene clusters classified as core.
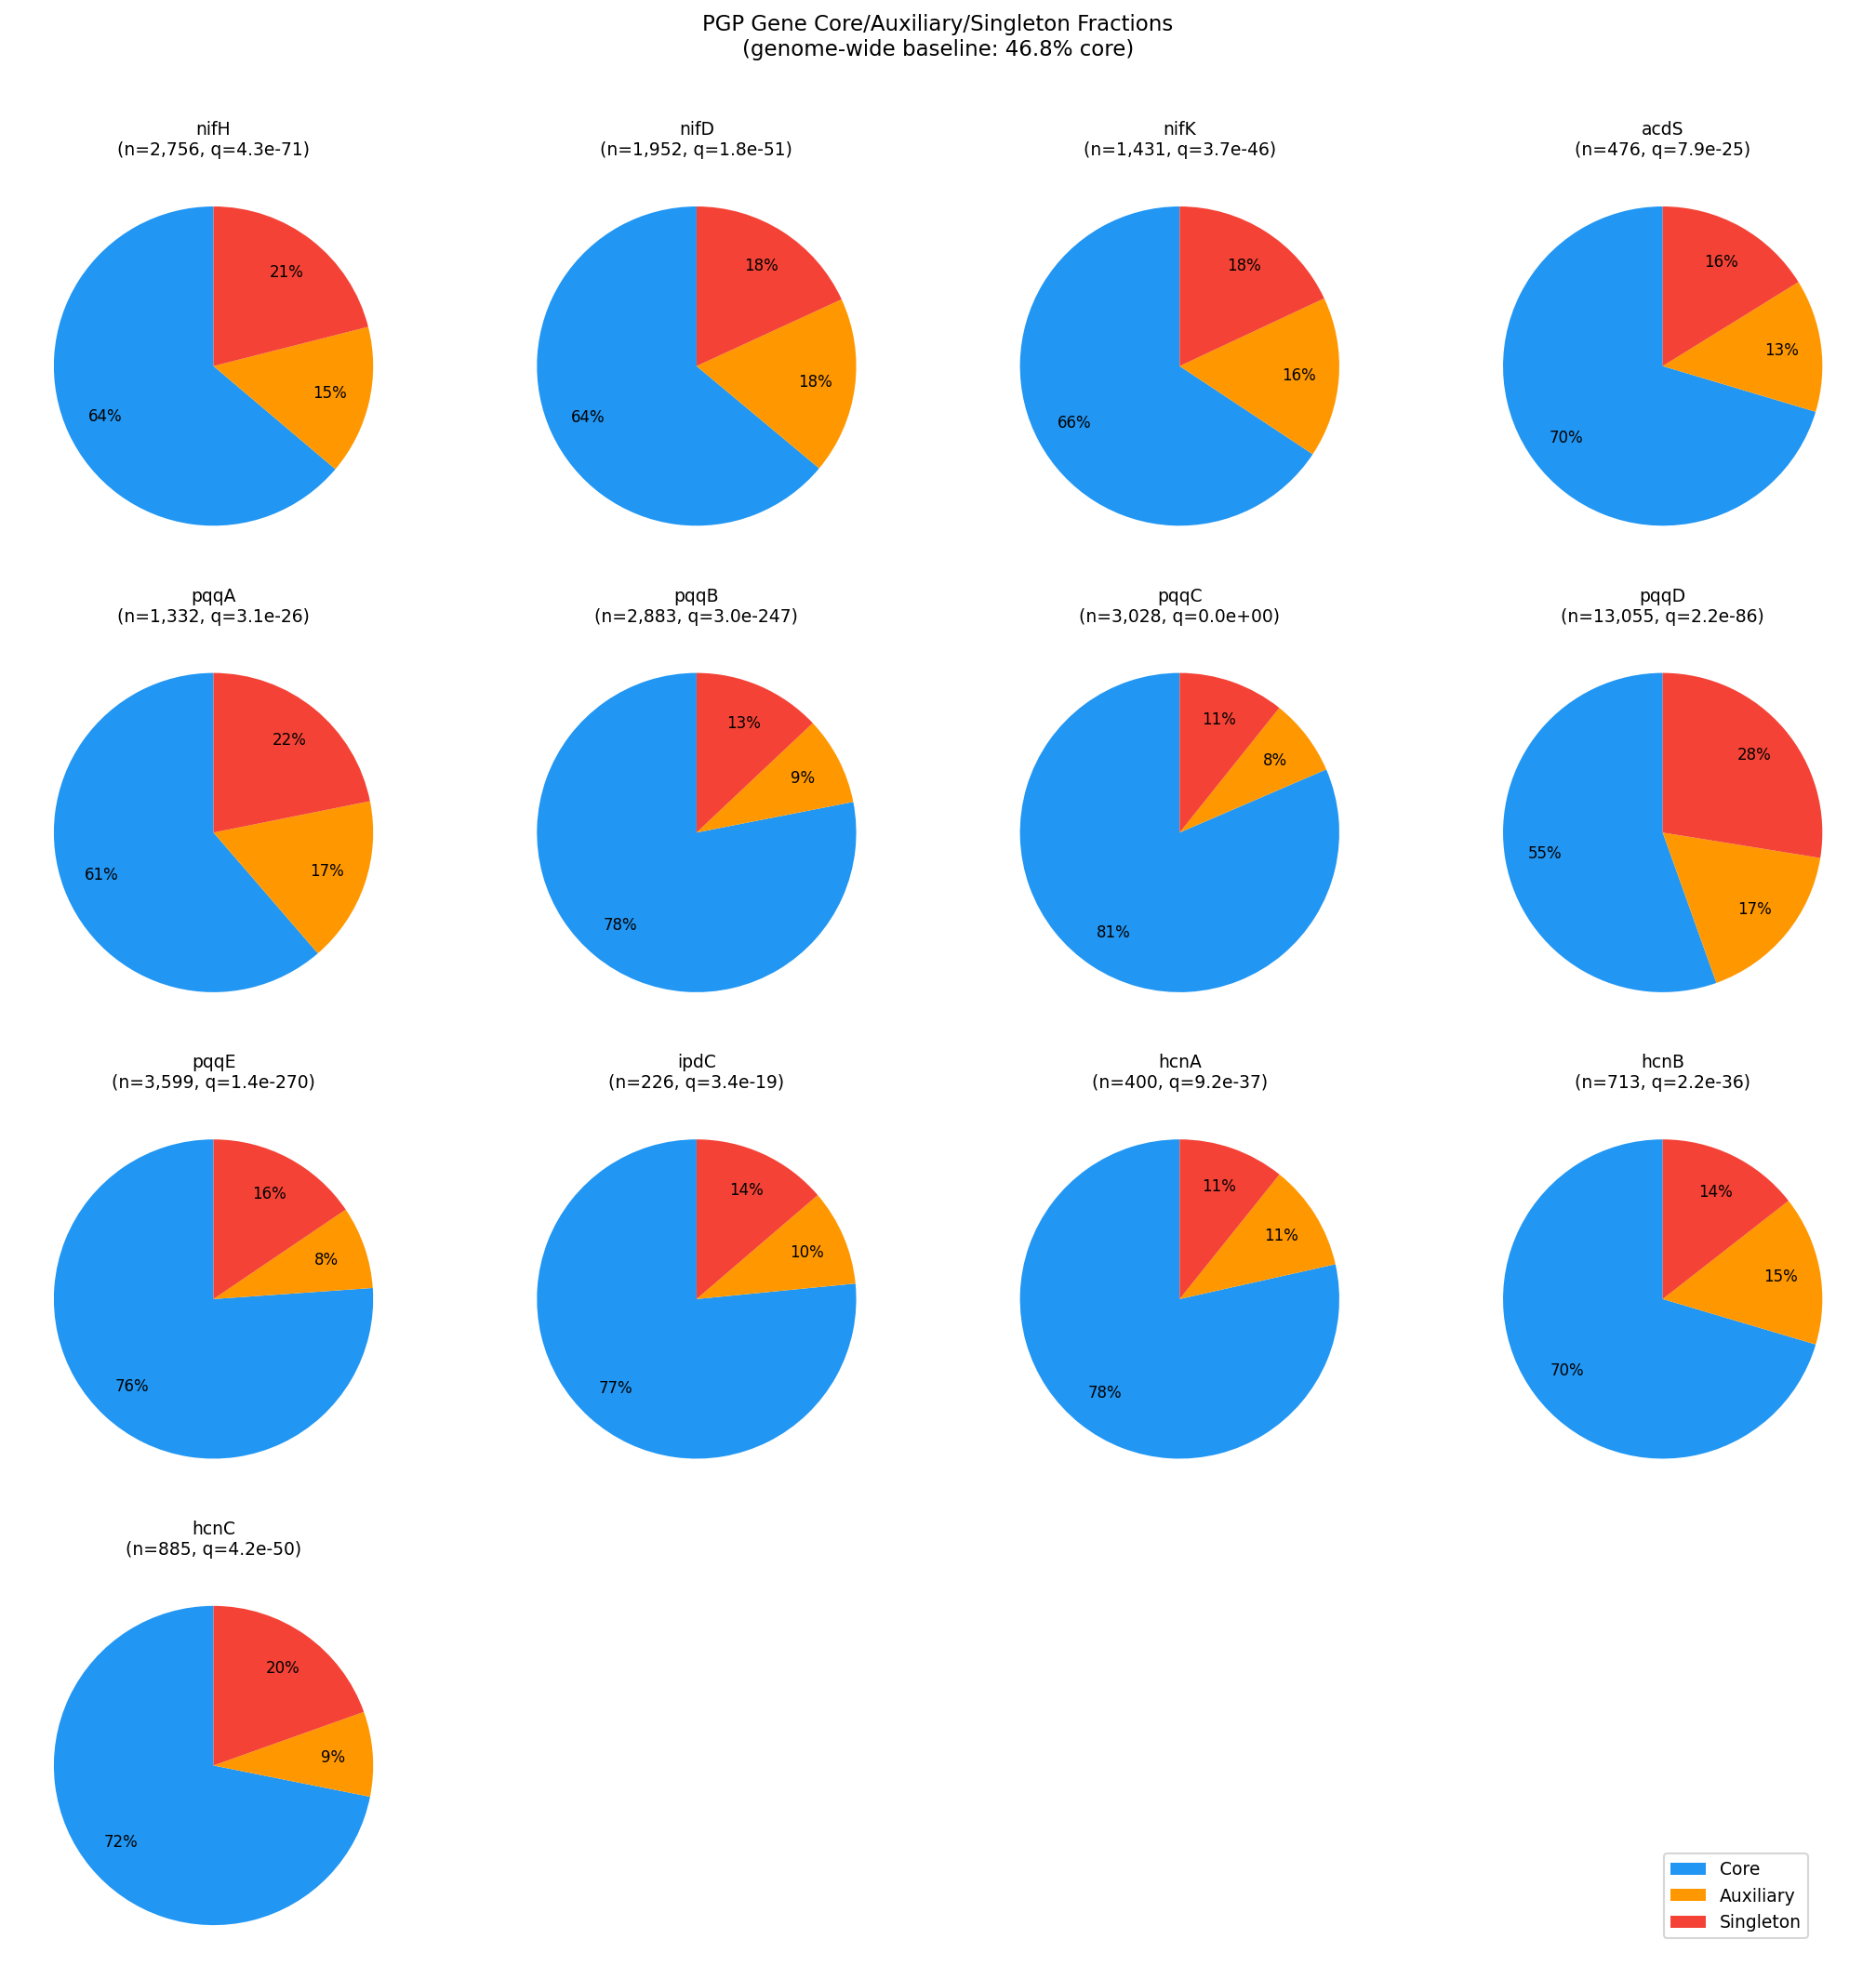 Core/auxiliary/singleton fractions per PGP gene (genome-wide baseline: 46.8% core). From pgp_pangenome_ecology.
Side B: nitrogen fixation is majority-core in one analysis. plant_microbiome_ecotypes reports nitrogen fixation as 72.3% core in one analysis 2. The value is reported for nitrogen fixation as a function; its counting unit is not stated in the supplied evidence.
Side C: NifH is minority-core in a second analysis. In another analysis, the same project reports NifH as 32.4% core-genome fraction 2. That analysis drew on a re-run search for NifH protein-domain hits 2.
These values come from different projects and from different analyses within one project, and the sources do not align them on a common denominator 1,2.
Possible Reconciliations
- Hypothesis 1: The measures differ. Each value may count a different unit, for example gene clusters, function-level calls or domain-based detections; the supplied evidence does not establish which denominator each uses. If the units differ, the values would be non-comparable rather than truly contradictory.
- Hypothesis 2: The genome sets differ. The two projects may have sampled different sets of species or genomes. Core fractions would then legitimately differ by sampled lineage.
- Hypothesis 3: The annotation pipelines differ. Domain-based detection may capture related proteins that gene-name or function-level calls exclude, which would shift the core fraction.
The supplied evidence does not test these hypotheses.
Resolving Work
- Same genomes, three measures. Using the species shared by both projects, compute the core fraction of nitrogen fixation by gene-cluster, function-category and protein-domain annotation. The question is whether the measure alone reproduces the spread.
- Filter domain hits. Recompute the NifH core fraction after excluding domain hits from genomes with no other nitrogen-fixation annotation. The question is whether proteins that share the domain without the function lower the domain-level value.
- Split by lineage. Stratify core fractions by GTDB (Genome Taxonomy Database) family and by plant-associated versus other isolation sources. The question is whether taxonomic composition explains the between-project difference.
- Check definitional parity. Re-derive each project’s core threshold and denominator, whether per cluster, per species or per hit, from its notebooks. The question is whether the reported percentages share a definition.