Raw report: alphafold_msa_annotation Feeds into: core-gene-annotation-paradox, cross-tenant-data-bridging, ec-less-reaction-annotation, experimental-prioritization-of-functional-dark-matter, gene-essentiality, genomic-under-representation, multi-omics-integration, pangenome-core-boundary-and-clade-size-bias, pangenome-integration, provenance-aware-resource-discovery, research-attention-inequality, structural-annotation-gap, two-speed-bacterial-genome
Overview
This report evaluates AlphaFold multiple-sequence-alignment (MSA) depth as a proxy for functional annotation richness across bacterial pangenome gene clusters, using joins among kbase_ke_pangenome, bakta_annotations, interproscan_domains, and kescience_alphafold. Of 132,531,501 total gene clusters, 38,804,903 (29.3%) had a real UniProt accession and 38,051,842 (28.7%) bridged successfully to AlphaFold MSA depths; The report describes the remaining 70.7% as lacking UniRef100 IDs or carrying UniParc-only (UPI-prefixed) identifiers without an AlphaFold entry. That percentage is not the complement of the stated 28.7% bridge rate. UniProt-linked coverage is not random. Well-characterised organisms such as E. coli, Pseudomonas, and Bacillus are over-represented, so the analysed subset is biased toward better-studied organisms. The report hypothesizes, rather than measures, a larger annotation gap among the remaining 70.7%. 1
Key Findings
Core and accessory structural representation
Core gene clusters had a median MSA depth of 15,308, compared with 5,299 for auxiliary+singleton clusters and 5,527 for auxiliary non-singleton clusters: 2.89× higher than auxiliary+singleton and 2.77× higher than auxiliary non-singleton. The 10th-percentile MSA depth was 334 for core genes versus 25–32 for accessory genes. 1
The report’s interpretation reverses the meaning of this lower tail. It states that the bottom 10% of core genes still have MSA depth ≥ 334, but its own table reports 415,733 core clusters with MSA depth < 10. This is an internal contradiction in the report, not a finding about the bottom 10% of core genes. 1
Among bridged clusters, the core class contained 25,571,299 clusters, with 415,733 (1.6%) having MSA depth < 10 and 979,912 (3.8%) hypothetical; auxiliary non-singleton contained 5,384,900 clusters, with 245,002 (4.6%) below MSA depth 10 and 622,748 (11.6%) hypothetical; auxiliary+singleton contained 7,095,643 clusters, with 392,959 (5.5%) below MSA depth 10 and 979,300 (13.8%) hypothetical. The same table reports 90th-percentile MSA depths of 19,500 (core), 19,192 (auxiliary non-singleton), and 19,203 (auxiliary+singleton). The table’s count of 415,733 very-low-depth core clusters differs from the 415,603 distinct core clusters in the paradox-protein census, and the report does not reconcile the two figures. 1
Hypothetical-protein rates decreased from 13.8% among 7,095,643 auxiliary+singleton clusters to 11.6% among 5,384,900 auxiliary non-singleton clusters and 3.8% among 25,571,299 core clusters. Chi-square tests were overwhelmingly significant (χ² > 500,000; p ≈ 0), with odds ratios of 0.25 for core versus auxiliary+singleton and 0.31 for core versus auxiliary non-singleton. 1
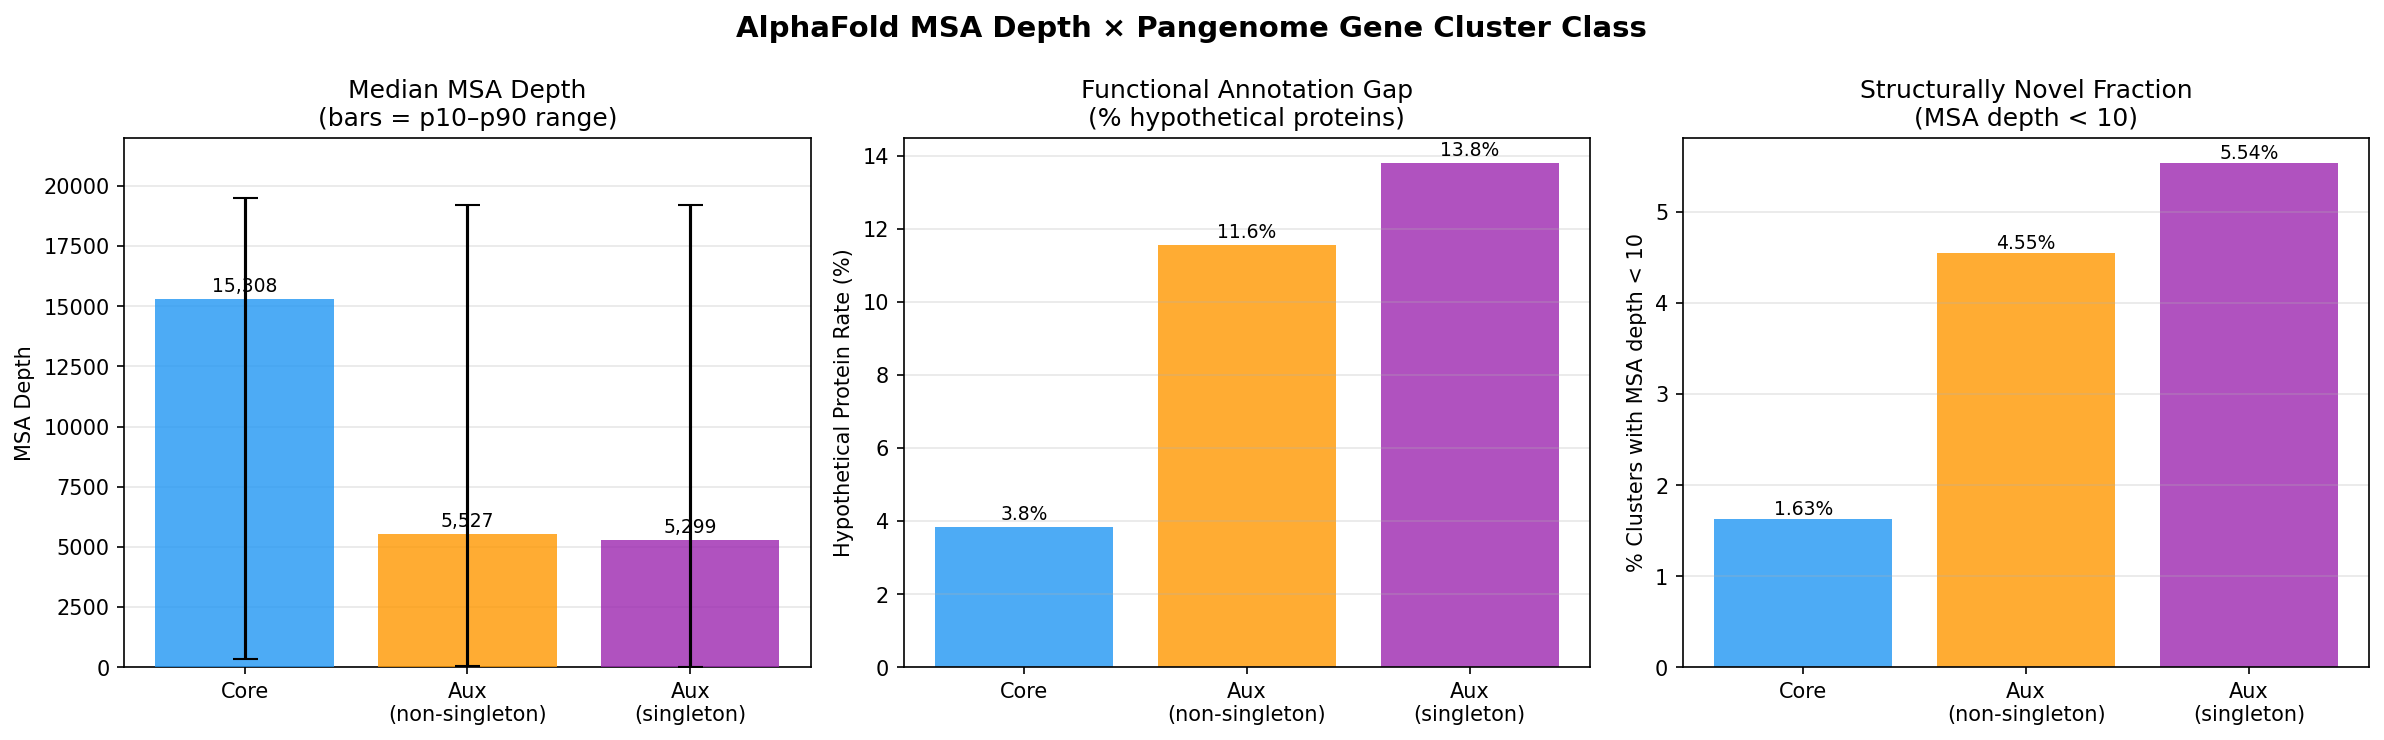 MSA depth by pangenome class, hypothetical rates, and structurally novel fraction. From alphafold_msa_annotation.
MSA depth and domain annotation richness
Across 38,051,842 gene cluster–UniProt pairs, MSA depth and domain-hit count had Spearman ρ = 0.7563, given as 0.756 in the report’s findings section. This is a positive association, not a causal test. Across the reported core-cluster MSA-depth bins, mean domain hits increased from 0.59 for MSA depth < 10 to 10.83 for MSA depth ≥ 10,000, while mean distinct InterPro (IPR) families increased from 0.059 to 4.601, an 18× span in mean domain hits. 1
The MSA-depth bins contained 415,733 core clusters below 10, 1,143,785 at 10–99, 2,301,137 at 100–999, 3,126,558 at 1,000–4,999, 2,591,011 at 5,000–9,999, and 15,993,075 at ≥ 10,000. The monotone relationship between MSA depth and domain hits held within core, auxiliary non-singleton, and auxiliary+singleton classes, with core genes showing slightly higher domain richness per MSA bin than accessory genes at equivalent depth. The report does not give class-specific correlation coefficients. 1
Of all 132,531,501 gene clusters, 111,035,431 (83.8%) had at least one InterProScan domain annotation. Among these annotated clusters, not all 132,531,501, mean hits were 7.5 and mean distinct IPR families were 3.3. The report contrasts this domain-annotation coverage with its stated 29.3% AlphaFold bridge coverage, although its successful MSA-depth bridge figure elsewhere is 28.7%. It interprets the difference as showing that sequence-profile domain annotation reaches further into sequence space than structural homology does. 1
Conserved core proteins with very low MSA depth (putative structural novelty)
The report identified 415,603 distinct core clusters with MSA depth < 10, represented across 14,768 species clades. Their mean and median MSA depths were 4.57 and 4.0, respectively; 286,439 (68.9%) were hypothetical, 137 (0.033%) were EC-annotated, and 346 (0.083%) were KEGG-mapped. 1
The paradox-protein subset therefore had a 68.9% hypothetical rate versus 3.8% for all core genes, while EC and KEGG annotations were below 0.1%. The report interprets these proteins as conserved by pangenome classification yet structurally isolated from characterised sequence space, making them candidates for experimental structural characterisation; this interpretation is a prioritisation hypothesis rather than direct experimental validation. 1
In this analysis, core status means presence in the majority of genomes within each species clade (14,768 clades for the paradox subset), not universality across bacteria. The report infers strong purifying selection, likely biological importance, and a genuinely unprecedented fold from conservation plus fewer than 10 detectable homologs. These are interpretations, not direct measurements. 1
Top-ranked paradox proteins with MSA depth = 1 came primarily from poorly characterised marine and soil bacteria, including Oceanicoccus, Dwaynesavagella, and CAILRJ01. Non-hypothetical entries at MSA depth = 1 included an RNA polymerase ω-subunit family protein and an FXSXX-COOH domain protein, both described as conserved structural components without solved structures for those specific lineages. 1
Resolution of the apparent core/accessory tension
The report flags a tension: core genes have a low overall hypothetical rate, yet the core subset with MSA depth < 10 has a 68.9% hypothetical rate versus 3.8% for all core genes. It resolves the apparent contradiction between lower overall hypothetical rates in core genes and the 415,603 low-MSA-depth core clusters by distinguishing two annotation-gap layers: an MSA-depth-driven gap affecting all pangenome classes, and a pangenome-class gap in which accessory and singleton genes have higher hypothetical rates, independent of MSA depth. The report offers horizontal transfer, rapid evolution, and taxonomically narrow distribution as likely explanations rather than directly tested mechanisms. The cross-class comparison is dominated by the higher average MSA depth of core genes, whereas the paradox subset exposes a severe annotation gap within core genes. 1
Literature and annotation resources
The report’s literature context cites two structural resources that expanded predicted-structure coverage to hundreds of millions of proteins: the AlphaFold Protein Structure Database (Varadi et al. 2022) and its 2025 update (Bertoni et al. 2026). It attributes to Schaeffer et al. (2026) a finding of > 100,000 AFDB Swiss-Prot domains with no Pfam mapping. That figure is cited literature, not a measurement made by this project. The report names Pfam, Gene3D, SUPERFAMILY, and PANTHER as the domain-profile resources behind sequence-profile annotation. 1
Caveats
- The coverage figures are internally inconsistent. The limitations section labels bridge coverage as 29.3%, but the dataset-coverage section gives 29.3% as the share with a real UniProt accession and 28.7% as the share that successfully bridged to AlphaFold MSA depths. The analysis included only clusters with a non-UPI UniProt accession. The dataset-coverage section gives 70.7% as excluded, whereas the limitations section says 71% lack AlphaFold entries. A larger annotation gap in these excluded, poorly characterised organisms remains a hypothesis and was not directly measured. 1
- MSA depth was looked up for each gene cluster’s representative sequence, so within-cluster sequence diversity was ignored and the representative may have higher or lower MSA depth than typical cluster members. 1
- The 293K genomes were not phylogenetically balanced; common taxa such as Pseudomonas and E. coli were over-represented, influencing core-gene counts and MSA-depth distributions. 1
- Spearman ρ = 0.7563 was computed on the full 38,051,842-pair dataset without subgroup stratification, so its value may differ among core, auxiliary, and singleton clusters and among organisms with different annotation gaps. 1
- The analysis used a static version-6 KBase Data Lakehouse AlphaFold snapshot, and later UniProt deposits may change MSA depths. 1
Data and Outputs
The inputs came from two collections. The kbase_ke_pangenome collection supplied gene_cluster, bakta_annotations, and interproscan_domains, covering cluster classification, annotation quality, the UniRef100 bridge, and domain hits. The kescience_alphafold collection supplied alphafold_msa_depths, which gives MSA depth per UniProt accession. One output is data/paradox_top1000.csv, holding 1,000 paradox-protein records ranked by ascending MSA depth. Another is the three-panel figure figures/NB03_msa_depth_pangenome_class.png, which shows median MSA depth with p10–p90 range, hypothetical-protein rate, and fraction with MSA depth < 10, each by pangenome class. 1
Proposed Future Work
- Within-class stratification: run the MSA-depth–domain-richness analysis separately for core, auxiliary, and singleton clusters to test whether the gradient is steeper in one class. This remains unresolved. 1
- ESMFold (Lin et al. 2023) does not use MSA depth, so the report proposes it as an orthogonal structural-novelty signal. No comparison result is reported. 1
- Map the 415K paradox clusters onto the GTDB (Genome Taxonomy Database) phylogeny to find the phyla and families with the highest densities of conserved-yet-novel proteins. These densities are not reported. 1
- Join the paradox protein list to
kescience_fitnessbrowserfitness scores, where available, to find paradox proteins needed for growth in at least one condition. This would give experimental evidence of function without annotation, but the report gives no results from this join. 1
Slots Into
- pangenome-integration — the 2.9× core/accessory MSA-depth gradient, class-specific hypothetical rates, and conserved low-MSA-depth core subset connect pangenome structure to annotation coverage. 1
- multi-omics-integration — the proposed integration of paradox-protein clusters with Fitness Browser measurements provides a route to connect structural novelty with experimentally observed fitness phenotypes. 1
- gene-essentiality — the report proposes joining the 415,603 paradox clusters to fitness scores to identify conserved, structurally novel proteins with condition-specific or growth-essential phenotypes. 1
- core-gene-annotation-paradox — the 68.9% hypothetical rate among low-MSA-depth core clusters versus 3.8% for all core clusters, and the report’s two-layer resolution of that tension. 1
- structural-annotation-gap — the monotone association between MSA depth and domain richness (Spearman ρ = 0.7563), plus the representative-sequence and pooled-correlation caveats. 1
- two-speed-bacterial-genome — higher hypothetical rates in auxiliary and singleton clusters than in core clusters. 1
- cross-tenant-data-bridging — the partial UniProt-to-AlphaFold bridge and its internally inconsistent coverage percentages. 1
- genomic-under-representation — bridge coverage favours well-studied organisms, leaving the annotation gap in the unbridged fraction unmeasured. 1
- research-attention-inequality — over-representation of E. coli, Pseudomonas, and Bacillus in UniProt shapes which clusters can be analysed. 1
- experimental-prioritization-of-functional-dark-matter — the low-MSA-depth core set is a proposed structural-characterisation priority list that has not been experimentally validated. 1
- pangenome-core-boundary-and-clade-size-bias — the per-clade majority definition of core and the phylogenetically imbalanced 293K-genome sample. 1
- provenance-aware-resource-discovery — results depend on a single version-6 AlphaFold snapshot. 1