Two analyses in the corpus measure how much more often essential genes fall in the pangenome core, the genes each analysis classifies as conserved rather than auxiliary. Both point toward a positive association, but they use different category definitions and organism sets. 1,2 The tension is not about direction. It is about whether either effect size can serve as the magnitude of the essentiality–conservation link. The disagreement recurs across core-genome-burden-paradox, essentiality-assay-discordance and pangenome-core-boundary-and-clade-size-bias.
Evidence Sides
Side A: the 33-organism linkage analysis (essential versus non-essential) The 33-organism linkage analysis reports that essential genes are 86.1% core versus 81.2% for non-essential genes. 1,2 The new result supports a positive essentiality–conservation association. 2
Side B: the 43-organism synthesis and independent analysis (essential versus always-neutral) The other analysis reports that essential genes are 82% core versus 66% for always-neutral genes across 43 bacteria. 1,2 The 86.1% versus 81.2% fractions are not directly comparable to the 82% versus 66% fractions from the 43-organism synthesis and independent analysis, because the cohorts and classifications differ. 2,3,1
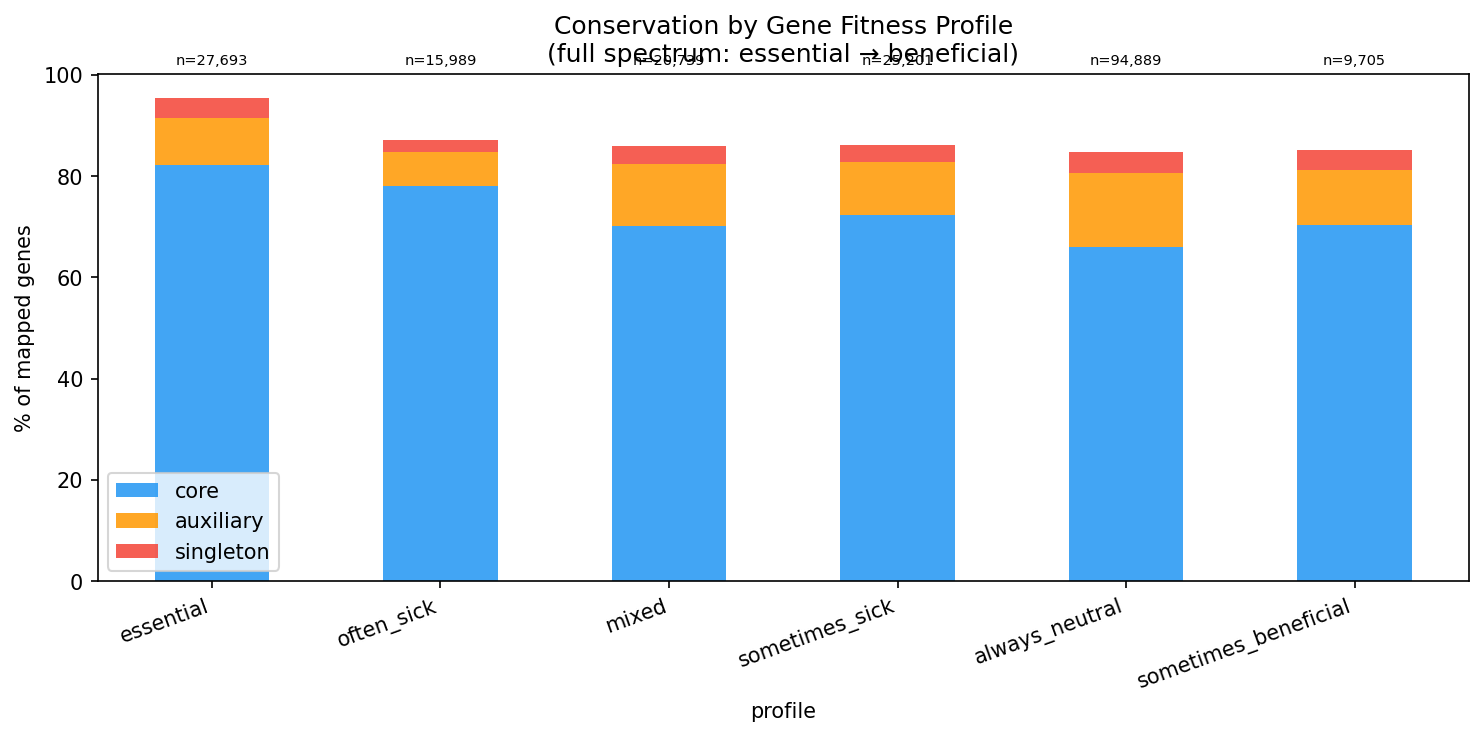 Conservation by Fitness Profile. From fitness_effects_conservation.
What the sides share and where they part The results point the same way but use different category definitions and organism sets. Neither resolves the poor binary agreement between insertion assays (which measure the fitness of transposon-insertion mutants) and complete-knockout assays (which test whether removing the entire gene is lethal). 1,2 The differing effect sizes leave the magnitude sensitive to dataset composition and operational definitions. 2 These values should not be reconciled silently. They arise from different organism sets, phenotype categories and integration procedures, so the difference is evidence that the estimated conservation boundary is analysis-dependent. 2,1
Possible Reconciliations
- Hypothesis 1 (comparison-group effect): Side B contrasts essential genes with always-neutral genes. If Side A’s non-essential group also contains genes with fitness effects, that difference alone could produce a wider gap in Side B without either estimate being wrong.
- Hypothesis 2 (cohort effect): The two analyses use different organism sets. 2,1 Organism composition and clade sampling could shift baseline core fractions, consistent with the analysis-dependent boundary described in pangenome-core-boundary-and-clade-size-bias.
- Hypothesis 3 (integration effect): Differences in how fitness data are linked to pangenome clusters could change which genes enter each category and so change the reported fractions.
Resolving Work
- Re-run Side B’s category scheme (essential, always-neutral and intermediate categories) on Side A’s 33-organism linked gene set. This asks whether the gap widens toward Side B’s contrast once the cohort is held fixed.
- Re-run Side A’s essential-versus-non-essential split on the 43-organism gene set. This asks whether the narrower gap reappears when only the classification changes.
- Restrict both analyses to the organisms they share and compare per-organism core fractions. This separates cohort effects from definitional effects.
- Recompute core fractions under alternative core thresholds and clade-sampling schemes on both cohorts. This tests whether the conservation boundary itself drives the divergence.
- Compare gene-to-cluster linkage between the two integration procedures for the same genes. This asks whether category membership differs for identical genes.