Raw report: amr_fitness_cost Feeds into: antimicrobial-resistance-fitness-cost, chromosomal-and-integrative-gene-transfer, condition-dependent-gene-tradeoffs, costly-dispensable-gene-loss, environmental-resistome, fitness-condition-coverage-prioritization-bias, functional-marker-validation, gene-essentiality, laboratory-fitness-versus-natural-selection, metal-cross-resistance, pangenome-conservation-fitness-decoupling, pangenome-core-boundary-and-clade-size-bias, pangenome-integration, phylogenetic-confounding-of-pangenome-associations, transposon-callability-bias
Overview
This report uses genome-wide RB-TnSeq (random barcode transposon sequencing, a pooled mutant-fitness assay) data from the KBase Fitness Browser compendium to test antimicrobial-resistance (AMR) fitness costs across bacteria. It identifies 1,352 AMR genes across 43 organisms, links them to fitness measurements and pangenome conservation, and evaluates baseline costs, antibiotic-dependent importance, resistance mechanism, and core-versus-accessory status. Twenty-five organisms qualify for per-organism tests, with 25/25 showing a positive AMR-versus-background fitness shift. 1
Key Findings
Universal baseline cost
Under non-antibiotic conditions, AMR gene knockouts have systematically higher fitness than non-AMR gene knockouts, indicating that AMR genes impose a relative metabolic burden. A DerSimonian-Laird random-effects meta-analysis across 25 organisms gives a pooled effect of +0.086 [95% CI: +0.074, +0.098], z = 14.3, p ~ 0; all 25 of 25 organisms show a positive shift. The median per-organism Cohen’s d is 0.18, and heterogeneity is I² = 54.3% with Cochran’s Q = 52.54, p = 0.0007. Six organisms are nominally significant at p<0.05 and two remain significant after false discovery rate (FDR) correction at q<0.05: acidovorax_3H11 and Koxy. The report calls the median d a small but real effect, consistent with a literature prediction of +0.05 to +0.20 for fitness costs after compensatory evolution. A forest plot shows the per-organism shifts, and all 25 organisms are positive. 1
The report interprets the +0.086 effect as a relative difference between AMR knockout fitness and the non-AMR knockout background, not as beneficial absolute growth: AMR gene knockouts are 0.086 fitness units less detrimental than the average gene knockout, meaning AMR genes are more dispensable than the typical gene. Absolute AMR knockout fitness averages −0.024, while the non-AMR background averages approximately −0.11; a one-sample Wilcoxon signed-rank test asking whether AMR knockout fitness is greater than zero gives p = 0.999, rejecting an absolute-benefit framing. AMR knockouts therefore still sit slightly below the pool mean. 1
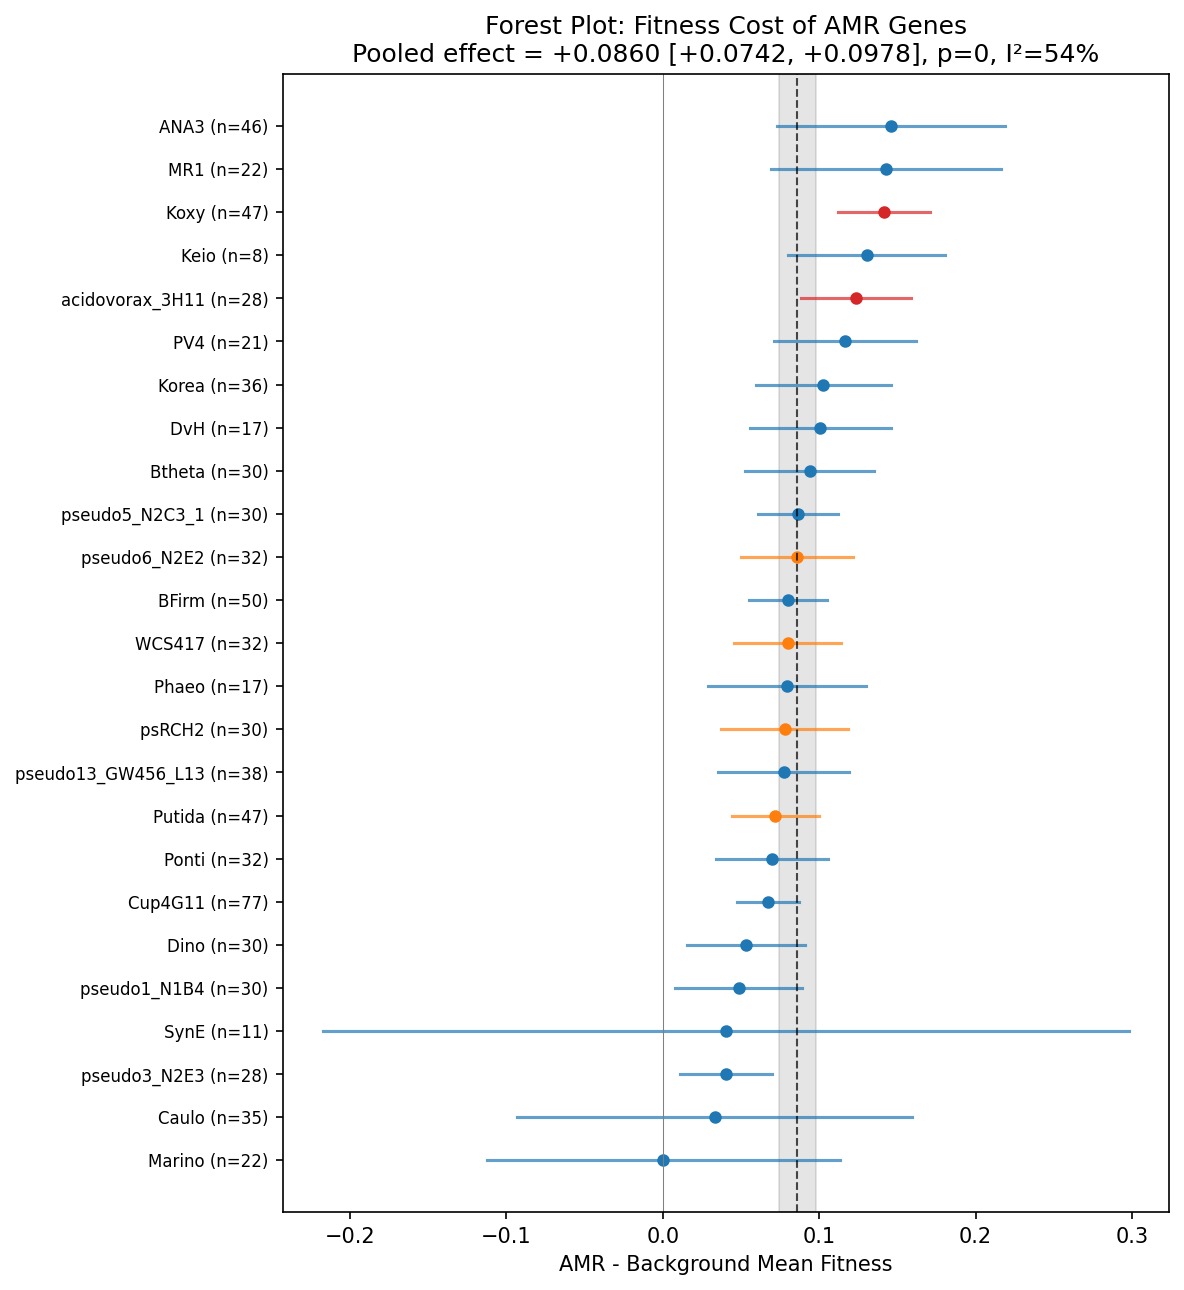 Forest plot showing positive fitness shift for AMR gene knockouts across all 25 organisms. From amr_fitness_cost.
Only 4.6% of AMR genes are absent from the fitness matrices and therefore putatively essential, compared with an approximately 14% background essential rate estimated in a prior analysis using a different organism set. Tier 1 (bakta_amr, N=110) and Tier 2 keyword-annotated genes (N=691) have indistinguishable fitness distributions (KS p = 0.17), while the broader assembly contains 178 Tier 1 and 1,174 Tier 2 genes. The report argues that this low putative-essential rate also argues against strong right-censoring bias. 1
Increased importance under antibiotic exposure
Across any-antibiotic experiments, 57.0% of AMR genes show a fitness flip toward greater importance under antibiotic exposure, with N = 797, mean flip +0.045 (non-antibiotic fitness minus antibiotic fitness), and Wilcoxon signed-rank p = 0.0001. The flip is mechanism-dependent: broad-spectrum efflux genes show a mean flip of +0.094, compared with −0.001 for enzymatic inactivation genes, with Mann-Whitney U p = 0.007. The report proposes that the 43% of AMR genes that do not flip likely reflect narrow-spectrum resistance tested against non-matching antibiotics, not non-functional genes. This is an interpretation, not a direct test. The report’s summary table lists 157 class-matched and 797 any-antibiotic gene-antibiotic pairs, with flip rates of 54.8% and 57.0% respectively. The table labels the 797 as pairs, but the prose describes 797 AMR genes, and the report leaves this inconsistency unresolved. 1
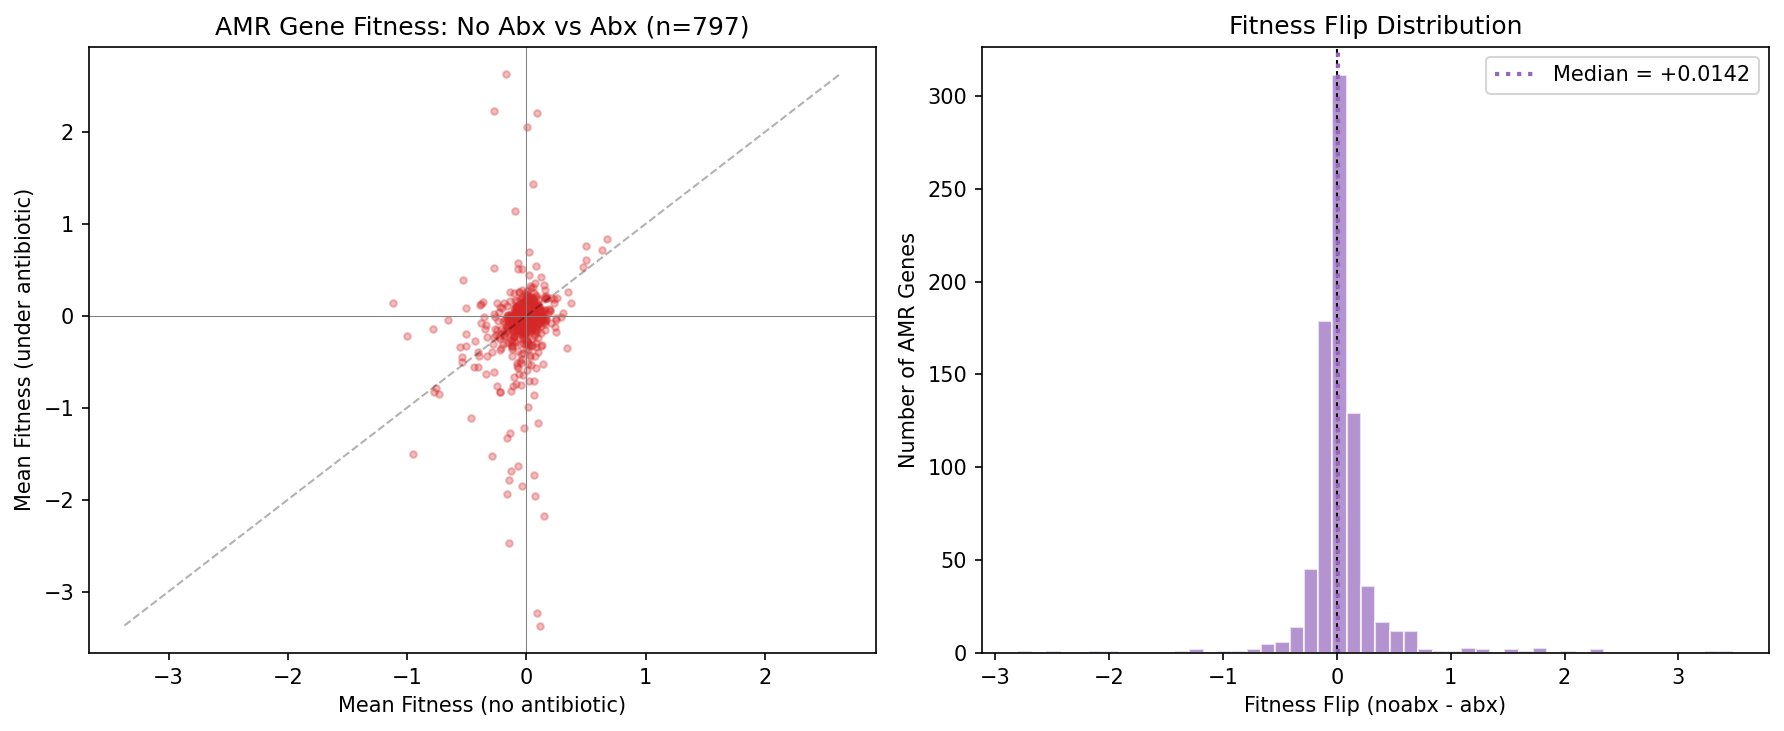 Scatter plot and histogram of fitness flip between antibiotic and non-antibiotic conditions. From amr_fitness_cost.
In the class-matched validation, 157 gene-antibiotic pairs across four resistance classes show a mean flip of +0.113, a flip rate of 54.8%, and Wilcoxon p = 0.14. Chloramphenicol resistance genes show the strongest validation, with 6/6 (100%) showing the expected flip. Beta-lactam resistance has 105 pairs across 10 organisms and a 50% flip rate. The report attributes this to many beta-lactam genes being tested against non-carbenicillin beta-lactams. It suggests that the non-significant class-matched result likely reflects small per-class samples after matching and heterogeneity across organisms, with some organisms showing strong flips and others near zero. These explanations are proposed, not established. A heatmap shows AMR-gene fitness under class-matched antibiotics. 1
The report interprets the contrast between baseline cost and antibiotic-dependent benefit as a decoupling: AMR mechanisms have similar modest costs without antibiotics, but broad-spectrum efflux systems become important under many antibiotic conditions whereas narrow-spectrum enzymes generally require matching antibiotics. 1
Resistance mechanism does not predict baseline cost
Baseline fitness cost does not differ significantly among efflux (N=254), enzymatic inactivation (N=304), metal resistance (N=144), and unknown (N=74) mechanisms. The Kruskal-Wallis test gives H = 0.65, p = 0.89, and the Jonckheere-Terpstra test for the predicted ordering efflux > enzymatic > metal > unknown gives z = 0.23, p = 0.41; no pairwise comparison survives FDR correction. This null result runs contrary to the report’s hypothesis H2. A box plot shows fitness stratified by mechanism. 1
The report proposes that the approximately +0.086 common cost may represent a residual metabolic overhead after compensatory evolution in lab-adapted RB-TnSeq strains, rather than the unmitigated cost of newly acquired resistance. The report further speculates that the uniform cost may be a “floor”: the irreducible metabolic overhead of maintaining any extra gene, regardless of its function. Both ideas are hypotheses consistent with the data, not directly measured processes. 1
Core and accessory AMR genes have similar costs
Core, or intrinsic, AMR genes (N=638) and accessory, or acquired, AMR genes (N=163) have virtually identical distributions: both have mean −0.024, Cohen’s d = 0.002, and Mann-Whitney U p = 0.33. The broader stratification table likewise reports no conservation difference (p = 0.33), no Tier 1-versus-Tier 2 difference (p = 0.26), and no antibiotic-versus-metal resistance-type difference (p = 0.87). A box plot compares core and accessory AMR-gene fitness. 1
The report interprets this null result as consistent with preferential horizontal transfer of cost-optimized genes or rapid compensation after acquisition, while noting that the evidence is strongest for well-sampled species such as K. michiganensis (399 genomes), B. thetaiotaomicron (287), and S. meliloti (241). The report offers these as interpretations, not demonstrated mechanisms. 1
Mechanism predicts conservation status but not cost
Mechanism is strongly associated with pangenome conservation status (χ² = 69.3, p = 1.4×10⁻¹³): 44% of metal-resistance genes are accessory, compared with 13% of efflux genes and 16% of enzymatic-inactivation genes. Thus, in this dataset, mechanism predicts where an AMR gene occurs in the pangenome but not its baseline fitness cost. An interaction plot shows mechanism by conservation. 1
Literature context
- The report cites Melnyk et al. (2015), which meta-analyzed ~600 resistance cost measurements and found costs in ~70% of cases, with a mean relative fitness of 0.91–0.95 (5–9% cost). Those are absolute fitness differences between isogenic resistant and sensitive strain pairs, whereas the report’s +0.086 is a relative difference between AMR and non-AMR transposon knockouts within pooled libraries. The two are on different measurement scales, so the report calls the comparison reassuring but not a direct equivalence. 1
- The report cites Vanacker, Lenuzza & Rasigade (2023), whose meta-analysis of fitness costs in E. coli found that horizontally transferred (plasmid-borne) resistance genes are less costly than chromosomal mutations. The report uses this to explain its modest estimate, proposing that many Fitness Browser AMR genes are likely acquired determinants such as beta-lactamases and acetyltransferases rather than costly target modifications. This explanation is an interpretation and was not tested. 1
- The report cites Olivares Pacheco & Alvarez (2017), who showed in P. aeruginosa that efflux pump costs are metabolic, arising from proton motive force drain, and are rapidly compensated through metabolic rewiring. The report uses this to explain why efflux genes show the same modest cost as other mechanisms, treating compensation as a “general outcome”. Applying a single-organism mechanism across organisms in this way is an extrapolation. 1
- The report cites Levin, Perrot & Walker (2000), who showed that compensatory mutations arise faster than reversion to susceptibility, which predicts that organisms maintain resistance at reduced cost. The report speculates that +0.086 may be the irreducible cost remaining after compensatory evolution: the minimum overhead of expressing a functional protein that provides no benefit without antibiotics. This idea is a hypothesis. 1
- The report cites Roux et al. (2015), who showed that resistance genes, particularly efflux pumps, can be beneficial in vivo by exporting host antimicrobials. On this basis, the in vitro cost measurement may overestimate the true ecological cost. This caveat points in the opposite direction from the lab-adaptation caveat below, which suggests that costs may be underestimated. 1
Data scope
The assembly identifies 1,352 AMR genes across 43 organisms (178 Tier 1, 1,174 Tier 2). Of these, 28 organisms have both AMR genes and fitness matrices, and 25 qualify for per-organism tests (≥5 AMR genes). Reported AMR-class counts include beta-lactam (44 T1), mercury (27), arsenic (22), and efflux_rnd (22). The analysis classifies 6,804 experiments: 2,868 carbon/nitrogen, 1,862 stress, 727 standard, 447 metal, and 443 antibiotic experiments. The five listed category counts do not add up to the stated 6,804 total, and the report does not explain the difference. It uses kbase_ke_pangenome tables bakta_amr and bakta_annotations, kescience_fitnessbrowser tables genefitness, gene, and experiment, the cross-project linkage file conservation_vs_fitness/fb_pangenome_link.tsv, which bridges Fitness Browser genes to pangenome clusters, and pre-cached fitness matrices reused from fitness_modules/matrices/*. The generated datasets are: an AMR-gene table of 1,352 rows with class, mechanism, conservation, and tier; 6,804 experiments classified by type; 801 per-gene mean-fitness rows under non-antibiotic conditions; 25 per-organism effect sizes with confidence intervals and p-values; 954 antibiotic-validation rows spanning class-matched and any-antibiotic conditions; and a 10-row stratification summary by mechanism, conservation, tier, and resistance type. 1
Figures
forest_plot_amr_fitness.png: per-organism effect sizes with 95% CIs and the pooled meta-analysis.amr_fitness_distribution.png: AMR gene fitness distribution, overall and by tier.amr_genes_per_organism.png: AMR gene counts per organism, colored by mechanism.antibiotic_validation.png: paired fitness scatter plot and histogram of the flip between antibiotic and non-antibiotic conditions.class_matched_heatmap.png: heatmap of AMR fitness under class-matched antibiotics.h2_mechanism_stratification.png: fitness by mechanism, with a Kruskal-Wallis test.h3_core_vs_accessory.png: core versus accessory fitness comparison.mechanism_x_conservation.png: mechanism × conservation interaction plot.fitness_by_mechanism_preview.pngandfitness_core_vs_accessory_preview.png: early mechanism and conservation previews from notebook NB02.stratification_overview.png: combined stratification panel covering tier, resistance type, and per-organism results. 1
Caveats
- All 25 tested organisms are lab-adapted strains. Laboratory compensation may have reduced measurable costs relative to wild strains, so the estimate may underestimate costs in natural populations. 1
- Tier 2 contains 86% of the AMR genes and is based on keyword matching from Bakta annotations, which may include non-AMR genes such as general efflux transporters; the Tier 1 sensitivity analysis gives consistent results. 1
- Matched antibiotic validation covers only four AMR classes: beta-lactam, aminoglycoside, chloramphenicol, and tetracycline. Macrolide, glycopeptide, and polymyxin resistance could not be validated. 1
- Approximately 4.6% of AMR genes are putatively essential and absent from fitness matrices. If these are the most costly AMR genes, +0.086 is a lower bound. 1
- RB-TnSeq measures fitness relative to the pool average. The +0.086 value is the difference between AMR knockout fitness (−0.024) and non-AMR knockout fitness (approximately −0.11), not an absolute selection coefficient; comparison with isogenic-strain literature is not a direct equivalence. 1
- Transposon insertions can have polar effects on downstream genes in operons, potentially confounding AMR-gene fitness measurements. 1
- The product classifier does not handle fosfomycin or tellurite resistance annotations, leaving approximately 25 genes in the unknown mechanism category; reclassification would move them to enzymatic inactivation and metal resistance, respectively. 1
- Core/accessory labels use a ≥95% prevalence threshold, but most Fitness Browser species have few GTDB genomes: the median is 9, with a range of 2–399. A gene present in all 9 sampled genomes may be mislabeled core at larger sampling depth, so the core-versus-accessory null result is especially cautious for species with fewer than 20 genomes. 1
- The class-matched analysis has only 157 pairs and is non-significant (p = 0.14) despite a mean flip of +0.113; the any-antibiotic analysis has greater power (N = 797, p = 0.0001). 1
Future Directions
- Test mechanism effects within organisms with many AMR genes, including Cup4G11 (77) and BFirm (50), while controlling for genetic background. 1
- Subclassify efflux pumps into narrow-spectrum drug pumps and general RND systems such as AcrAB-TolC, and test whether constitutively expressed systems have lower costs. 1
- Replace averages across non-antibiotic experiments with condition-specific analyses of metal, osmotic, and carbon-limitation stresses. 1
- Cross-reference the 144 metal-resistance genes with fitness data against the metal fitness atlas to test whether genes costly under standard conditions are protective under metal stress. 1
- Extend the analysis from 25 Fitness Browser organisms to all 293K KBase Data Lakehouse genomes by predicting AMR cost from gene-cluster conservation patterns. 1
Slots Into
- environmental-resistome — AMR gene conservation, mechanism-specific pangenome location, and the distinction between resistance retention and metabolic cost.
- condition-specific-fitness — the relative baseline burden of AMR genes and their increased importance under antibiotic exposure.
- gene-essentiality — the 4.6% putative essential rate among AMR genes and its comparison with the approximately 14% background rate. 1
- pangenome-integration — integration of Fitness Browser fitness measurements with pangenome core/accessory labels and the mechanism-by-conservation association.
- antimicrobial-resistance-fitness-cost — the pooled +0.086 relative baseline cost, the mechanism-independent costs, and the antibiotic-dependent flip, which together form the core evidence on what AMR genes cost. 1
- costly-dispensable-gene-loss — AMR knockouts are less detrimental than average knockouts, which marks AMR genes as relatively dispensable burdens.
- condition-dependent-gene-tradeoffs — the switch from slight burden without antibiotics to slight importance under antibiotics, strongest for broad-spectrum efflux.
- pangenome-conservation-fitness-decoupling — core and accessory AMR genes have identical costs, even though mechanism strongly predicts conservation status.
- pangenome-core-boundary-and-clade-size-bias — sparse GTDB sampling (median 9 genomes) makes the ≥95% core designation imprecise for most Fitness Browser species. 1
- transposon-callability-bias — putatively essential AMR genes are missing from the fitness matrices, polar effects arise in operons, and the report argues that low essentiality reduces concern about right-censoring.
- laboratory-fitness-versus-natural-selection — lab-adapted strains, the in vivo benefits of efflux noted by Roux et al., and the gap between isogenic-strain and pooled-knockout measurement scales.
- chromosomal-and-integrative-gene-transfer — the cited finding that horizontally transferred resistance genes are less costly than chromosomal mutations.
- functional-marker-validation — keyword-based Tier 2 AMR annotation checked against Tier 1 with a sensitivity analysis.
- fitness-condition-coverage-prioritization-bias — matched antibiotic experiments exist for only four AMR classes.
- ontology-and-category-schema-sensitivity — fosfomycin and tellurite annotations are missing from the mechanism classifier, which inflates the unknown category.
- phylogenetic-confounding-of-pangenome-associations — the proposed within-organism mechanism tests are designed to remove phylogenetic confounding.
- metal-cross-resistance — the proposed cross-reference of metal-resistance genes against the metal fitness atlas under metal stress.