Projects in this corpus approach pangenome structure at two scales. Pangenome openness describes how far a species keeps gaining new genes as more genomes are sampled. The core genome is the set of genes shared across a clade’s genomes, and auxiliary genes are those that vary. The source wiki page records a refinement rather than a contradiction: the openness analysis reports null correlations at the species level, while the conservation analyses compare gene categories within sampled clades 1,2,3. It remains open why openness fails to predict whether environment or phylogeny dominates a species’ gene content 1. Here phylogeny means evolutionary relatedness. The null might reflect a coarse metric or low statistical power, meaning a reduced ability to detect a relationship that exists. If so, it should not be read as evidence that pangenome structure is ecologically uninformative. The framing comes from pangenome-core-boundary-and-clade-size-bias.
Evidence Sides
Side A — Species-level openness shows null correlations. The openness analysis found null correlations between pangenome openness and the species-level effect sizes of environment and of phylogeny 1,2,3. Effect sizes are measures of the magnitude of each effect. This is a null result, not a demonstrated absence of any relationship. The analysis does not establish why openness fails to predict ecological dominance 1.
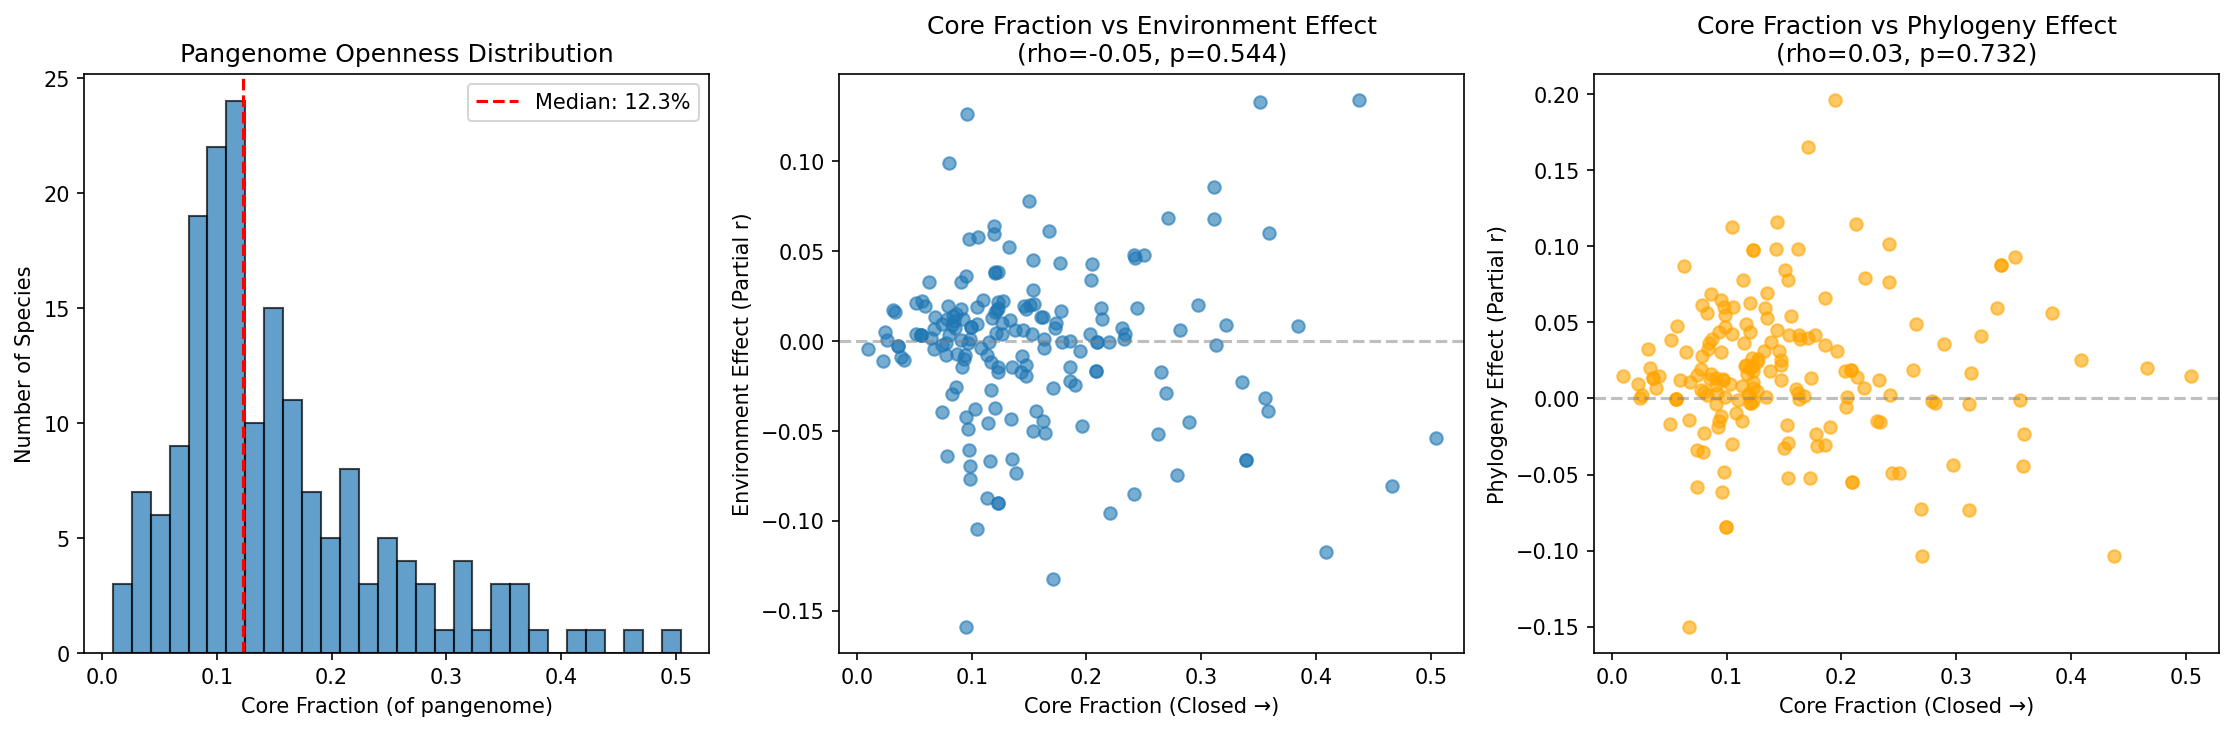 Pangenome Openness vs Effects. From pangenome_openness.
Side B — Within-clade conservation analyses compare gene categories. The conservation analyses work at a different scale. They compare gene categories, such as genes grouped by fitness importance, inside sampled clades, rather than relating a whole-species openness metric to environment or phylogeny effect sizes 1,2,3. On this reading, the species-level null leaves the within-clade conservation findings intact but limits how far they can be generalised 1,2,3.
Possible Reconciliations
- Hypothesis 1 (coarse metric): Openness may be too coarse a single species-level summary to register ecological dominance 1.
- Hypothesis 2 (functional concentration): The relevant adaptation may be concentrated in particular functional categories. Category-level contrasts like those in the conservation analyses could detect it, while a whole-pangenome openness metric would dilute it 1.
- Hypothesis 3 (limited power): The openness analysis may have lacked the statistical power to detect a real but modest relationship 1.
The question remains unresolved 1.
Resolving Work
- Category-split openness: Use the KBase Data Lakehouse pangenome clusters to compute openness separately within functional categories, for example by COG (Clusters of Orthologous Groups) class. Then re-test the correlation with environment and phylogeny effect sizes. This asks whether adaptation is concentrated in particular categories.
- Power analysis: Simulate openness–effect-size relationships of varying strength at the species count actually sampled. This asks whether the null result reflects limited power.
- Alternative metrics: Replace the single openness summary with finer descriptors. Accessory-gene turnover is the rate at which variable genes are gained and lost between genomes. A gene-frequency spectrum is the distribution of how many sampled genomes carry each gene. Compare the association of these descriptors with ecological dominance. This asks whether the original metric is too coarse.
- Matched-scale comparison: For clades used in the conservation analyses, compute both within-clade category contrasts and species-level openness on the same genome sets. This asks whether the two scales disagree once genome sampling is held fixed.