Raw report: amr_environmental_resistome Feeds into: antimicrobial-resistance-fitness-cost, cultivation-collection-bias-in-ecological-genomics, environment-embedding-geography, environmental-resistome, homology-search-negative-evidence, multi-omics-integration, pangenome-core-boundary-and-clade-size-bias, pangenome-integration, phylogenetic-confounding-of-pangenome-associations, resistance-island-coinheritance, scale-dependent-mobile-element-associations
Overview
This report analyzes antimicrobial-resistance (AMR) gene clusters across 14,723 bacterial species and 293K genomes using the KBase KE pangenome collection. It finds that ecological niche is associated with AMR diversity, core/accessory composition, and resistance-mechanism composition, with clinical and human-gut species carrying more predominantly acquired AMR than soil and aquatic species. The associations persist under phylum- and family-level phylogenetic controls, although the study is observational and subject to sampling, classification, and annotation limitations. 1
Key Findings
1. Clinical species carry more AMR gene clusters
Clinical-source species had a median of 5 AMR gene clusters, compared with 2 for soil, aquatic, and host-associated species, a 2.5× difference (Kruskal–Wallis H = 781.9, p = 9.4×10⁻¹⁶⁷, η² = 0.056). Human-gut species also had a median of 5. Of 15 pairwise environment comparisons, 13 were significant after false-discovery-rate (FDR) correction; the largest effect was clinical versus aquatic (rank-biserial r = −0.49). The association held at 50%, 60%, 75%, and 90% majority-vote environment-classification thresholds, with η² = 0.044–0.056. The analysis extends the approximately 6,000-genome ecology-resistome result of Gibson et al. (2015) to 14,723 species across 293K genomes. The report presents this result in a figure of AMR diversity by environment. 1
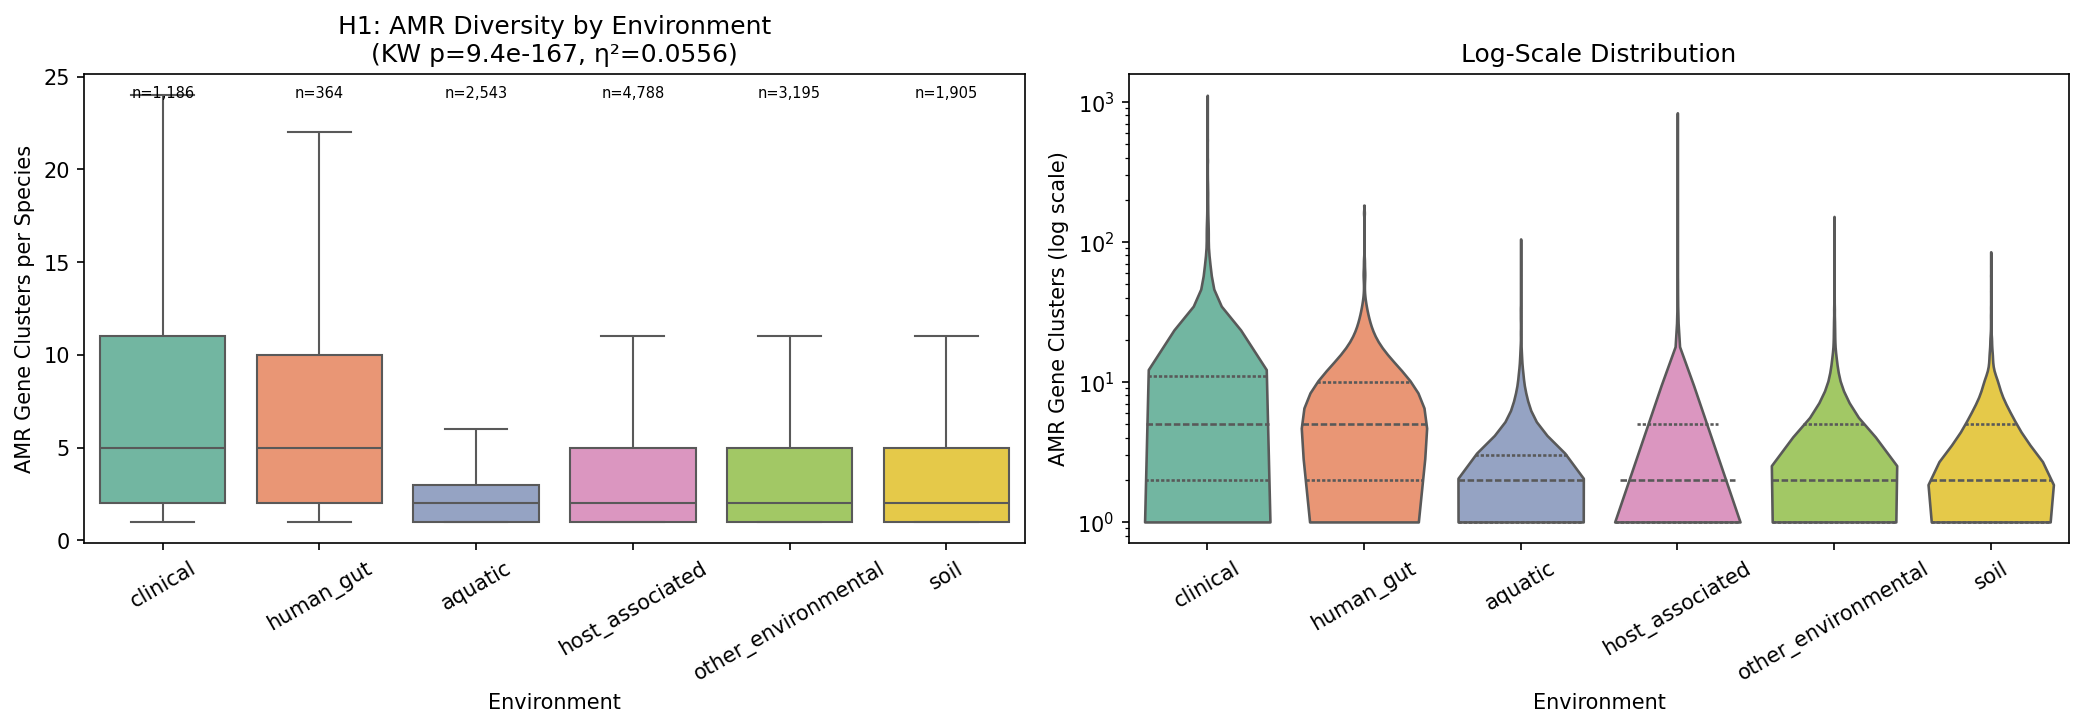 AMR diversity by environment. From amr_environmental_resistome.
2. Clinical and gut resistomes are predominantly accessory
Clinical species had 68% accessory AMR, compared with 43% in soil species (Kruskal–Wallis H = 506.0, p = 4×10⁻¹⁰⁷, η² = 0.036). Mean core and accessory AMR fractions were: soil 57.1% and 42.9%; aquatic 54.4% and 45.6%; host-associated 49.7% and 50.3%; other environmental 40.4% and 59.6%; clinical 32.4% and 67.6%; and human gut 19.7% and 80.3%, respectively. The report interprets core AMR as predominantly chromosomally encoded and intrinsic, and accessory AMR as predominantly mobile and acquired, consistent with the cited river-metagenome result from Jiang et al. (2024). This rests on analogy to that study; the report does not establish chromosomal or mobile status for every cluster here. A figure shows core versus accessory AMR by environment. 1
3. Resistance-mechanism composition depends on environment
All four tested mechanisms showed significant environment-dependent composition (all q ~ 0 after Benjamini–Hochberg FDR correction). In the report’s headline summary, metal resistance made up 45% of AMR in aquatic species, 44% in soil species, and only 6% in human-gut species (η² = 0.107, the largest reported effect), and target modification made up 44% in human-gut species, 28% in clinical species, and only 6% in aquatic species (η² = 0.100). The report’s mechanism table gives these values to one decimal place. The complete table fractions were: efflux, clinical 6.1%, human gut 7.0%, host-associated 3.7%, soil 2.0%, aquatic 1.1%, and other environmental 2.7% (η² = 0.055); enzymatic inactivation, 28.2%, 24.1%, 44.1%, 34.3%, 41.2%, and 33.6% (η² = 0.019); metal resistance, 19.7%, 6.1%, 12.7%, 44.0%, 45.0%, and 24.9% (η² = 0.107); and target modification, 27.5%, 43.6%, 22.8%, 10.1%, 6.2%, and 25.1% (η² = 0.100), in the same environment order. A figure shows AMR mechanism composition by environment. 1
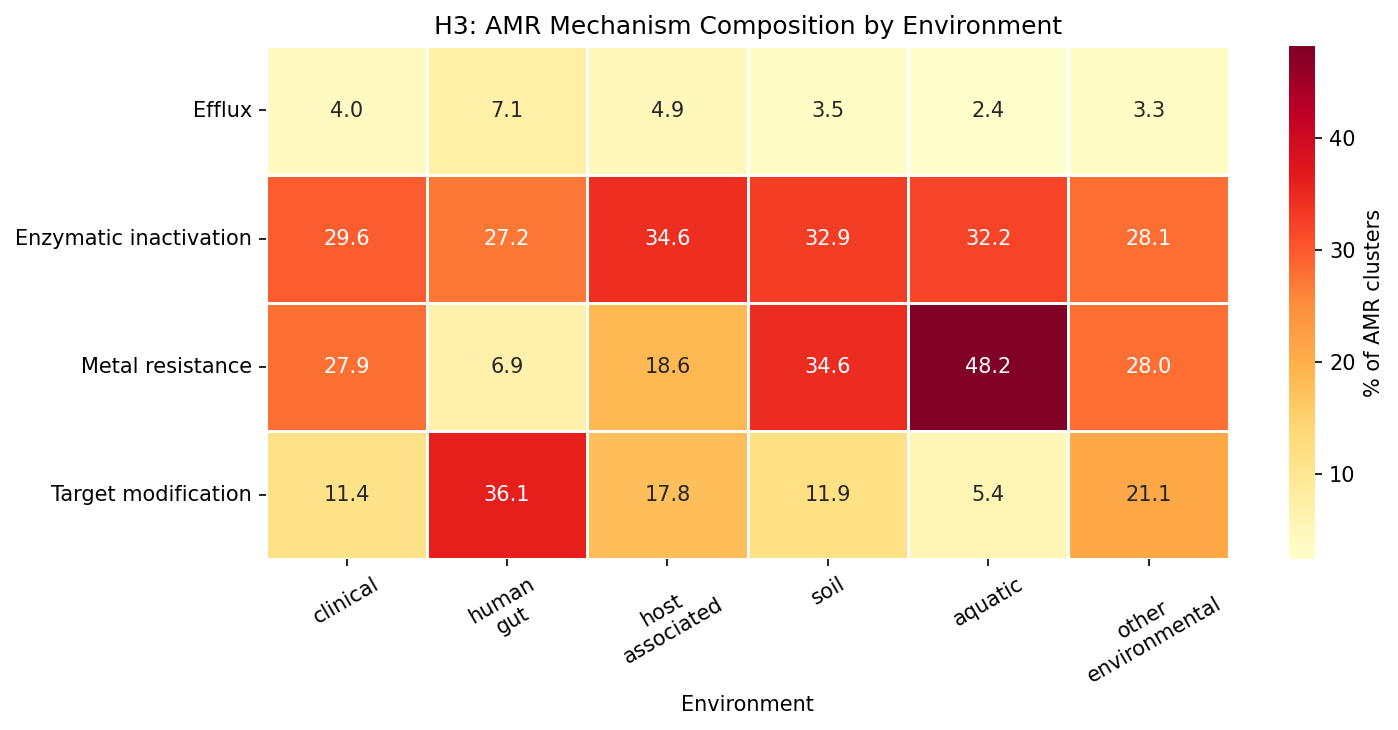 Mechanism composition by environment. From amr_environmental_resistome.
The report interprets soil and aquatic enrichment for metal resistance as consistent with natural heavy-metal exposure, and clinical and gut enrichment for target modification and, to a lesser extent, efflux as consistent with antibiotic selection pressure. It connects this pattern to the reported mechanism-conservation result that metal resistance was 44% accessory whereas efflux was 13% core, proposing that efflux genes serve host-associated organisms across conditions while metal-resistance genes vary with metal exposure. This ecological explanation is an interpretation rather than a causal test. 1
The report’s interpretation section is internally inconsistent with its own results, and the source does not resolve this. It states that soil and aquatic bacteria invest heavily in metal resistance (44-45% of AMR) and that these genes are more often core (intrinsic), whereas the mechanism-conservation link above describes metal resistance as 44% accessory. The same section gives clinical and gut efflux fractions of 15-21% and target-modification fractions of 19-29%, which conflict with the mechanism table’s clinical and human-gut values of 6.1% and 7.0% for efflux and 27.5% and 43.6% for target modification. 1
Two more interpretive statements conflict with the reported numbers. First, the interpretation calls enzymatic inactivation (e.g., beta-lactamases) the most uniformly distributed mechanism, present in all environments but not dominant in any. However, the mechanism table gives it the largest listed fraction in the clinical (28.2%), host-associated (44.1%), and other environmental (33.6%) categories. Second, the literature-context passage attributes the earlier finding that resistomes cluster by ecology in ~6,000 genomes to Gibson, Forsberg & Dantas (2015; PMID: 25003965). It then says this project’s mechanism decomposition shows efflux and metal resistance to be the most environment-discriminating mechanisms. The reported effect sizes instead rank metal resistance (η² = 0.107) and target modification (η² = 0.100) above efflux (η² = 0.055). The source does not reconcile either discrepancy, and the table values and effect sizes are the measured results. 1
Of the AMR clusters, 15,550 (18.7%) could not be assigned to a mechanism from gene name or product annotation and were excluded from mechanism fractions. Tetracycline-resistance genes were divided between efflux (tet(A-E,K,L)) and target modification (tet(M,O,Q,W) ribosomal-protection proteins). 1
4. Clinical representation predicts AMR within species
Among 823 species with genomes in at least 2 environments and at least 5 genomes each, the fraction of genomes from clinical sources predicted total AMR cluster count (Spearman rho = 0.465, p = 2.2×10⁻⁴⁵). Clinical-dominated species had a mean of 72.9 AMR clusters versus 16.4 in environmental-dominated species, a 4.4× difference (Mann–Whitney U test p = 2×10⁻¹⁸), and had a higher grouped accessory fraction (93.6% versus 81.7%, p = 0.004). The continuous correlation between clinical fraction and accessory percentage was borderline (rho = 0.065, p = 0.064). This is a species-level proxy, not a true per-genome within-species comparison; the report says the latter would require billion-row joins. A figure shows within-species AMR by environment for this proxy analysis. 1
Deeply sampled case studies were: Klebsiella pneumoniae, 13,637 genomes, 1,115 AMR clusters, 7 core and 1,108 accessory (99%), clinical-dominant at 80%; Staphylococcus aureus, 13,274 genomes, 642 clusters, 9 core and 633 accessory (99%), clinical-dominant at 85%; Salmonella enterica, 10,097 genomes, 836 clusters, 11 core and 825 accessory (99%), host-associated-dominant at 31%; Streptococcus pneumoniae, 7,944 genomes, 59 clusters, 1 core and 58 accessory (98%), clinical-dominant at 99.6%; and Mycobacterium tuberculosis, 6,673 genomes, 44 clusters, 4 core and 40 accessory (91%), clinical-dominant at 98%. K. pneumoniae had only 7 core clusters among 1,115, illustrating extensive accessory AMR variation in a clinically dominated species. 1
5. Environment effects persist after phylogenetic control
At the phylum level, 5 of 6 major phyla—Pseudomonadota, Bacillota_A, Actinomycetota, Bacteroidota, and Bacillota—showed significant within-phylum environment effects on AMR; Chloroflexota was non-significant. Bacteroidota had the largest within-phylum effect (η² = 0.130). At the family level, 20 of 141 testable families (14%) showed significant within-family environment effects after FDR correction; the strongest listed results were Enterobacteriaceae (q = 3×10⁻²¹), Bacteroidaceae (q = 1.3×10⁻¹⁷), Lachnospiraceae (q = 2.5×10⁻¹²), and Pseudomonadaceae (q = 3.9×10⁻¹²). These results support an ecological association that is not solely a proxy for phylogeny, while most families lacked enough environmental breadth for testing. 1
6. Continuous environmental embeddings support the discrete analysis
Among 2,659 species with both AMR data and AlphaEarth environmental embeddings, 52 of 64 embedding dimensions significantly correlated with AMR diversity at FDR < 0.05; the top dimension was A34 (rho = +0.24). A Mantel test found that environmental distance, measured as cosine distance between embeddings, predicted AMR-profile distance, measured as Bray–Curtis distance between mechanism fractions (r = 0.098, p = 0.001). Stratified correlations were strongest for clinical species (r = 0.177), moderate for soil (r = 0.129), and weakest for aquatic species (r = 0.061). The report treats this as supplementary confirmation with limited interpretability because embedding dimensions are opaque and coverage was 28% of genomes. A supplementary figure presents the AlphaEarth analysis. 1
Literature Context
The report compares its results with earlier studies, but these comparisons are interpretations rather than tests run here. It attributes to Gibson, Forsberg & Dantas (2015; PMID: 25003965) the finding that resistomes cluster by ecology in ~6,000 genomes, and describes its own analysis as replicating this at 50× scale (14,723 species) with mechanism-specific decomposition. It attributes to Forsberg et al. (2014; PMID: 24847883) the finding that soil resistomes are structured by phylogeny with rare mobility elements. It reads its own soil-core versus clinical-accessory pattern as matching chromosomal soil resistance and mobile clinical resistance. It attributes to Surette & Wright (2017; PMID: 28657887) the claim that the environment is the largest resistance reservoir. On that basis, it proposes that soil species’ fewer, more intrinsic AMR genes represent an ancient baseline resistome, with clinical enrichment above that baseline reflecting anthropogenic antibiotic selection. It attributes detection of antibiotic-resistance genes in pristine Antarctic soils to Van Goethem et al. (2018; PMID: 29471872). It reads its finding that soil species average 2 AMR clusters (mostly core) as consistent with a baseline ancestral resistome maintained without antibiotic exposure. These baseline and selection explanations are hypotheses, not results of this analysis. 1
Null/untested: this project did not test whether soil and clinical-pathogen resistance genes share perfect nucleotide identity. The report attributes that earlier observation to Forsberg et al. (2012; PMID: 22936781) and notes only that its pangenome framework could identify such shared clusters. 1
Data Assembly and Statistical Results
The assembled data contained 82,908 AMR gene clusters across 14,723 species out of 27,700 total species; 280,337 genomes had NCBI environment metadata, of which 93.5% were classified per genome. Species-level majority-vote environment classifications covered 95% of species (13,981 species). A total of 884 species qualified for the initial within-species criterion of at least 5 genomes in at least 2 environments, while the reported within-species analysis included 823 species; the report does not explain the difference between these two denominators. Mechanism classification assigned 26,220 clusters to enzymatic inactivation, 22,223 to metal resistance, 11,067 to target modification, and 5,224 to efflux. 1
The reported Kruskal–Wallis tests were: AMR count by environment, H = 781.9, p = 9.4×10⁻¹⁶⁷, η² = 0.056; core AMR percentage by environment, H = 506.0, p = 4×10⁻¹⁰⁷, η² = 0.036; metal resistance, H = 1498.4, p ~ 0, η² = 0.107; target modification, H = 1394.9, p = 1.7×10⁻²⁹⁹, η² = 0.100; efflux, H = 768.0, p = 9.8×10⁻¹⁶⁴, η² = 0.055; and enzymatic inactivation, H = 266.0, p = 2.0×10⁻⁵⁵, η² = 0.019. 1
The analysis used the kbase_ke_pangenome collection (kbase-ke-pangenome) and its bakta_amr, gene_cluster, pangenome, ncbi_env, genome, gtdb_taxonomy_r214v1, and alphaearth_embeddings_all_years tables. These supplied AMR gene clusters, species structure, environment metadata, phylogeny, and continuous environment embeddings. Generated output files and their row counts were: data/species_amr_profiles.csv, 14,723 rows (species-level AMR summary with environment and taxonomy); data/species_environment.csv, 26,715 rows (species majority-vote environment classification); data/genome_environment.csv, 280,337 rows (per-genome environment classification from ncbi_env); data/pairwise_environment_comparisons.csv, 15 rows (pairwise Mann–Whitney U tests between environments); data/mechanism_by_environment.csv, 4 rows (Kruskal–Wallis results per mechanism); data/stratified_phylum_results.csv, 6 rows (within-phylum environment tests); data/family_level_environment_test.csv, 141 rows (within-family environment tests); data/within_species_amr_environment.csv, 823 rows (within-species clinical fraction versus AMR); and data/alphaearth_amr_correlations.csv, 64 rows (per-dimension embedding–AMR correlations). 1
The report’s figures are nb01_validation.png (data validation: AMR distribution and environment coverage), h1_amr_by_environment.png (AMR cluster count by environment, boxplot and violin), h2_core_accessory_by_env.png (core versus accessory AMR fraction by environment), h3_mechanism_by_environment.png (mechanism-by-environment composition heatmap), h4_within_species.png (clinical fraction versus AMR count and accessory fraction), and nb04_alphaearth.png (embedding-dimension correlations and the Mantel-test null distribution; the caption states no negative result). 1
Caveats and Unperformed Analyses
Environment and phylogeny remain deeply entangled despite family-level controls. Some families are nearly entirely clinical, only 14% of tested families showed significant within-family effects, and most families do not span enough environments to be tested. NCBI sampling strongly overrepresents clinical isolates, while soil and aquatic species are undersampled, potentially inflating the clinical-versus-environmental contrast. Majority-vote species classifications collapse within-species variation, although sensitivity analyses at 60–90% thresholds partly mitigate this issue. 1
AMRFinderPlus-focused annotation may underestimate novel environmental resistance and bias results toward clinical enrichment, where resistance genes are better characterized. The 95% prevalence threshold for core AMR is dependent on species genome count, so core/accessory labels are imprecise for sparsely sampled species. The association is correlational: clinical exposure could increase AMR, AMR could contribute to clinical isolation, or both could reflect virulence-resistance co-selection. 1
Effect sizes were modest despite very small p-values: environment explained 2–13% of variance in AMR composition (η² = 0.02–0.13), while phylogeny likely explains more. The 18.7% of clusters (15,550) lacking mechanism assignments were excluded from the H3 mechanism fractions, which may bias mechanism comparisons if unclassified clusters are distributed non-randomly across environments. 1
Planned but unperformed analyses included PCoA ordination, PERMANOVA, environment-specific gene identification, metagenome-assembled genome/isolate assessment, and an archaea-specific analysis. The originally planned per-genome Fisher’s exact test was replaced by the species-level within-species proxy because billion-row joins were computationally costly. 1
Proposed Future Work
The report proposes several follow-ups but has not performed them. Identifying AMR gene clusters present in both soil and clinical species would yield candidates for recent cross-niche horizontal gene transfer (cf. Forsberg et al. 2012), not demonstrated transfer events. For species with genomes sampled across decades (e.g., S. aureus, K. pneumoniae), a temporal analysis would test whether the accessory AMR fraction has increased over time; no such increase is established here. Combining these environment-AMR profiles with Fitness Cost of Antimicrobial Resistance Genes would test whether clinically enriched AMR genes are costlier (because recently acquired) or cheaper (because under strong selection); this remains untested. 1
Community-level validation is also only proposed. nmdc-arkin metagenome taxonomic profiles could be used to infer community AMR load from pangenome-derived species AMR profiles, validating the species-level findings in real environmental communities. A test of whether accessory AMR clusters in clinical species are preferentially associated with plasmids, transposons, or integrative elements is likewise only proposed, not reported as a finding. 1
Slots Into
- pangenome-integration — adds a 14,723-species, 293K-genome demonstration that pangenome-scale core/accessory AMR composition varies with ecological environment. 1
- multi-omics-integration — provides environmental embeddings and mechanism-level AMR profiles as an ecological integration layer, while showing that continuous embedding dimensions have limited interpretability.
- condition-specific-fitness — supplies environment-associated AMR mechanism and conservation patterns that can motivate tests of whether resistance costs and persistence differ across ecological niches.
- environmental-resistome — provides the central synthesis of environment-structured AMR diversity, mechanism composition, and within-species clinical enrichment.
- antimicrobial-resistance-fitness-cost — links the mechanism-conservation result (metal resistance accessory, efflux core) to ecology, although the report’s own interpretation disagrees about whether metal resistance is core or accessory.
- phylogenetic-confounding-of-pangenome-associations — within-phylum and within-family tests show environment effects that persist in some lineages, but only a minority of families had significant within-family effects.
- environment-embedding-geography — AlphaEarth embeddings correlate with AMR diversity and profile distance but add limited interpretability at partial genome coverage.
- ontology-and-category-schema-sensitivity — a substantial share of AMR clusters lacked mechanism assignments, and tetracycline genes were split across mechanism categories.
- scale-dependent-mobile-element-associations — the core-intrinsic versus accessory-acquired reading is an analogy to river-metagenome work rather than a per-cluster mobility test; a test of accessory-cluster association with plasmids, transposons, or integrative elements is only proposed.
- cultivation-collection-bias-in-ecological-genomics — NCBI overrepresentation of clinical isolates and undersampling of soil and aquatic species may inflate the clinical AMR enrichment.
- homology-search-negative-evidence — AMRFinderPlus targets known resistance genes, so low environmental AMR counts may partly reflect undetected novel resistance.
- pangenome-core-boundary-and-clade-size-bias — the 95% prevalence core threshold makes core/accessory AMR labels imprecise for species with few genomes.