Within-species gene-content ecotypes are groups of genomes clustered by accessory (strain-variable) gene-content differences 1. This hub asks whether environment shapes which genes bacteria carry, and where any such signal sits. The corpus pairs one broad test with many targeted ones. The broad test covers 172 species and finds that phylogeny (evolutionary relatedness among genomes) generally outweighs environment for whole-genome gene content 2. The targeted tests examine functional categories, pathways, marker genes and plant-associated lineages 1,3,4. The page has three sections: what the corpus shows, its tensions, and a reading path.
Literature Context
Ecotype theory treats ecologically distinct populations, not named species, as the units carrying species’ defining properties. Their divergence is periodically purged by selection, and a typical named species contains many ecotypes (PMID 12142474). Several case studies tie ecological differentiation to specific traits:
- Synechococcus: temperature ecotypes differ in photoprotection, and the ocp gene is most prevalent in low-temperature niches (PMID 34518213).
- Streptomyces: salt-lake strains expressed ectA-D more highly than salt-mine strains, in a study of only 38 strains (PMID 27596681).
- Bifidobacterium longum: glycoside hydrolase profiles track subspecies ecology across 28 genomes (PMID 26275230).
- Salinispora: comparative genomics suggests some natural products are ecotype-defining traits while others appear selectively neutral (PMID 27491886).
- Prochlorococcus: high-light clade II resolves into surface, transition and deep subclade groups with different core and accessory genes, based on 31 strains (PMID 35285694). Broader picocyanobacterial genomics ties phylogenetically distinct ecotypes to light and nutrient niches (PMID 19487728).
- Escherichia coli: host- and niche-specific lineages are described as intragenotypic specialism, meaning specialization among strains of one genetic type, within a species complex (PMID 33789061).
Other work finds gene-content variation with little functional divergence. In four Death Valley Bacillus subtilis isolates plus strain W23, no strain-unique gene added a metabolic subsystem absent from the others. The authors propose a “nanoniche” model, in which ecotypes use the same resources in different proportions (PMID 24907327). In natural Mediterranean SAR11 populations, the core genome made up ~81% of a complete genome. The flexible genome was highly functionally redundant, which the authors argue preserves genetic variation within the population under variable conditions (PMID 39905490). Within a single soil Curtobacterium ecotype, by contrast, population structure reflected both isolation by environment and isolation by distance, with distinct populations co-occurring at the same sites (PMID 31662456).
The corpus’s broad result is novel in scale relative to these single-lineage studies: across 172 species, phylogeny generally outweighed environment for whole-genome gene content, and 90.7% of species showed no significant environmental effect. Its finding that adaptive COG categories differentiate more than housekeeping ones is consistent with the trait-specific cases above, as are its targeted signals in acdS, carbon pathways and prophage modules. Its largest functional effects correspond to about 3–4 percentage point differences in COG category proportions between ecotypes. The Curtobacterium evidence for both isolation by distance and isolation by environment bears on the corpus caveat that sampling coordinates may not capture an organism’s microenvironment (environment-embedding-geography). A partial tension exists with the sequence-based expectation that named species contain many distinct ecotypes (PMID 12142474). Corpus gene-content ecotypes were soft, with a mean silhouette of 0.215, and plant-association subclade segregation was weakly supported in only 5 of 17 testable species. These are different feature spaces, so this is not a direct contradiction. It does suggest that ecotype boundaries visible in marker or core-gene phylogenies may not appear as sharp accessory-gene clusters (ecotype-clustering-validity). The host-specialized Xanthomonas species fit the E. coli niche-specificity picture more closely, though that evidence is lineage-specific.
What the Corpus Shows
The genome-wide environmental signal is weak, and harmonizing the metadata does not rescue it.
- Baseline. A partial correlation is the association between two distance matrices after controlling for a third. Median partial correlations were 0.0025 for environment and 0.0143 for phylogeny. Phylogeny dominated in 60.5% of species, and 156 species (90.7%) showed no significant environmental effect 2.
- Clinical-bias proposal. AlphaEarth embeddings are satellite-derived numerical vectors summarizing context at a genome’s sampling coordinates. The embedded subset was 38% human-associated. Mean cosine distance between embeddings rose from pairs below 100 km apart to pairs above 10,000 km apart by 3.4× for environmental samples versus 2.0× for human-associated ones, prompting the proposal that interchangeable urban clinical settings dilute the signal 5.
- The reanalysis contradicts that proposal. Environmental species had a median partial correlation of 0.051, versus 0.084 for human-associated species. The one-sided test gave U=1536 and p=0.83, opposite to the hypothesis 6.
- Pangenome openness. Openness, how much new gene content keeps appearing as more genomes are sampled, showed no significant relationship with the environment effect (Spearman rho = -0.05, p-value = 0.54) within the limited species set having both analyses 7.
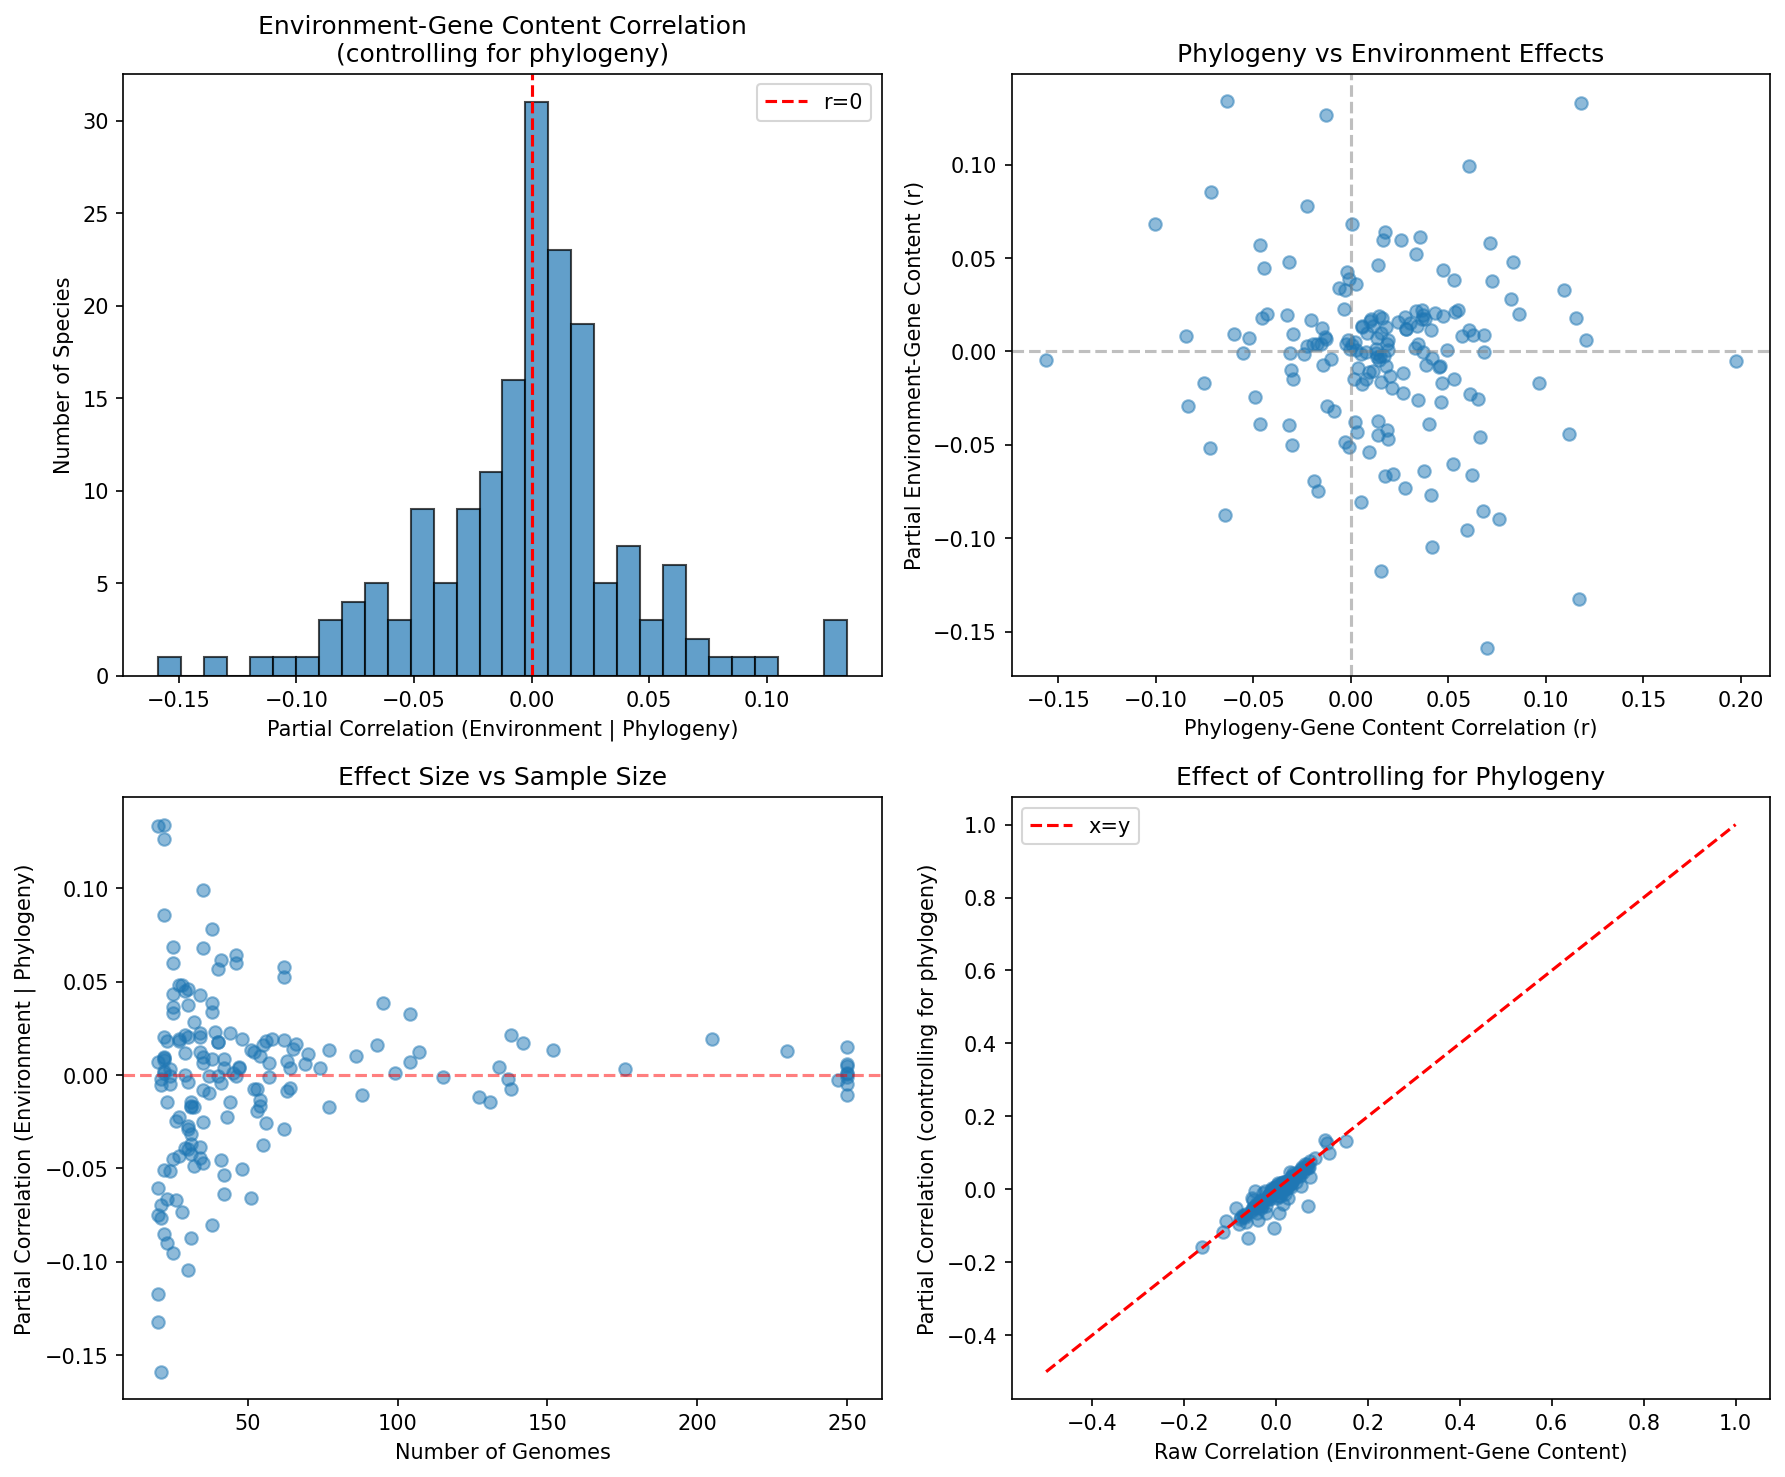 Ecotype correlation summary. From ecotype_analysis.
Differentiation is concentrated in particular functions, and its magnitude is small.
- Ecotypes differ in function. Comparing COG (Clusters of Orthologous Groups) functional profiles, 170 of 257 tests (66.1%) were significant at q < 0.05 after Benjamini–Hochberg false-discovery-rate (FDR) correction, which controls the expected proportion of false positives among declared discoveries 1.
- Adaptive over housekeeping. Significance rates were 79.8% versus 68.8%, and mean effect sizes 0.0136 versus 0.0064, a 2.13x ratio (one-sided Mann–Whitney p = 2.53 x 10^-6) 1.
- Modest effects. The largest correspond to “~3-4 percentage point differences in COG category proportions between ecotypes” 1.
- Fit with the null. This refines rather than contradicts the null, suggesting the hypothesis that ecology acts on gene subsets rather than whole-genome similarity, a framing credited to Polz et al. (2013) 2.
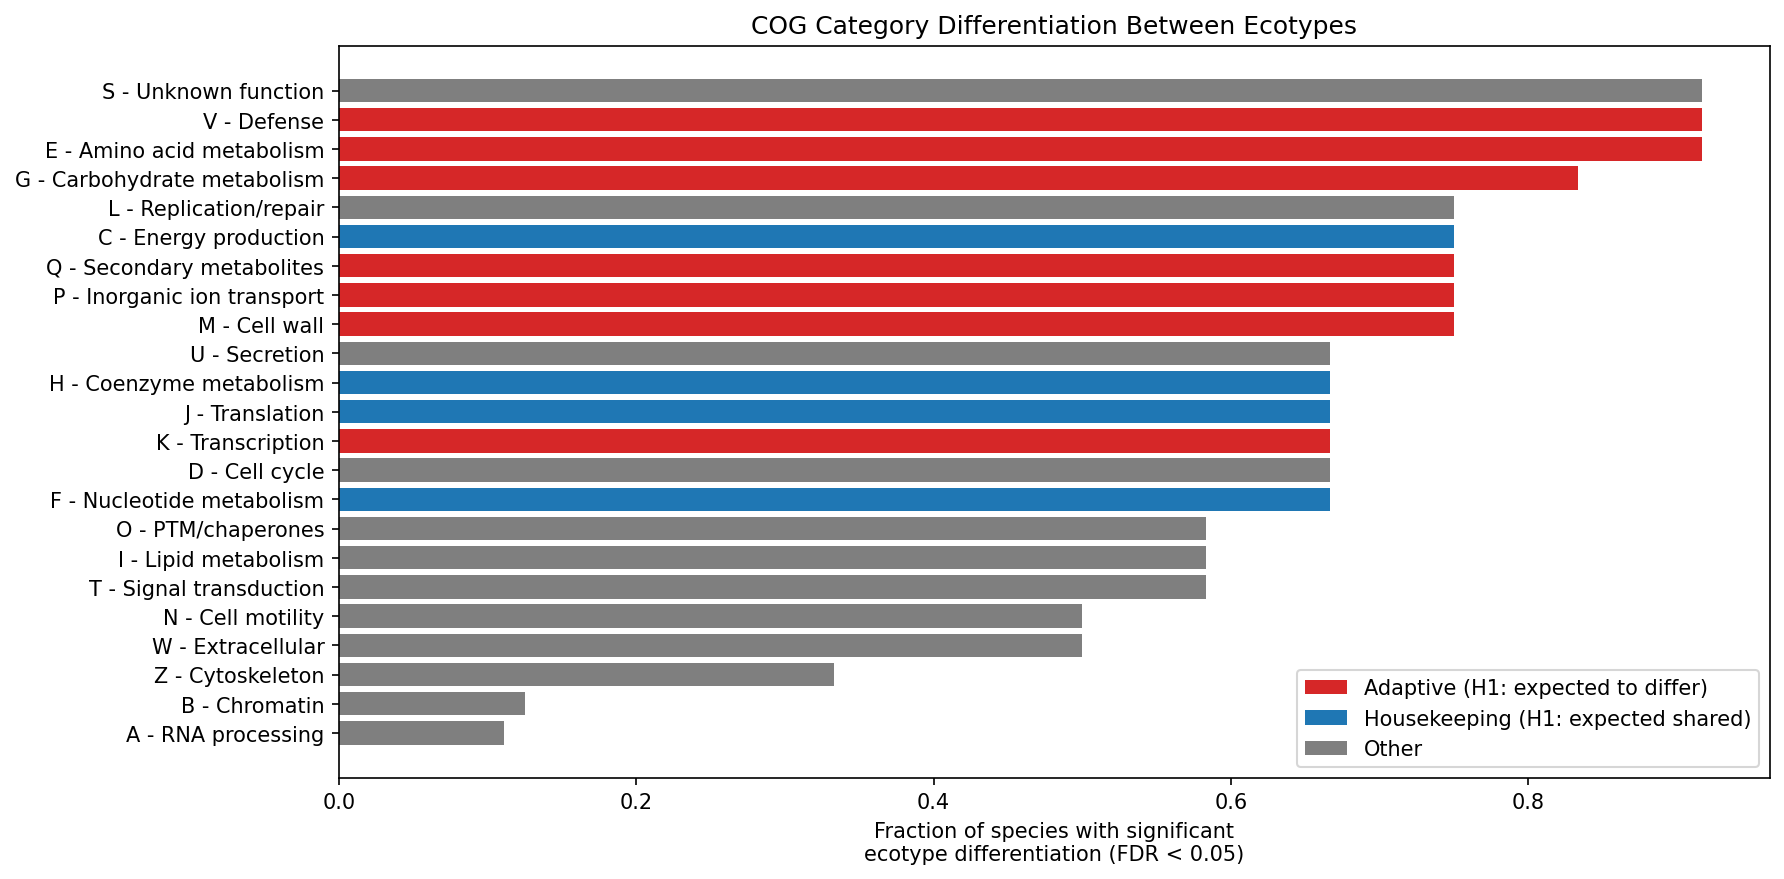 COG differentiation rates by category, colored by adaptive (red) vs housekeeping (blue) vs other (gray). From ecotype_functional_differentiation.
Targeted analyses refine the broad null, though they are not matched to it.
- Plant-growth-promoting (PGP) genes. acdS was enriched in soil/rhizosphere species (odds ratio, OR = 7.02, q = 5.1e-62) and survived phylum fixed effects (OR = 6.98) 3.
- Soil metals. Across 51,748 soil samples, 2,355 COG–metal associations were significant at FDR < 0.05; these are observational and confounded by co-contamination 8.
- Pseudomonas carbon pathways. Among 54 free-living and plant-associated species with >= 5 genomes and >= 60% majority environment agreement, carbon-pathway profiles were associated with isolation environment (999-permutation p = 0.006). A classifier on 51 species in small, uneven habitat classes reached balanced accuracy 0.408 +/- 0.169 against a 0.250 chance baseline 9.
- Prophage modules. A prophage is a phage genome integrated into a bacterial chromosome; a module is a functional group of its genes. Module composition was environmentally structured (F=30.04) after accounting for genome-size quartile (F=212.99) and family-level phylogeny (F=6.17) 10.
Ecotype clusters are mostly overlapping, and apparent sharpness depends on features and method.
- Gene-content clustering is soft. A silhouette score measures how much closer a genome sits to its own cluster than to the nearest other one. Gene-content ecotypes had mean 0.215 and median 0.174 1.
- Resistance genes. Among 974 species with at least 15 genomes, antimicrobial-resistance (AMR) profile clustering found at least 2 distinct ecotypes in 190 species (19.5%), median silhouette 0.620 11.
- Metabolic pathways. In 10 target species selected for at least 50 genomes and at least 15 variable pathways, silhouettes ranged from 0.35 to 0.89 12.
- Gut community ecotypes. Bootstrap ARI (adjusted Rand index, a chance-corrected agreement between partitions) was 0.13–0.17 and mean leave-one-study-out ARI 0.113, below the project’s > 0.30 stability threshold 13.
- Comparability. These silhouette values are not directly comparable, because species sets, features and algorithms differ 11,1.
Plant-associated lineages show partial, lineage-specific structure.
- Dual-nature majority. Of 1,115 plant-associated species, 878 (78.7%) carried both beneficial and pathogenic genomic signatures. Reading this as loss of a beneficial-versus-pathogen dichotomy remains a single-project hypothesis 4.
- Weak subclade segregation. Subclade segregation of plant association was weakly supported in 5 of 17 testable species (29%): all five passed Bonferroni-corrected Fisher’s exact tests, but only 3 also met the Cochran-valid chi² criterion. Twelve showed no such clustering 4.
- Xanthomonas host specialization. X. campestris segregated to Brassica hosts and X. vasicola to Zea mays 4.
- Small compartment effects. PERMANOVA (permutational analysis of variance on distance matrices) gave R² = 0.071; distance-based redundancy analysis (db-RDA) gave location-only R² = 0.060 4.
Gene co-occurrence supports guild hypotheses, not complementarity.
- A PGP guild. pqqC and acdS co-occurred across species at OR = 7.24 (q = 1.2e-83), while nifH was negatively associated with pqqC (OR = 0.57); this suggests shared selection without proving it 3.
- Genera, not genes. Co-occurring plant-associated genera were slightly less complementary than random pairs (Cohen’s d ≈ −0.4) 4.
- Laboratory co-fitness. Delta phi, the difference in binary gene-carriage association between co-fit gene pairs (pairs with similar laboratory fitness profiles) and prevalence-matched random pairs, averaged +0.011 across organisms; the across-organism test was not significant (W=9, p=0.13) 14.
Tensions and Caveats
- Where adaptive genes sit. The 32-species COG comparison places defense category V among novel or singleton genes (+2.83%) 15, whereas beneficial plant-interaction clusters are mostly core, meaning shared across a species’ genomes rather than accessory 4. Adaptive shifts therefore cannot simply be read as accessory-genome turnover. See conflicts/conflict—adaptive-versus-housekeeping-functional-differentiation—a27e3db1 and conflicts/conflict—ecotype-environment-gene-content—aa91ad15.
- Magnitude of the environment signal. The reanalysis reported an overall median of 0.081 across 183 species against 0.003 originally, using up to 3,505 genomes per species versus diversity-maximizing downsampling to a maximum of 250, and states the absolute values are not comparable across methods 6. See conflicts/conflict—ecotype-clustering-validity—c09534c6, conflicts/conflict—environment-embedding-geography—1f216267 and conflicts/conflict—confirmatory-exploratory-ecological-association-discordance—c1d44874.
- Broad null versus subsystem signals. Whether the prophage, soil-metal and carbon-pathway signals are genuine exceptions or structured confounding is unresolved; the sides use different response variables 6,10,8,9. See conflicts/conflict—ecotype-environment-gene-content—744fe541, conflicts/conflict—ecotype-clustering-validity—f884063a and conflicts/conflict—ecotype-environment-gene-content—30e389f5.
- Biology or measurement limits? The weak genome-wide signal may reflect coarse embeddings and metadata; coordinates may describe the collection site rather than the organism’s microenvironment 2. See conflicts/conflict—genome-wide-versus-locus-specific-ecological-adaptation—3fea06ca.
- Inflated effect sizes. The plant preliminary R² = 0.527 fell to 0.072 once genome-rich species were excluded 4; see conflicts/conflict—ecotype-environment-gene-content—16573a14. The soil-metal db-RDA R² = 0.799 is conditional on removing batch and project effects, and the unconditional value was not reported 8.
- Cluster validity. Silhouette scores and resampling ARI answer different questions, so neither certifies an ecotype alone 11,1,13. See conflicts/conflict—ecotype-clustering-validity—b299ade6.
- Load-bearing limitations.
- About 38% of gene clusters had COG annotations, and the ecotype analysis had no within-species phylogenetic controls 1.
- AlphaEarth embeddings covered 28.4% of genomes, stated as both 83,227 and 83,287 genomes, unreconciled 5,16. See conflicts/conflict—environment-embedding-geography—545921e4.
- The digest assigns the overall trp→ipdC OR = 2.81 to non-soil species; the report gives OR = 3.56 in non-soil and OR = 0.30 in soil species, and treats the soil reversal as hypothesis-generating because only 214/11,272 species (1.9%) carry ipdC 17,3.
Where to Go Deeper
- genome-wide-versus-locus-specific-ecological-adaptation — start here for the central 172-species null and the gene-subset hypothesis.
- ecotype-environment-gene-content — the full ledger of targeted environmental signals (soil metals, carbon pathways, prophage modules) set against the broad null.
- adaptive-versus-housekeeping-functional-differentiation — per-category COG significance and effect sizes, and why significance and magnitude diverge.
- ecotype-clustering-validity — per-species silhouette scores and why cluster statistics are not comparable across feature spaces.
- environment-embedding-geography — AlphaEarth coverage, composition bias, and the reanalysis that rejected the dilution explanation.
- gene-cooccurrence-ecological-guilds — PGP gene guilds and the limits of reading co-occurrence as linkage or complementarity.
- dual-nature-plant-associated-bacteria — cohort tallies showing that most plant-associated species carry mixed signatures.
Key entities: alph-aearth, kbase-ke-pangenome, benjamini-hochberg-fdr, gapmind, gtdb.
Reports: Ecotype Correlation Analysis, Ecotype Reanalysis — Environmental vs Human-Associated Species, Ecotype Functional Differentiation, Plant Microbiome Ecotypes — Compartment-Specific Functional Guilds and Their Genetic Architecture, PGP Gene Distribution Across Environments & Pangenomes, AlphaEarth Embeddings, Geography & Environment Explorer.