Embeddings, which are numerical vectors summarizing environmental information at sampling locations, carry clear geographic structure. Projects disagree on how much environmental similarity explains within-species gene content once phylogeny (evolutionary relatedness among genomes) is controlled, and on how large that signal is. This matters for environment-embedding-geography because it affects how much weight embedding-derived environment similarity should carry as a correlate of gene content. The estimates cannot be reconciled by averaging, because the studies used different genome sets, species filters and downsampling (reducing the number of genomes analysed per species) 1,2.
Evidence Sides
Side 1: embeddings capture geographic structure. Embeddings show clear geographic distance-decay, meaning that sites farther apart have less similar embeddings 2,3. This side establishes that the environmental representation is not noise at the level of place.
Side 2: environment is a weak predictor of gene content relative to phylogeny. The partial correlation is the correlation between two variables after a third is held constant. In the ecotype analysis, the median partial correlation between environment similarity and gene content was 0.0025 2,3. The ecotype analysis also found a phylogenetic median of 0.0143 against that environmental median of 0.0025 1,3.
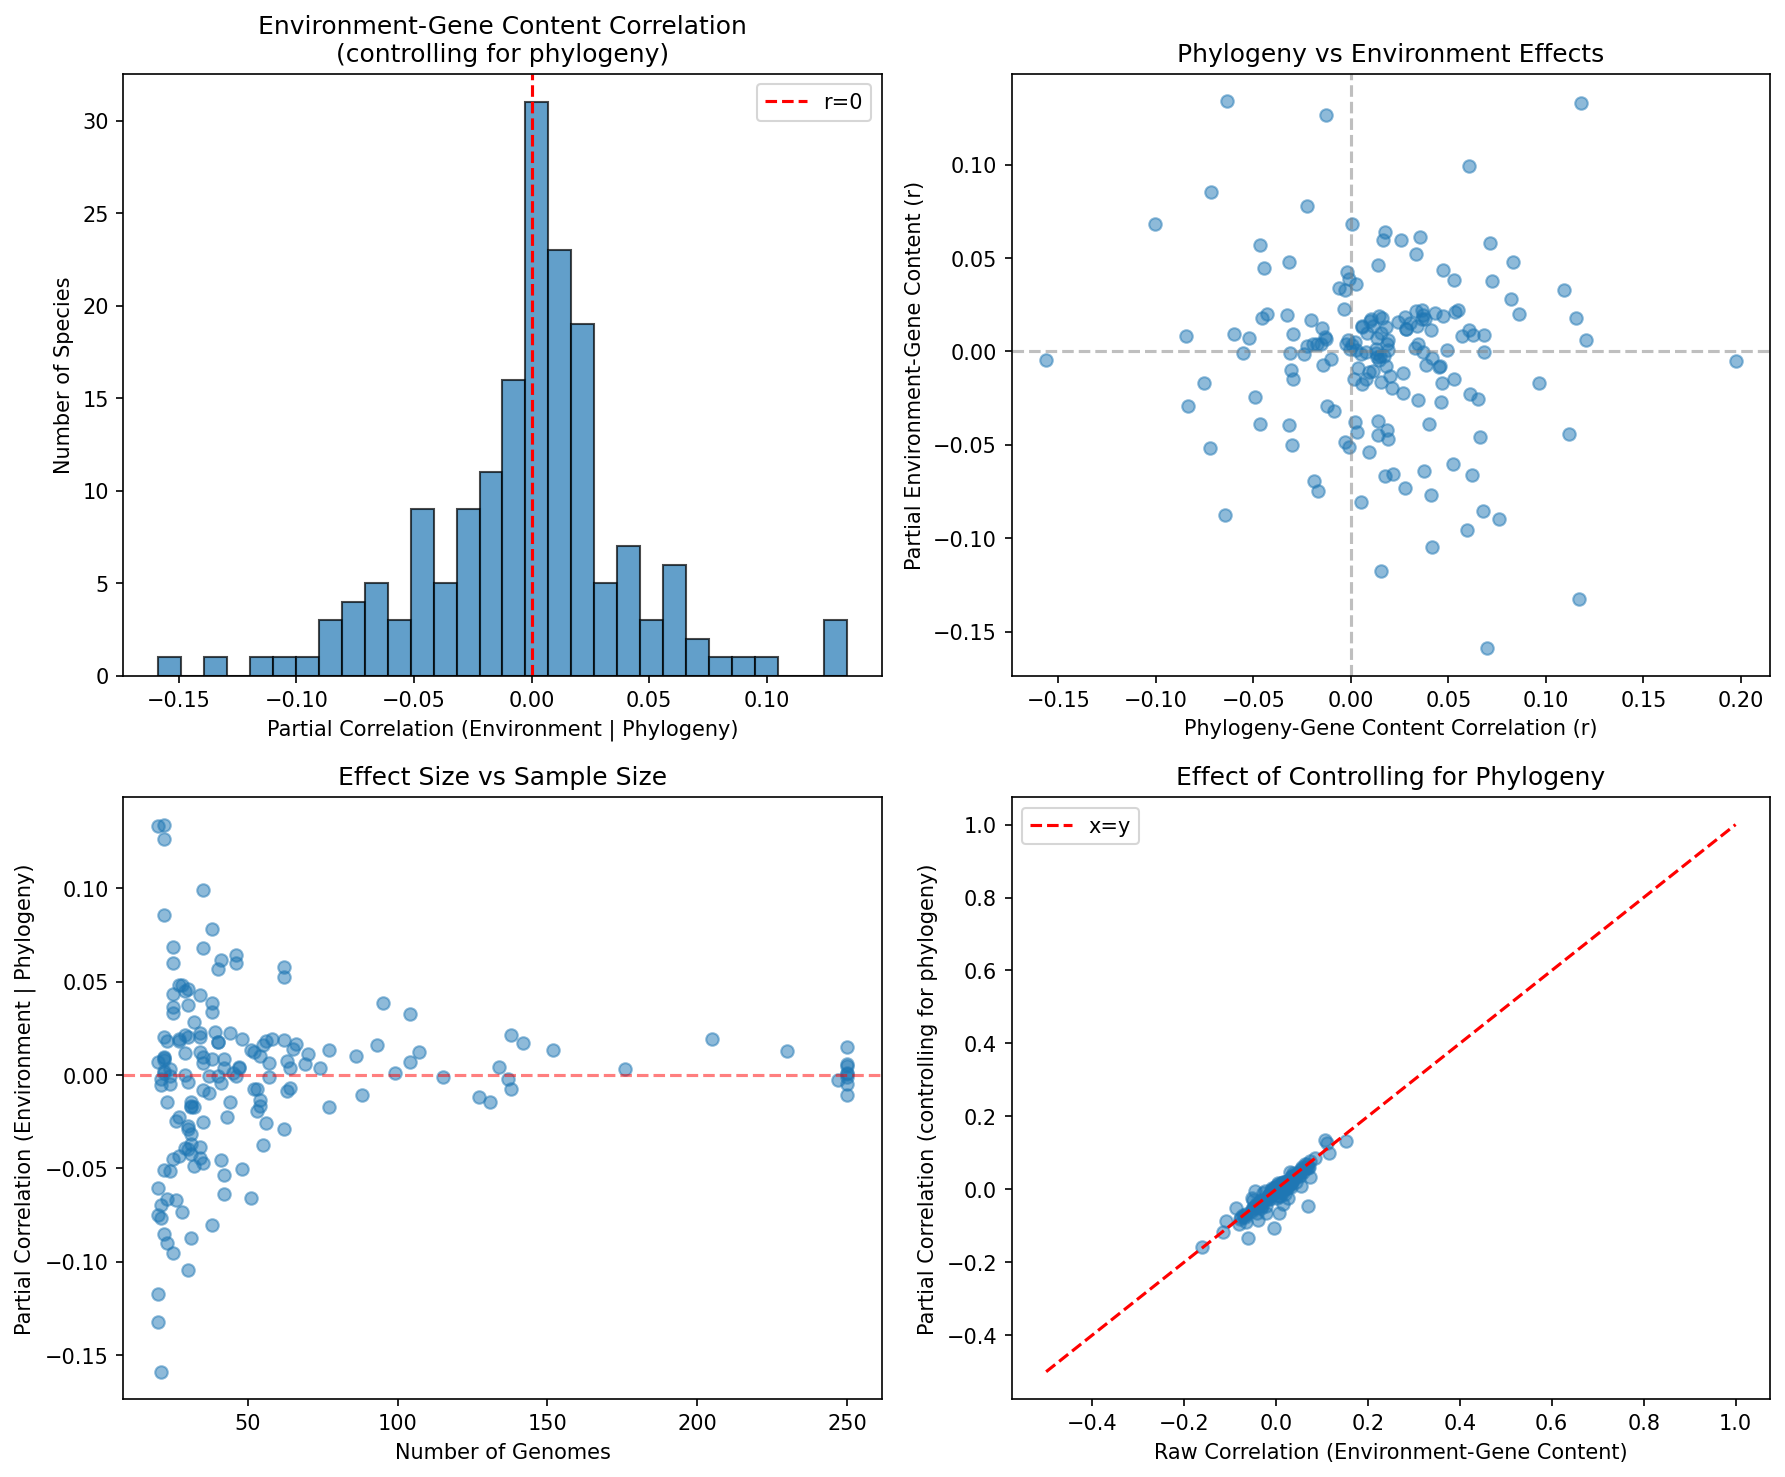 Ecotype correlation summary. From ecotype_analysis.
Side 3: an environmental-only reanalysis finds no stronger signal in environmental species. The reanalysis grouped species by habitat category. It found a median of 0.051 for environmental species versus 0.084 for human-associated species 1,3. A Mann-Whitney U test compares two groups by rank rather than by mean. It tested whether environmental species show stronger correlations than human-associated species and gave U=1536, p=0.83, a null result 1,3. The p-value is the probability of a result at least this extreme if no true effect exists. Environmental species did not show a stronger environment–gene content association than human-associated species 1,3.
Methodological caveat shared by both sides. These estimates cannot be reconciled by averaging. The studies used different genome sets, species filters and downsampling 1,2.
Possible Reconciliations
- Hypothesis: The magnitude gap between Side 2 and Side 3 comes from the choice of genome set, species filter and downsampling. If so, it reflects analysis choices rather than a difference in biology.
- Hypothesis: Geographic distance-decay in embeddings and environment–gene content association measure different things. Embeddings could resolve place well while capturing little of the selective pressures that shape gene content.
- Hypothesis: Phylogeny absorbs most of the shared variance, which would leave environment only a small residual partial correlation under either design.
Resolving Work
- Same genomes, both pipelines. Rerun the ecotype analysis and the environmental-only reanalysis on one shared genome set with identical downsampling. This would show whether the gap between 0.0025 and 0.051/0.084 1,3 persists when inputs match.
- Filter sensitivity sweep. Recompute per-species partial correlations while varying one species filter at a time. This would identify which filter drives the magnitude shift.
- Distance-decay versus gene-content decay. For each species, regress gene-content dissimilarity on geographic distance and on embedding distance, with phylogenetic distance as a covariate. This would test whether geographic signal in the embeddings carries over to gene content.
- Habitat-stratified permutation nulls. Build permutation null distributions of partial correlations within environmental and human-associated species. This would test whether observed medians exceed chance in either group, independently of the between-group comparison.