This tension, recorded on cross-tenant-data-bridging, asks whether summary measures carried across tenants of the KBase Data Lakehouse can be read as uniform, comparable evidence. One project finds literature attention so unevenly spread that paper count cannot serve as a uniform evidence proxy 1. Another finds that an effect-size summary moved by a large factor between analyses because sampling differed, while its hypothesis tests stayed null 2. If either measure depends on how attention or sampling was distributed, claims built on joins of such counts or summary statistics would inherit that dependence. The tension text groups these findings without stating how they relate, so they are kept as separate sides below.
Evidence Sides
Side A: Paper count is not a uniform evidence proxy
PaperBLAST, which links protein sequences to papers, has a Gini coefficient (an inequality measure; higher means more concentrated attention) of 0.967 for organisms and 0.669 for genes 1. Among protein families clustered at 50% identity, 9.2% have zero papers, 46.1% exactly one, and 4.3% at least 20, contradicting paper count as a uniform evidence proxy 1.
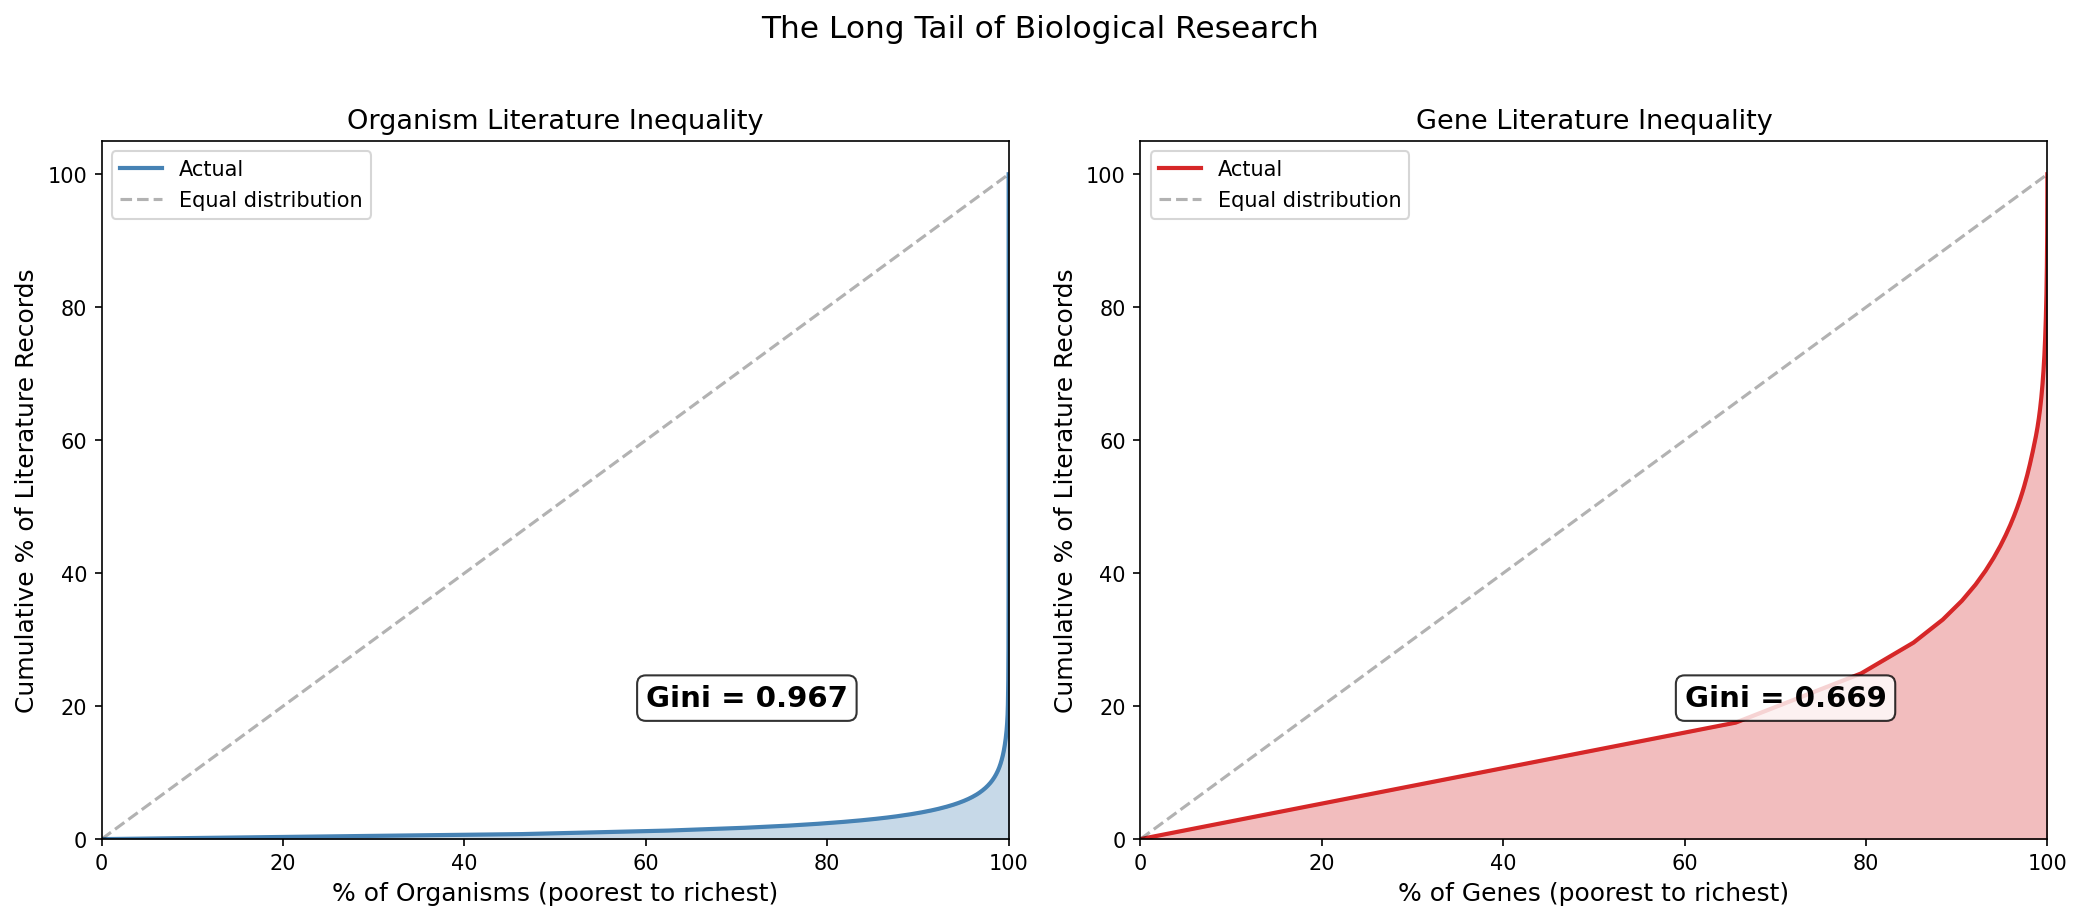 Lorenz inequality curves for organisms and genes. From paperblast_explorer.
Side B: A summary statistic shifted with sampling while the tests stayed null
The ecotype reanalysis tested whether environmental species show stronger environment–gene content partial correlations (associations measured after controlling for a third variable) than human-associated species 2. The result was null at p=0.83 (a p-value measures how compatible the observed result is with the null hypothesis, not the probability that the null hypothesis is true), and the observed direction was opposite to the hypothesis that environmental species would be greater 2. A Spearman rank correlation of rho=-0.085, p=0.25 (rho is the rank correlation coefficient) was likewise not significant 2. The median partial correlation was 0.081 across 183 species, compared with 0.003 in the original analysis, a reported 27x difference caused by different sampling 2. The null results stand as nulls; the size difference is attributed to sampling.
Possible Reconciliations
- Hypothesis 1: Both sides may reflect one underlying issue. Bridged measures may carry the sampling or attention structure of the tenant they came from, so neither paper counts nor median partial correlations would be comparable without that structure being made explicit.
- Hypothesis 2: The two sides may be independent. Literature inequality would then be a property of the PaperBLAST tenant only, and the ecotype shift a property of species selection only. In that case no shared correction would apply.
- Hypothesis 3: Null hypothesis tests may be robust to the sampling differences that move effect-size summaries. If so, bridged comparisons should rely on tests, not on raw summary magnitudes.
Resolving Work
- Weighted joins (PaperBLAST data): Re-weight any analysis that joins on paper counts by family-level attention, then compare conclusions before and after. Question: does weighting change which families or organisms look well-supported?
- Matched resampling (ecotype species sets): Draw the original and the reanalysis species samples under matched selection rules and recompute the median partial correlation. Question: does the difference persist once sampling is equalized?
- Bootstrap intervals (both summaries): Bootstrap the median partial correlation and the Gini coefficients across resampled species or families. Question: are the reported values stable, or driven by a few entities?
- Test robustness (ecotype tests): Rerun the reanalysis tests on both sampling schemes. Question: do the null results stay null under each scheme?
- Cross-tenant join check (bridged datasets): For bridged datasets that join on literature-derived fields, stratify downstream results into zero-paper, one-paper, and at-least-20-paper families. Question: do results depend on which stratum dominates?