Key Findings
1. Clinical bias does NOT explain the weak environment signal (H0 not rejected)
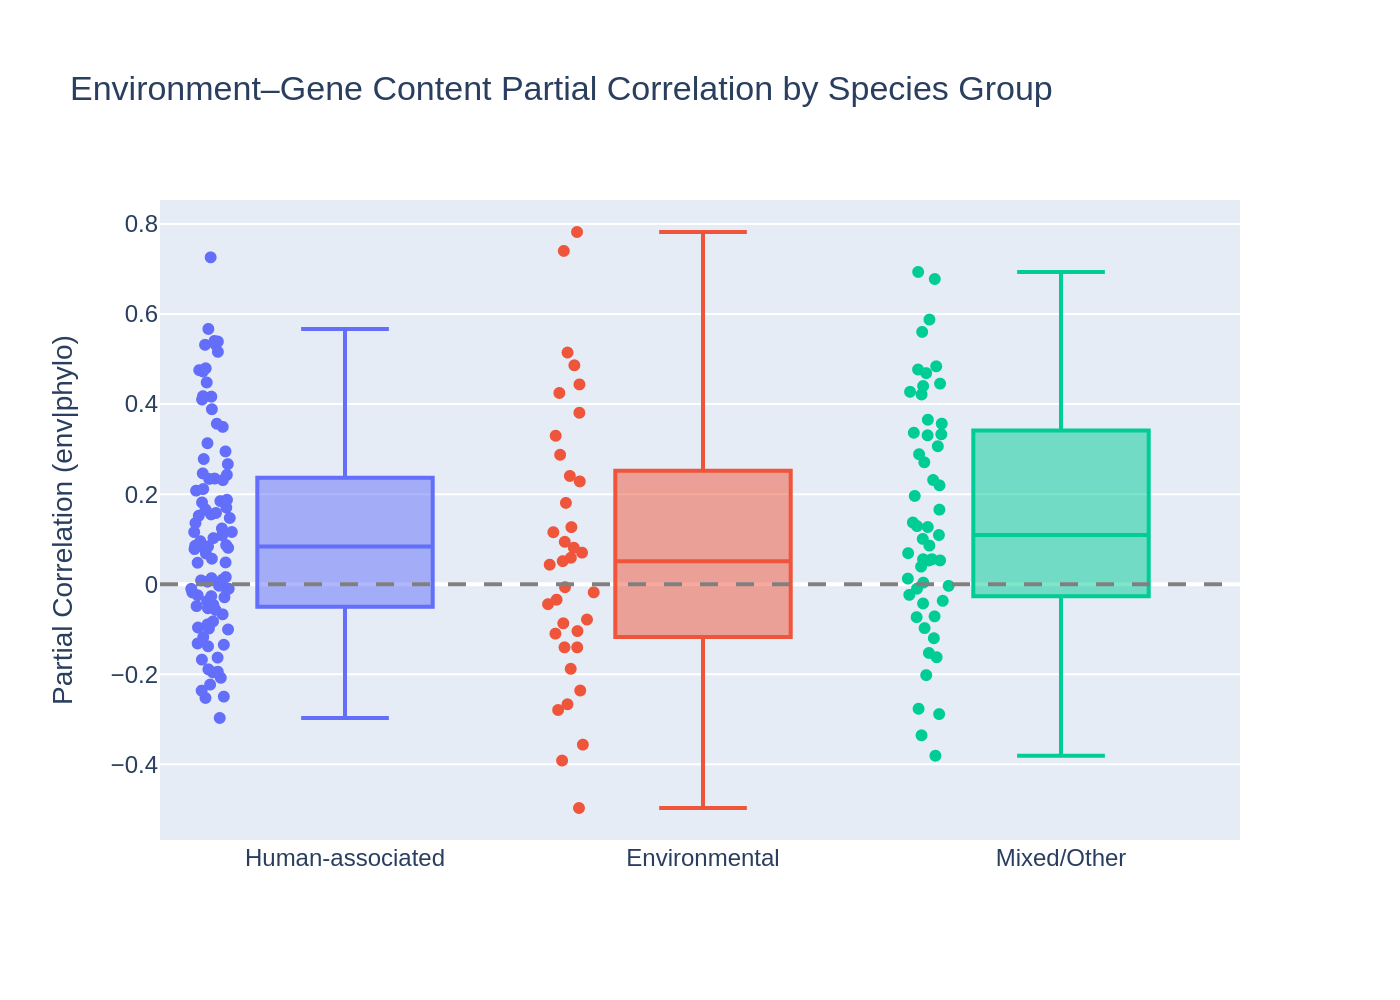
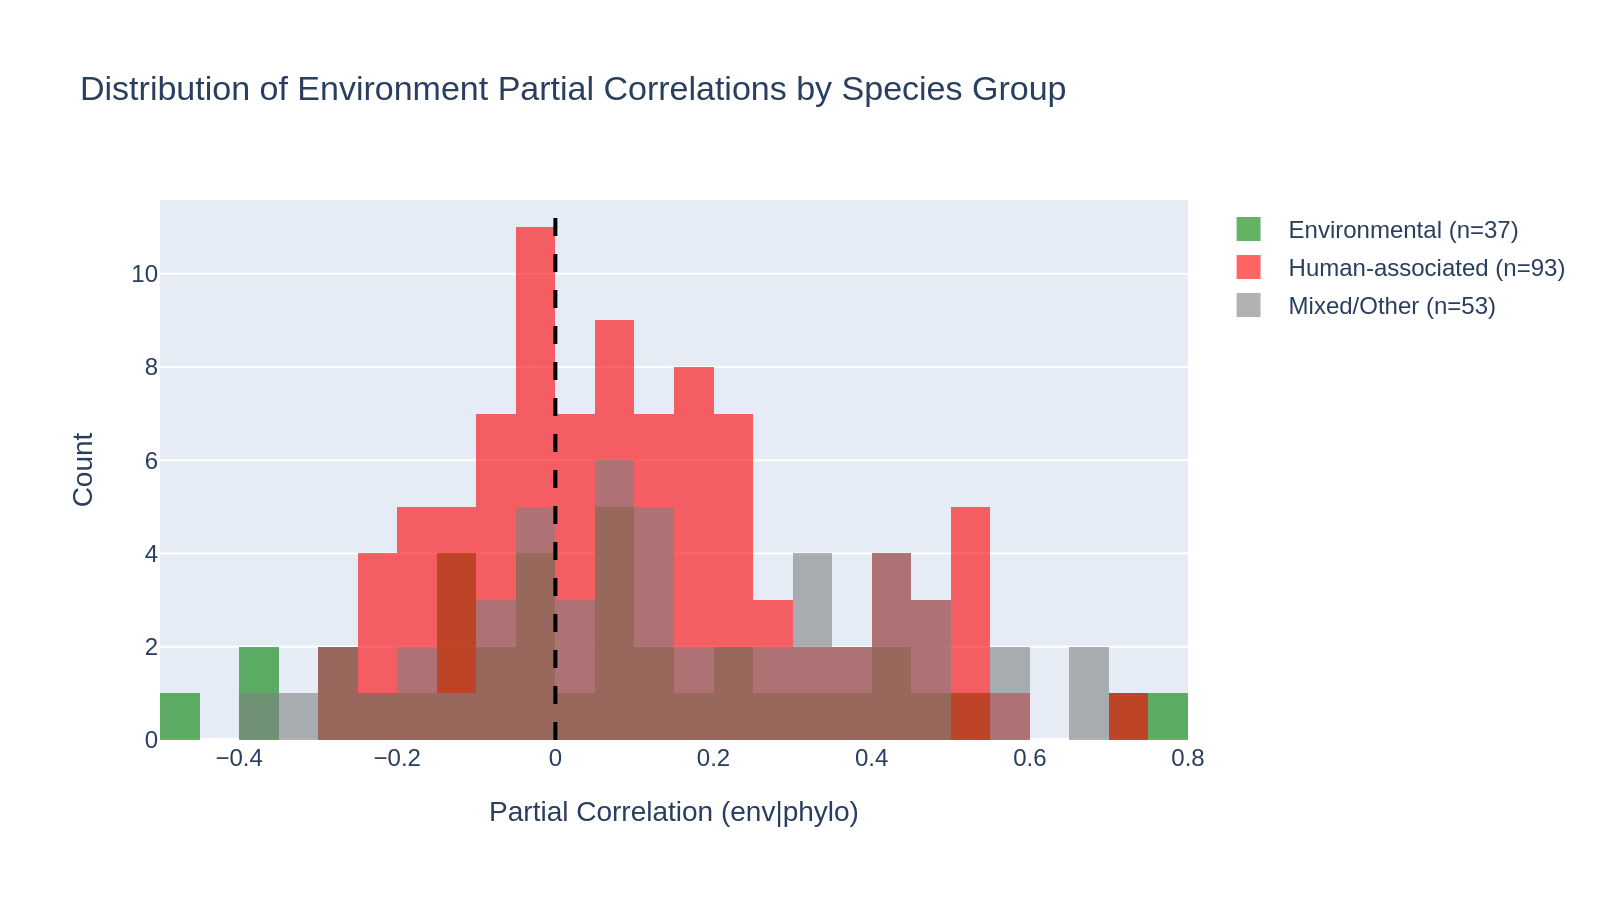
Environmental species (n=37, median partial correlation 0.051) do NOT show stronger environment–gene content correlations than human-associated species (n=93, median 0.084). The Mann-Whitney U test is far from significant (U=1536, p=0.83, one-sided). The result is the opposite direction from the hypothesis: human-associated species actually show slightly higher partial correlations.
| Group | N species | Median partial corr | Mean | Std | Range |
|---|---|---|---|---|---|
| Environmental | 37 | 0.051 | 0.073 | 0.299 | [-0.50, 0.78] |
| Human-associated | 93 | 0.084 | 0.110 | 0.226 | [-0.30, 0.73] |
| Mixed/Other | 53 | 0.109 | 0.148 | 0.261 | [-0.38, 0.69] |
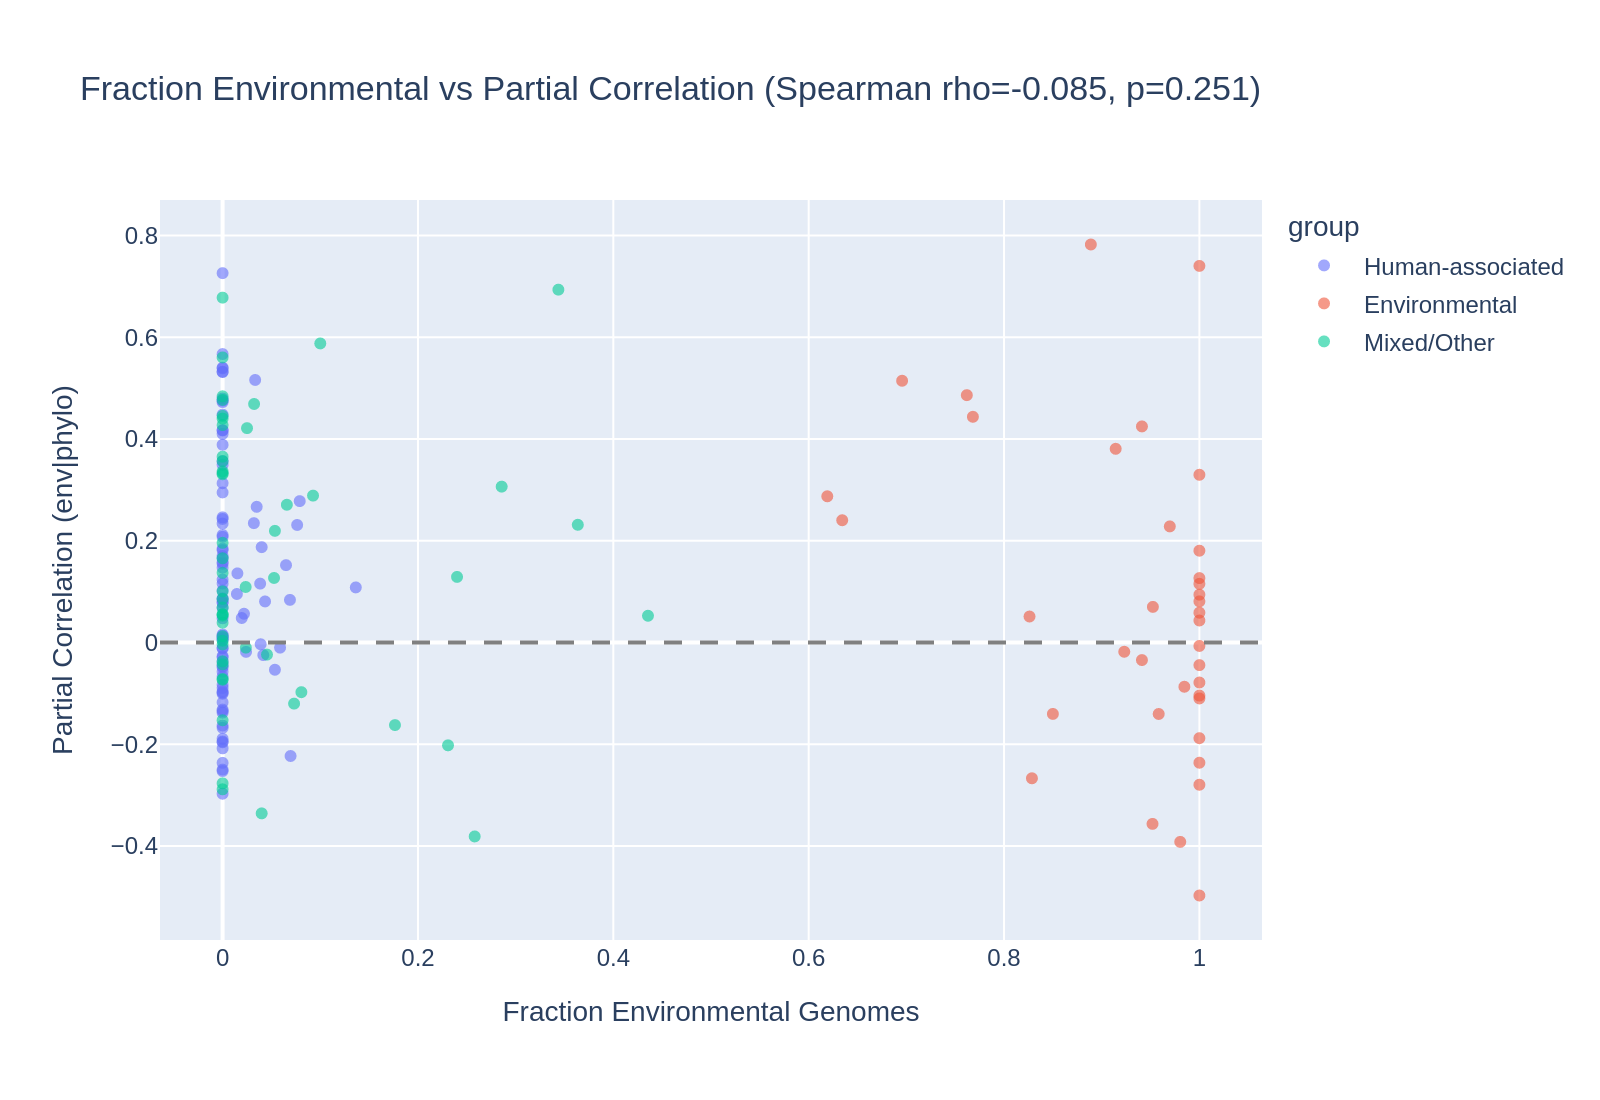
The continuous Spearman analysis confirms this: fraction of environmental genomes per species does not predict partial correlation strength (rho=-0.085, p=0.25).
(Notebook: 01_environmental_only_reanalysis.ipynb)
2. 47% of ecotype species are human-associated, only 21% environmental
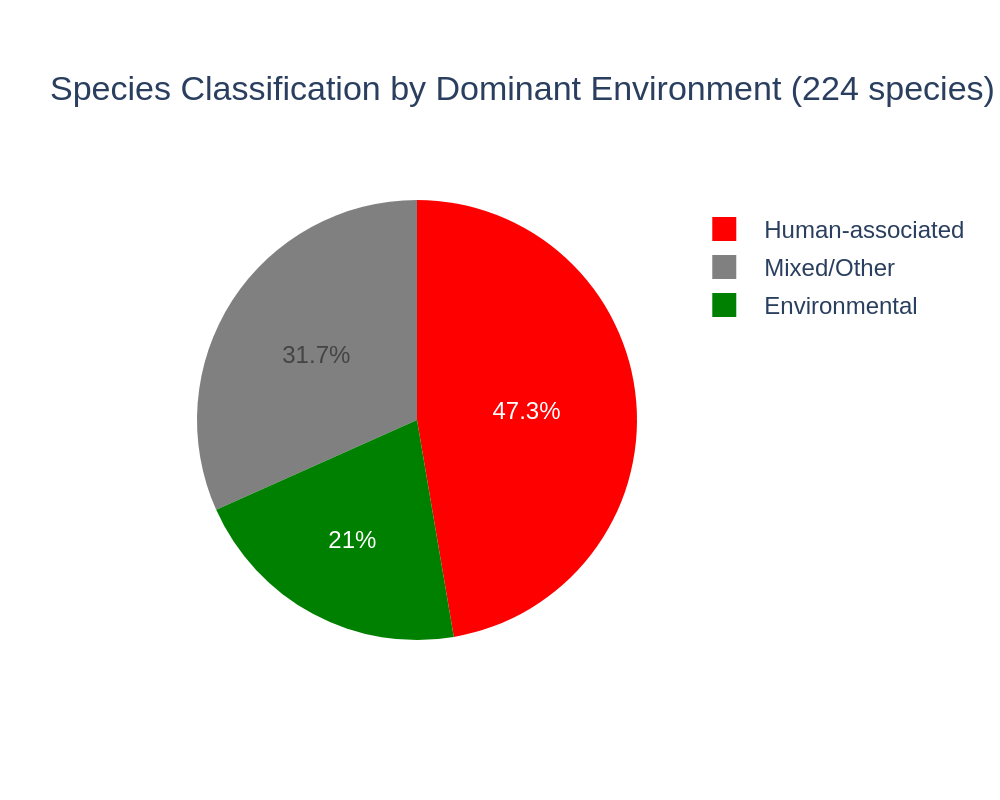
Of 224 species selected for the ecotype analysis (>=20 genomes with AlphaEarth embeddings, >=30% coverage), 106 (47%) are majority human-associated by genome-level isolation_source classification, 47 (21%) are majority environmental (Soil, Marine, Freshwater, Extreme, Plant), and 71 (32%) are mixed/other. This confirms the strong clinical sampling bias in the AlphaEarth subset identified by the env_embedding_explorer project but shows it doesn’t account for the weak environment signal.
(Notebook: 01_environmental_only_reanalysis.ipynb)
3. NaN species are disproportionately environmental, not human-associated
Of the 30 species with NaN partial correlations, the NaN rate is highest for Environmental (10/47 = 21%) and Mixed/Other (13/66 = 20%), and lowest for Human-associated (7/100 = 7%). This means the environmental group loses more species to NaN, which could slightly bias the comparison — but since human-associated species already show higher correlations even with this bias, addressing it would only strengthen the null result.
(Notebook: 01_environmental_only_reanalysis.ipynb)
4. Overall partial correlations are 27x higher than the original analysis
The median partial correlation across all 183 species is 0.081 — compared to 0.003 in the original ecotype analysis. Key methodological differences:
- No downsampling: We used all genomes with embeddings (up to 3,505/species) vs the original’s diversity-maximizing downsampling (max 250)
- More genomes = more power: Larger sample sizes detect weaker correlations
- Different genome sets: Without downsampling, the distance distributions change
This 27x difference affects the absolute magnitude but does not invalidate the group comparison, which is the question we are testing — the Environmental vs Human-associated comparison is conducted within the same methodology.
(Notebook: 01_environmental_only_reanalysis.ipynb)
Results
Species classification
Using the harmonized env_category mapping from env_embedding_explorer, each species was classified by the dominant environment of its genomes (majority vote):
| Classification | N species | % |
|---|---|---|
| Human-associated | 106 | 47% |
| Mixed/Other | 71 | 32% |
| Environmental | 47 | 21% |
Statistical tests
| Test | Statistic | p-value | Significant? |
|---|---|---|---|
| Mann-Whitney U (Env > Human) | U=1536 | 0.83 | No |
| Spearman (frac_env vs partial corr) | rho=-0.085 | 0.25 | No |
| Spearman (frac_human vs partial corr) | rho=0.030 | 0.69 | No |
Both the binary classification (Mann-Whitney) and continuous analysis (Spearman) show no relationship between environment type and the strength of the environment–gene content correlation.
Interpretation
Why the hypothesis was wrong
We predicted that environmental species would show stronger environment–gene content correlations because their AlphaEarth embeddings carry more geographic signal (3.4x ratio vs 2.0x for human-associated, from env_embedding_explorer). But the data shows no difference. Several explanations:
-
Embedding similarity ≠ ecological relevance: Environmental embeddings are more geographically differentiated, but the environmental variation they capture (climate, vegetation, land use) may not strongly predict which genes a bacterium has.
-
Clinical pathogens have real geographic structure: Human-associated species like Klebsiella or Enterococcus have global epidemiological patterns — different lineages dominate different regions. The AlphaEarth embeddings may capture these regional patterns, creating environment–gene content associations that are real but epidemiological rather than ecological.
-
Genome sampling matters: Species with more genomes (often clinical) have more statistical power to detect weak correlations. The Mixed/Other group has the highest median (0.109), possibly because it includes diverse sampling campaigns.
Literature Context
The original ecotype_analysis project (Dehal et al., 2026) found phylogeny dominates with p=0.66 for the environment vs host-associated comparison using a coarse manual classification. Our reanalysis with genome-level harmonized classifications confirms this null result (p=0.83) with a more systematic classification scheme.
Novel Contribution
This is the first test of whether genome-level environment classification (rather than species-level manual assignment) changes the ecotype analysis conclusion. It demonstrates that the clinical sampling bias in AlphaEarth, while real and significant for embedding-based analyses, does not confound the ecotype environment–gene content relationship.
This project also serves as a template for how follow-up projects in the observatory should reference and build on prior work.
Limitations
- No downsampling: 27x higher overall partial correlations vs original analysis. The absolute values are not comparable, but the group comparison is valid.
- NaN exclusion: Environmental species have a higher NaN rate (21%) than human-associated (7%), meaning the environmental group is more filtered. This would bias toward finding a stronger signal in the environmental group if anything — the opposite of what we observe.
- K. pneumoniae excluded: This major clinical species exceeded Spark’s maxResultSize during gene cluster extraction and has no correlation data.
- Classification by majority vote: A species with 51% gut genomes is classified as “Human-associated.” The continuous Spearman analysis addresses this limitation and confirms the null result.
Data
Sources
| Collection | Tables Used | Purpose |
|---|---|---|
kbase_ke_pangenome | genome, alphaearth_embeddings_all_years, genome_ani, gene, gene_genecluster_junction | Genome metadata, embeddings, ANI distances, gene cluster memberships |
Generated Data
| File | Rows | Description |
|---|---|---|
data/species_env_classification.csv | 224 | Species classified by majority env_category |
data/ecotype_corr_with_env_group.csv | 213 | Partial correlations merged with environment group labels |
Data from parent projects
| Project | File | Used for |
|---|---|---|
ecotype_analysis | data/ecotype_correlation_results.csv | Partial correlations for 213 species |
ecotype_analysis | data/target_genomes_expanded.csv | 25,205 target genomes with species |
env_embedding_explorer | data/alphaearth_with_env.csv | Harmonized env_category per genome |
Supporting Evidence
Notebooks
| Notebook | Purpose |
|---|---|
01_environmental_only_reanalysis.ipynb | Load data, classify species, compare partial correlations, statistical tests, visualizations |
Figures
| Figure | Description |
|---|---|
partial_corr_by_group.png | Box plot of partial correlations by species group |
partial_corr_distributions.png | Overlaid histograms of partial correlations by group |
frac_env_vs_partial_corr.png | Continuous scatter: fraction environmental vs partial correlation |
species_classification.png | Pie chart of species classification (47% human, 21% environmental) |
Future Directions
- Investigate the 27x partial correlation discrepancy: Compare downsampled vs full-genome extraction to understand the magnitude difference with the original analysis
- Test specific gene subsets: Environment may act on specific functional categories (transport, secondary metabolism) rather than the whole genome Jaccard distance
- Repeat with ENVO ontology terms: The
env_broad_scalefield provides structured ENVO terms that may classify environments more accurately - Control for genome count: Species with more genomes may have inflated correlations — add genome count as a covariate
References
- Parks, D.H. et al. (2022). “GTDB: an ongoing census of bacterial and archaeal diversity through a phylogenetically consistent, rank normalized and complete genome-based taxonomy.” Nucleic Acids Research, 50(D1), D199–D207. PMID: 34520557
- Dehal, P.S. et al. (2026). “Ecotype Correlation Analysis.” BERIL Research Observatory,
projects/ecotype_analysis/ - Dehal, P.S. et al. (2026). “AlphaEarth Embeddings, Geography & Environment Explorer.” BERIL Research Observatory,
projects/env_embedding_explorer/