Projects disagree on which isolates make up the genome subset that carries environmental embeddings (satellite-derived vectors assigned from a genome’s sampling coordinates). One central digest says clinical isolates often lack valid coordinates. Another says clinical isolates are disproportionately embedded. The reports describe the bias in different directions again 1,2,3,4. The size of the subset is also stated inconsistently: 83,227 in one place and 83,287 in another 1. These questions matter because any environment–genome association drawn from embeddings, or from harmonized metadata, inherits the composition of the subset. That evidence is synthesized in environment-embedding-geography.
Evidence Sides
Side A: clinical isolates often lack valid coordinates, and coverage is described as environment-biased The pitfalls digest says valid coordinates are often missing, especially for clinical isolates. The SNIPE report describes coverage as biased toward environmental isolates with latitude/longitude data 1,2,3,4.
Side B: the subset over-represents clinical isolates The discoveries digest says clinical isolates have good geographic metadata and disproportionately have embeddings. The prophage report describes a bias toward clinically and environmentally well-sampled lineages, which sits between the two framings 1,2,3,4.
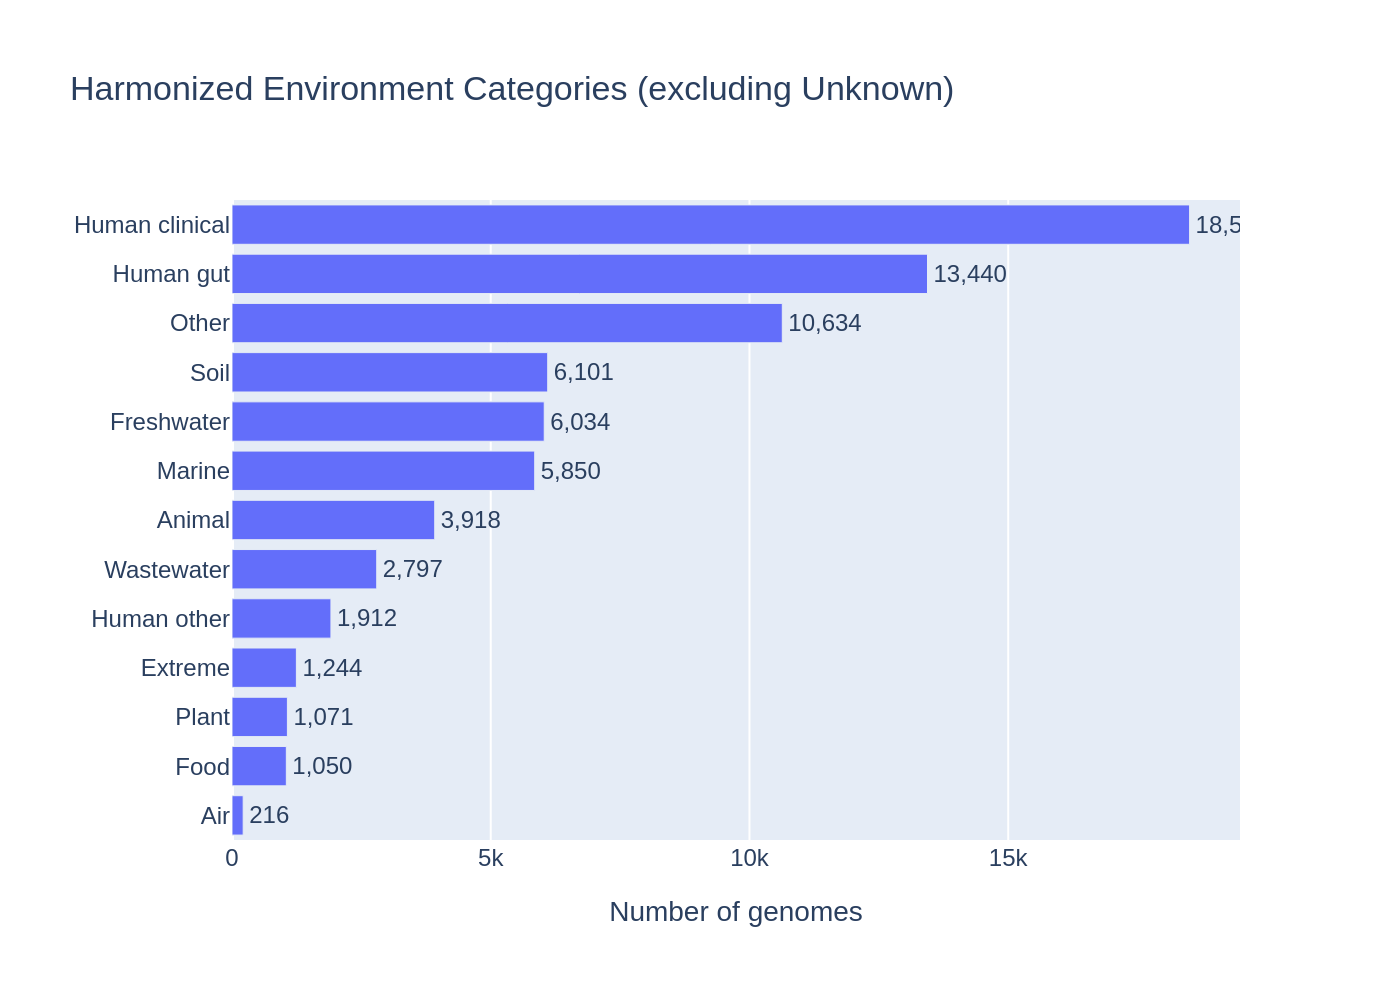 Harmonized environment categories showing human clinical and gut dominance. From env_embedding_explorer.
Side C: metadata and coordinate caveats that shape either reading
- Field coverage. The structured
env_broad_scalefield (an ontology-coded broad environment label) is cleaner but covers only 42% of genomes. Keyword harmonization of the free-textisolation_sourcefield covers 71% of genomes with a label but leaves 17% Other and 12.5% Unknown 5. - Distance-decay. Distance-decay is the decline in genomic similarity with geographic distance. It may reflect environmental context, epidemiological structure, institutional clustering, or approximate coordinates 5,6.
- Subset size. The pitfalls digest gives 83,227 embedded genomes in one section and 83,287 in another 1.
Possible Reconciliations
- Hypothesis 1: The statements refer to different denominators. “Often missing for clinical isolates” may describe clinical isolates as a whole. “Disproportionately embedded” may describe the embedded subset’s composition. If so, both could hold at once.
- Hypothesis 2: The project-level descriptions reflect each project’s own species or lineage selection rather than the shared embedded subset.
- Hypothesis 3: The two subset counts come from different query snapshots or filters, so the digest sections describe different tables.
The supplied evidence does not test these hypotheses.
Resolving Work
- Clinical coordinate rate: Use pangenome (the combined gene content of a species’ sequenced genomes) genome metadata joined to the embeddings table. Compute the fraction of clinical vs environmental isolates that have valid coordinates, and their shares within the embedded subset. Question: is the clinical bias a property of the source population, the embedded subset, or both?
- Project re-runs: Use the SNIPE and prophage genome sets. Tabulate each set’s isolation categories against the full embedded subset. Question: do the project-level bias statements describe project selection rather than platform coverage?
- Subset count: Use the embeddings table. Re-count rows and record the query and filter behind each digest figure. Question: which count is current, and why do the two differ?
- Field agreement: Use genomes that have both
env_broad_scaleand harmonizedisolation_sourcelabels. Cross-tabulate the two labels. Question: do the Other and Unknown bins skew clinical or environmental? - Distance-decay controls: Use embedded genomes. Fit distance-decay models with and without stratifying by submitting institution and by coordinate precision. Question: does the geographic signal survive these controls?