Gene essentiality is dependence of growth on a gene’s function under a defined condition. This corpus treats direct perturbation and measured growth as the strongest evidence, and treats conservation, annotation and modeling as predictors rather than definitions. 1 The corpus can say something about essentiality because it tests the measurements themselves. It compares assays against each other in Acinetobacter baylyi ADP1, it audits which genes and organisms a perturbation panel can reach at all, and it shows where a missing call reflects absent evidence rather than absent biology. 2,3,4,5 Across these analyses, essentiality calls stay specific to the assay and condition that produced them, and absence of transposon data gives only an upper bound on essentiality. 6,4
Literature Context
Single-gene deletion libraries are considered the gold standard for identifying essential genes, yet TraDIS (transposon-directed insertion site sequencing) had not been benchmarked against them. A high-density TraDIS library in Escherichia coli K-12 was compared with existing essential-gene databases. Its initial automated analysis disagreed with the literature in many cases, and corrections for gene length and genome length were needed to reduce false-positive essential calls. Manual inspection also found short essential regions within genes that statistics alone missed [PMID 29463657]. A saturating Himar1 library in Mycobacterium tuberculosis showed that approximately 9% of potential TA dinucleotide insertion sites were less permissible for insertion. A coverage gap therefore does not automatically reflect biological selection, and features with as few as 2 TA sites could be evaluated only after this bias was modeled [PMID 28096490]. Tn-seq protocols separate genes essential in one condition from conditionally important ones by growing libraries in different environments [PMID 34709619]. A review argues that binary classifications leave no space for graded essentiality shaped by condition and genetic background [PMID 35104846]. A minimal-genome design based partly on limited transposon data failed to produce a viable cell because it omitted quasi-essential genes needed for robust growth [PMID 27013737].
Two lines of work address Acinetobacter baylyi ADP1 and the absence of essential genes from mutant libraries. In ADP1, 55 chromosomal regions were tested for multi-gene deletion and 18 deletions succeeded. Success could only be partially predicted from the existing single-gene deletion collection combined with a new Tn-Seq dataset [PMID 32232367]. Essential genes are typically missing from mutant libraries, which leaves them out of genome-scale phenotype screens. TFNseq detects insertions in essential genes immediately after transformation and follows their loss, which allowed 45 essential processes to be ordered by how quickly their inactivation inhibited growth [PMID 32665440].
The corpus is consistent with this literature and extends it. In ADP1, RB-TnSeq (random barcode transposon sequencing, a pooled mutant-fitness assay) disagreed with complete knockouts. At an essentiality-fraction threshold of 0.05 in rich medium across 1,933 genes, only 18 genes were essential by both methods, and Cohen’s kappa was negative at all five thresholds (-0.139 to -0.014). The knockout labels mix minimal-medium and LB (rich-medium) calls, and the thresholds were not corrected for multiple testing. Continuous fitness outperformed the binary essentiality fraction by AUC (a threshold-independent classification score): 0.700 versus 0.344 in rich medium (1,933 genes) and 0.725 versus 0.403 in minimal medium (2,011 genes). This supports graded rather than binary essentiality [PMID 35104846]. Treating the 48-organism figure of 18.6% essential as an upper bound agrees with documented length and insertion-site biases [PMID 29463657] [PMID 28096490]. The shorter median length of essential genes (675 bp versus 885 bp) is consistent with this but does not show that short genes were falsely called. Essential genes were absent from ICA (independent component analysis) modules and from fitness-ranked candidates among dark (functionally uncharacterized) genes, matching the library gap TFNseq was designed to close [PMID 32665440]. ADP1 essentiality shifted from 346 genes on LB to 499 on minimal media, fitting conditional essentiality [PMID 34709619]. The corpus’s main addition is auditing perturbation coverage itself; see essentiality-assay-discordance and transposon-callability-bias.
What the Corpus Shows
Transposon fitness and complete knockouts measure different phenotypes. RB-TnSeq (random barcode transposon sequencing, a pooled mutant-fitness assay) reports the fitness cost of insertion mutants. A complete knockout instead tests whether the cell is viable without the gene. 2 In ADP1, calls at an RB-TnSeq essentiality-fraction threshold of 0.05 were compared with rich-medium knockout calls across 1,933 genes. Only 18 genes (0.9%) were essential by both methods. Another 211 were knockout-essential but RB-TnSeq-dispensable, and 293 were the reverse. 2 Cohen’s kappa is a chance-corrected agreement score, and it was negative at all five thresholds, ranging from -0.139 to -0.014. 2 Continuous fitness carried more signal than the binary call. Classification performance was scored with AUC, a threshold-independent classification measure. Inverted fitness scored 0.700 in rich medium (1,933 genes) and 0.725 in minimal medium (2,011 genes). The essentiality fraction scored 0.344 and 0.403 in the same media, both worse than random. 2 essentiality-assay-discordance develops this point. By comparison, flux balance analysis (FBA, a constraint-based metabolic model) agreed moderately with knockouts: kappa was 0.486 in rich media (724 genes) and 0.493 in minimal media (833 genes). 2
Absence of an insertion is an upper bound, not a call. The 48-organism analysis classified 41,059 of 221,005 genes (18.6%) as essential. It treats this figure as an upper bound, because small size, AT-rich sequence or scaffold-edge effects can prevent insertions in genes that are not essential. 4 Essential genes had a median length of 675 bp, against 885 bp for non-essential genes, and 17.8% were shorter than 300 bp. This pattern is consistent with the warning but does not show that short genes were falsely called. 4 The Fitness Browser has no explicit essentiality column. Putative essentials are therefore genes absent from genefitness, which yields only an upper bound. 7 transposon-callability-bias notes that per-organism essentiality rates range from 12.2% to 29.7%. These differences may combine biological variation with callability differences. 4
Perturbation collections are not random samples of the genome. In the ADP1 deletion collection, 272 of 2,593 TnSeq-dispensable genes (10.5%) lacked growth data. The missing genes were shorter, less annotated and less often pangenome-core, meaning part of the species’ shared gene set: 76.5% were core versus 93.3% of present genes (p = 1.4×10⁻²⁰). 3 One uncovered gene can block a hypothesis. NDH-2 is a one-subunit, non-proton-pumping dehydrogenase, and it is missing from the deletion collection. As a result, the report’s predicted NDH-2 compensation on glucose cannot be tested directly with this dataset. 8 The structure of the data also keeps essential genes out of downstream analyses. ICA (independent component analysis) decomposes fitness data to group genes with shared fitness variation, and no essential gene appeared in any ICA module, because modules need measurable fitness variation. 9 Dark genes are functionally uncharacterized genes. No essential gene appeared in the dark-matter project’s fitness-based NB05 top 100 candidates. Its 9,557 essential dark genes were instead ranked from indirect evidence such as gene-neighbor context and conservation. 10 See genetic-perturbation-coverage-bias.
Condition coverage decides what can be detected. Essentiality in ADP1 shifted with medium: 499 genes were essential on minimal media versus 346 on LB, the rich medium. 1 Condition coverage was uneven across 48 Fitness Browser organisms, with Shewanella MR-1 at 121 historical conditions. Organisms with deeper coverage can produce more specific phenotypes and so receive higher priority scores. 10 MR-1 contributed 25 of the top 100 dark-gene candidates. Rank correlations stayed above 0.93 across six alternative weightings, but only 64% of the fitness-active top 50 survived the conservation-dominant or drop-tractability settings. 10 Conserved genes are not exempt from coverage effects. Genes with strong condition-specific effects were 77.3% core, versus 70.3% for genes without them. 11 In addition, 25,271 genes (17.8%) were trade-off genes, with fitness below -1 in some conditions and above 1 in others. 12 See fitness-condition-coverage-prioritization-bias.
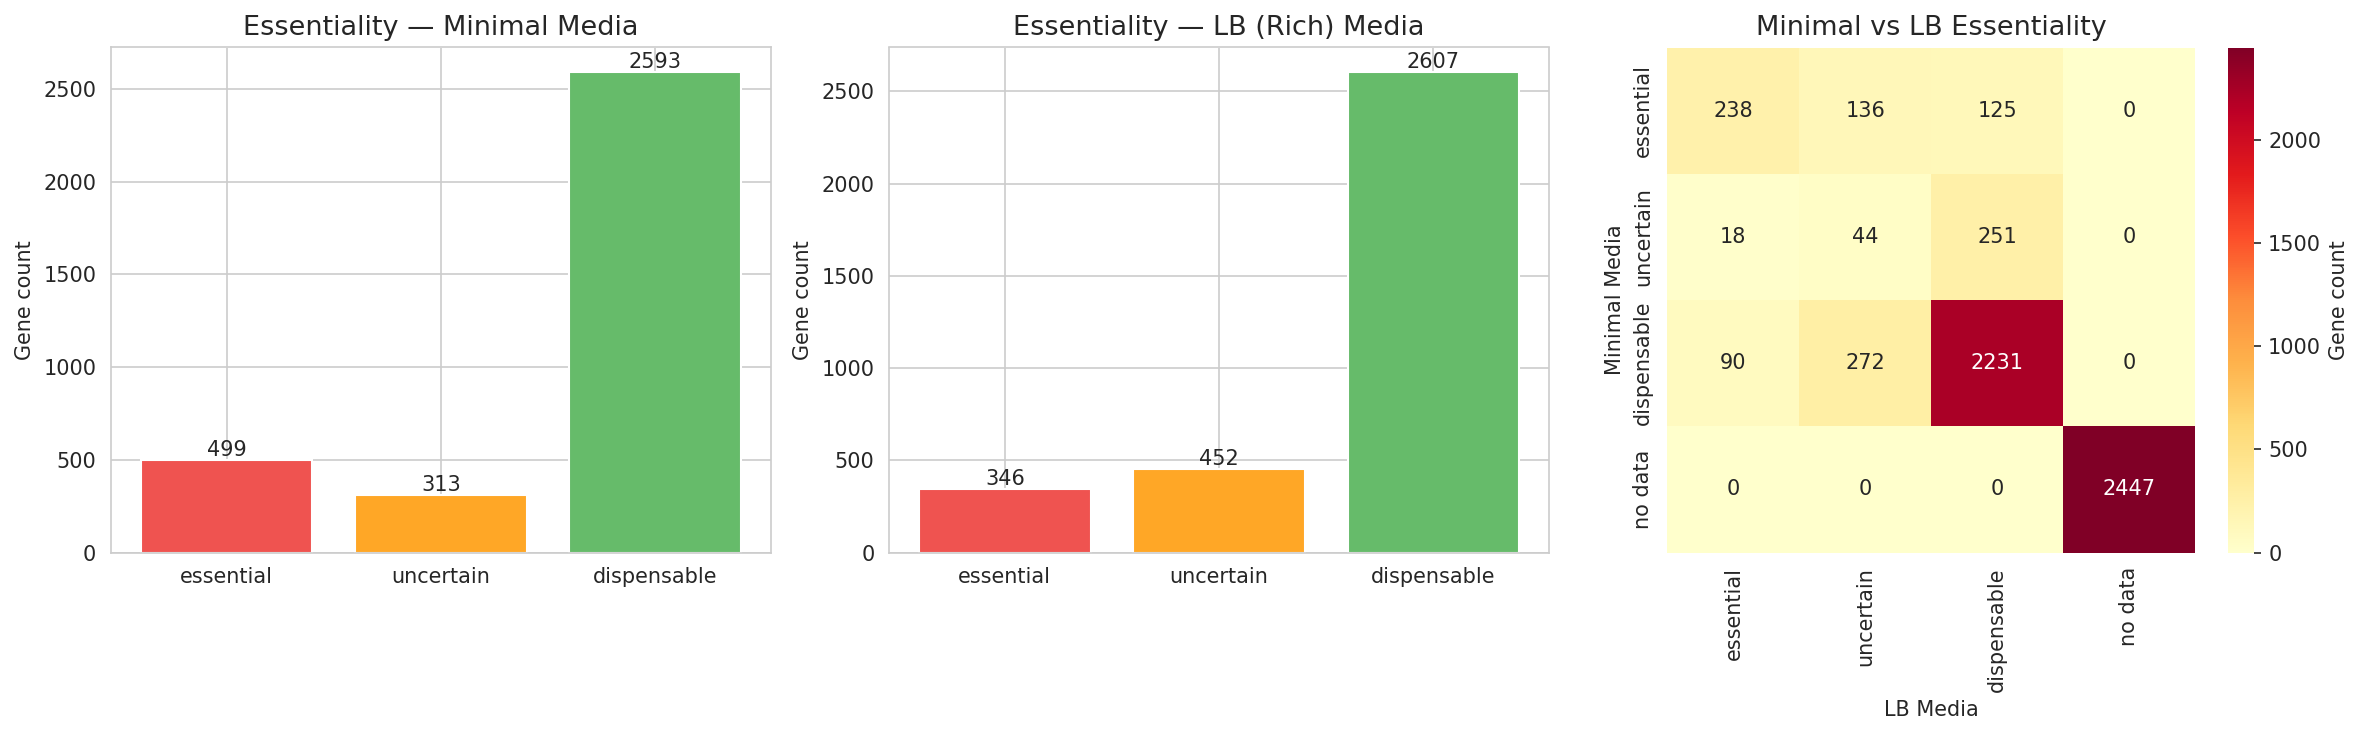 Essentiality overview. From acinetobacter_adp1_explorer.
An untestable contrast is not a null result. The same logic applies beyond genes. In the ENIGMA Carbon Census, 74/83 compounds (89%) were organism-dark, meaning they could not be linked to organism-level utilization through the queried resources. A groundwater-versus-necromass contrast was therefore untestable and confounded rather than null. 5 A contrasting case shows a sampling bias that was measured and found not to explain a weak result. Among 224 selected species, clinical sampling bias was real. Yet a one-sided test of whether environmental species showed a stronger environment–gene-content signal than human-associated species was not significant (U=1536, p=0.83). 13 callability-limited-comparative-inference generalizes this distinction between a measured null and a callability failure. 5,13
Tensions and Caveats
- Conservation as a graded correlate, with unreconciled magnitudes. One analysis reports essential genes as 82% core, versus 66% for always-neutral genes. Separately, it found that fitness breadth was only weakly associated with core status (Spearman rho=0.086, p=8.1e-230). 11 Another analysis reports essential genes as 86.1% core, versus 81.2% for non-essential genes (median odds ratio 1.56). The enrichment was significant after Benjamini-Hochberg false-discovery-rate correction in 18 of 33 organisms. 6 These figures must not be averaged; see conflicts/conflict—gene-essentiality—d462367f and conflicts/conflict—core-genome-burden-paradox—39aa8e5b.
- How far predictors generalize. FBA was moderately concordant with knockouts in ADP1, but baseline FBA accuracy was low across many organisms. 2,14 See conflicts/conflict—gene-essentiality—1a13b45e, conflicts/conflict—gene-essentiality—bfe2a15f and conflicts/conflict—gene-essentiality—8cd3f219.
- Direction of coverage bias. Projects disagree on whether deep profiling inflates condition-specific calls or pleiotropic ones, where pleiotropic means fitness effects across many unrelated conditions. 10,15,16 They also disagree on whether excluding putative essentials raises or lowers baseline core fractions. 15,17 See conflicts/conflict—fitness-condition-coverage-prioritization-bias—75ed847c and conflicts/conflict—transposon-callability-bias—4e810812. One project reports that stress conditions dominate among dark genes with strong fitness effects. Another reports that truly dark genes, which remain hypothetical after reannotation, are depleted in stress relative to annotation-lag genes. Neither analysis is normalized for condition coverage. 10,18 See conflicts/conflict—experimental-prioritization-of-functional-dark-matter—6247b74c.
- Lab burden versus natural selection. The 28,017 “Costly + Conserved” genes support a selection hypothesis only; they are not a measurement of selection in nature. 12,19 They also bear on whether core status can rank essentiality candidates. See conflicts/conflict—essentiality-assay-discordance—3eeac603 and conflicts/conflict—gene-essentiality—14f53e8b. Core enrichment in a collection establishes neither low burden nor universal essentiality. 3,12 See conflicts/conflict—genetic-perturbation-coverage-bias—0037f318.
- Metal-gene conservation. The atlas reports broad metal-important genes as 87.4% core, against a 76.9% baseline. 20 A single-strain analysis of Desulfovibrio vulgaris Hildenborough reports heavy-metal genes as 71.2% core. 17 Definitions, thresholds and organism sets differ, so the two values are not interchangeable. 20,17,15 See conflicts/conflict—condition-specific-fitness—369569e8, conflicts/conflict—condition-specific-fitness—74a89753 and conflicts/conflict—gene-essentiality—1ce33d4d.
- Load-bearing limitations. The ADP1 knockout ground truth (3,092 genes, 499 essential) prioritized minimal-medium calls and fell back to LB calls, so the minimal-medium label includes some rich-medium calls. Its five thresholds were tested without multiple-testing correction. 2 The dark-matter set-cover percentages do not match a 500-gene denominator, and the report does not explain why. 10 In the census, lauric acid is callable only through reference-bacterium fitness data. It has no isolate-level placement and sits outside both arms of the 8-versus-”other 75” split, a framing tension the report leaves unreconciled. The “other 75” null reflects missing evidence, not biological absence. 5 The Fitness Browser panel is biased toward culturable Proteobacteria and toward rich media. 4,11
Where to Go Deeper
- essentiality-assay-discordance — read first: the ADP1 RB-TnSeq-versus-knockout confusion matrix, and why continuous fitness outperformed binary calls. 2
- transposon-callability-bias — why the 48-organism essential-gene counts are upper bounds, and how gene length enters. 4
- genetic-perturbation-coverage-bias — which genes and organisms never enter a perturbation collection. 3,4
- fitness-condition-coverage-prioritization-bias — how uneven condition panels steer candidate rankings and experiment design. 10
- gene-essentiality — the full synthesis, covering media dependence, FBA performance, and capability versus dependency. 1,2,21
- callability-limited-comparative-inference — how to tell an untestable contrast from a null one. 5
Key entities: tnseq, kescience-fitnessbrowser, kbase-ke-pangenome, independent-component-analysis, gapmind.
Reports: Triple Essentiality Concordance Analysis for *Acinetobacter baylyi* ADP1, ADP1 Deletion Collection Phenotype Analysis, The Pan-Bacterial Essential Genome, Conservation vs Fitness — Linking FB Genes to Pangenome Clusters, Fitness Effects vs Conservation — Quantitative Analysis, Functional Dark Matter — Experimentally Prioritized Novel Genetic Systems, Core Gene Paradox — Why Are Core Genes More Burdensome?, ENIGMA Carbon Census — Tiered Knowledge Census of 83 Enrichment Compounds.