Raw report: metabolic_capability_dependency Feeds into: biosynthetic-prototrophy-and-auxotrophy, biosynthetic-self-sufficiency-and-cultivation, capability-versus-kinetic-predictability, community-metabolic-interdependence, computational-pathway-prediction-validation, condition-space-dimensionality, condition-specific-fitness, costly-dispensable-gene-loss, cross-condition-metabolic-comparability, cross-species-fitness-transferability, ecotype-clustering-validity, ecotype-environment-gene-content, fitness-condition-coverage-prioritization-bias, gene-essentiality, gene-function-acquisition-depth, genetic-perturbation-coverage-bias, metabolic-capacity-specialization, metabolic-model-gapfilling, occurrence-versus-catabolic-activity, pangenome-conservation-fitness-decoupling, pangenome-core-boundary-and-clade-size-bias, pangenome-integration, pangenome-openness-determinants, pathway-versus-reaction-evidence-resolution, phylogenetic-confounding-of-pangenome-associations, respiratory-capacity-and-nadh-load, taxonomic-nomenclature-reconciliation
Overview
This study compares genomic metabolic capability with experimentally measured metabolic dependency across 1,695 pathway-organism pairs from 48 organisms, using GapMind pathway completeness predictions, Fitness Browser gene-fitness data, and SEED subsystem annotations as a pathway-membership proxy. It tests whether complete but fitness-neutral pathways are common, whether latent capabilities relate to pathway conservation and pangenome openness, and whether within-species metabolic profiles form environment-linked ecotypes. 1
Key Findings
Latent capabilities
A pathway was classified as an active dependency when mean absolute fitness t-score exceeded 2.0 or more than 20% of its genes were essential; as a latent capability when mean absolute t-score was below 1.0 and fewer than 5% of genes were essential; and as intermediate between these thresholds. Of 1,695 genomically complete pathway-organism pairs from 48 organisms, 267 (15.8%) were latent, meaning the genome encodes the pathway but it showed no detectable fitness importance under the tested conditions; 547 (32.3%) intermediate, and 881 (51.9%) active. The pathway category strongly predicted dependency class (χ²=163.6, df=4, p=2.5×10⁻³⁴). 1
Dependency class differed by pathway category (χ²=163.6, df=4, p=2.5×10⁻³⁴). Carbon source utilization pathways were most likely to be latent: 217 of 892 (24.3%) were latent, 320 (35.9%) intermediate, and 355 (39.8%) active. Amino acid biosynthesis pathways were predominantly active: 48 of 735 (6.5%) were latent, 220 (29.9%) intermediate, and 467 (63.5%) active. Other pathways were rarely latent: 2 of 68 (2.9%) were latent, 7 (10.3%) intermediate, and 59 (86.8%) active. Thus, carbon source utilization pathways were 3.7× more likely to be latent than amino acid biosynthesis pathways, using the reported 24.3% and 6.5% fractions. The report frames this contrast as a specific, testable prediction: organisms in nutrient-rich environments should disproportionately lose carbon-pathway genes over evolutionary time, while amino acid biosynthesis genes are retained under stronger purifying selection. That gene-loss prediction was not tested in this analysis. Across all three categories the totals were 881 (51.9%) active, 547 (32.3%) intermediate and 267 (15.8%) latent, out of 1,695 classified pairs. 1
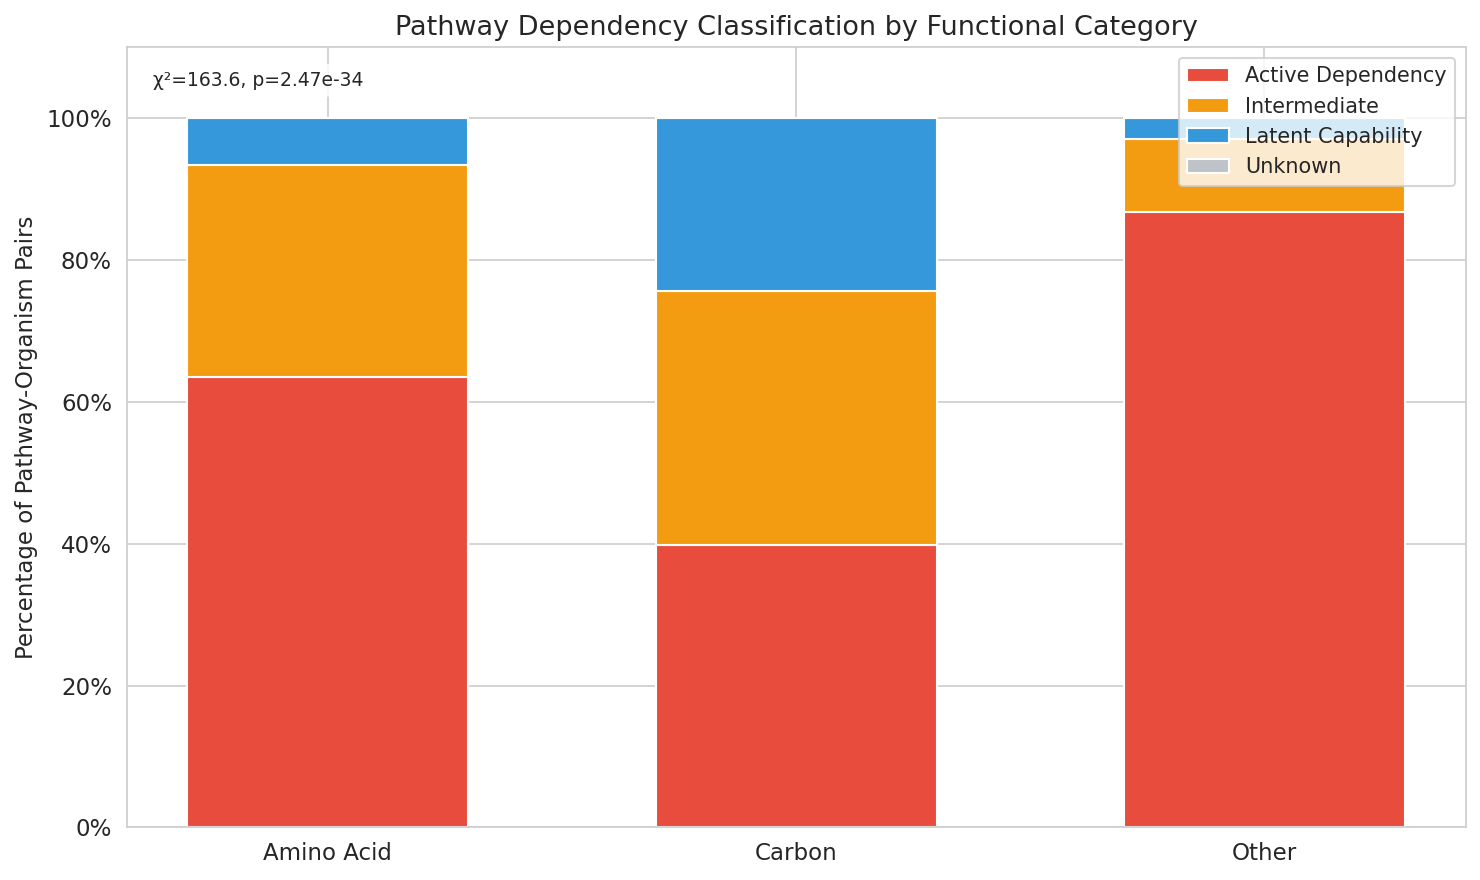 Pathway dependency class distribution by category. From metabolic_capability_dependency.
The latent fraction varied across organisms from 0–31.6%, with a mean of 15.0%; Pseudomonas syringae strains and Klebsiella michiganensis had the highest reported proportions. Sensitivity analysis across 16 combinations of active thresholds from 1.5–2.5 and latent thresholds from 0.75–1.25 produced latent fractions from 4.7% to 21.1%, with SD = 5.9 percentage points; the qualitative conclusion that a non-trivial fraction of complete pathways are fitness-neutral, especially carbon pathways, held across the tested range. 1
Conservation and pangenome openness
Pathway-level conservation did not distinguish latent capabilities from active dependencies. Among 755 active dependencies, mean conservation was 0.829 and the median was 1.000; among 508 intermediate pathways, mean conservation was 0.907 and the median was 1.000; and among 248 latent capabilities, mean conservation was 0.869 and the median was 1.000. Latent capabilities therefore had slightly higher mean conservation than active dependencies, with Mann–Whitney U p = 0.94 for active > latent and rank-biserial r = 0.052; this pathway-level test did not support H2a. 1
At the clade level, the study supported H2b: after aggregating 41 organisms to 22 unique species clades so that multiple Fitness Browser strains from one clade shared a single pangenome-openness value, latent capability rate correlated positively with pangenome openness (Spearman ρ = 0.69, p = 0.0004, n = 22 clades). Clades with more fitness-neutral complete pathways therefore tended to have more dynamic, less-conserved pangenomes, consistent with a Black Queen framework signal operating at the level of genome dynamics and community context rather than simple per-pathway conservation. 1
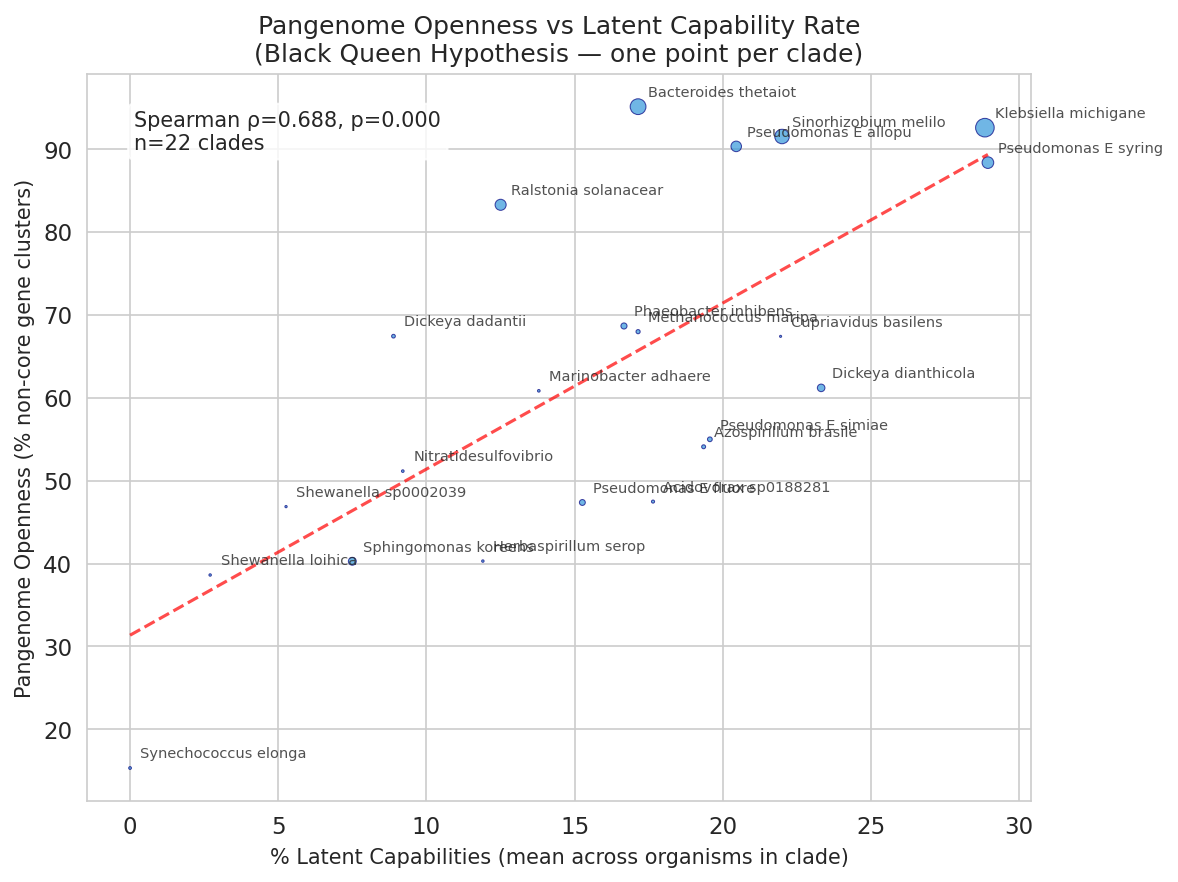 Pangenome openness vs latent capability rate. From metabolic_capability_dependency.
The pangenome dataset contained 7,334 species. Among well-sampled pathogens with more than 2,500 genomes, Klebsiella pneumoniae was reported as most open (99.05% open; 0.95% core genes), while Mycobacterium tuberculosis was reported as most closed (97.4% open; 2.6% core genes). 1
Metabolic ecotypes
All 10 target species, each with at least 50 genomes and at least 15 variable pathways, showed metabolic clustering with silhouette scores greater than 0.2. Scores ranged from 0.35 for PALSA-747 sp. to 0.89 for Salmonella enterica. The reported species-level results were: Salmonella enterica, 11,396 genomes, k=6, silhouette 0.894; Stutzerimonas stutzeri, 149 genomes, k=2, 0.780; Alteromonas macleodii, 56 genomes, k=2, 0.738; Acetatifactor intestinalis, 59 genomes, k=6, 0.657; Ruminococcus E sp., 53 genomes, k=2, 0.609; Phenylobacterium sp., 51 genomes, k=2, 0.544; Limivicinus sp., 50 genomes, k=2, 0.528; Pelagibacter sp., 79 genomes, k=2, 0.430; Prochlorococcus A sp., 74 genomes, k=2, 0.429; and PALSA-747 sp., 51 genomes, k=2, 0.349. 1
Metabolic clusters were significantly associated with isolation environment in Salmonella enterica (χ²=1570.2, df=25, p<0.0001) and Phenylobacterium sp. (χ²=12.2, df=1, p=0.0005), but not in the marine organisms Stutzerimonas, Alteromonas, Pelagibacter, and Prochlorococcus. The strongest pathway heterogeneity occurred in valine/leucine biosynthesis (0.60), tryptophan biosynthesis (0.51), and lysine/threonine biosynthesis (0.49). 1
The study interprets the strong Salmonella enterica structure as consistent with strain-level differentiation across clinical, food, and environmental isolation sources, while the non-significant marine associations may reflect insufficient isolation-source metadata, depth- or nutrient-zone structure, or pathway annotations that lack resolution for relevant gene-content differences. These ecological interpretations are observational and do not establish causality. 1
Data and exclusions
The analysis covered 48 organisms from the Fitness Browser, including diverse proteobacteria, firmicutes, and other phyla. It used kbase_ke_pangenome.gapmind_pathways, pangenome, and gtdb_metadata for pathway completeness (305M rows, 80 pathways, 293K genomes), pangenome openness, and NCBI taxonomy for organism matching, and kescience_fitnessbrowser.genefitness, gene, and seedannotation for gene-level fitness scores, essentiality inference, and SEED-proxy pathway mapping. Generated datasets included 23,424,480 per-genome pathway records, 27,690 species pathway summaries, 3,065 pathway-fitness aggregates, 1,695 classifications, 1,511 conservation records, 7,334 pangenome-openness records, 800 per-(species, pathway) heterogeneity scores across the 10 target species, 12,018 genome cluster assignments with principal-component coordinates, 10 per-species clustering-quality (silhouette, k) summaries, and 370 pathway-marker signatures distinguishing ecotypes, with chi-square statistics, Bonferroni-corrected p-values and per-cluster rate ranges. Pathways were mapped to Fitness Browser genes through SEED annotations, rather than direct GapMind gene assignments, to compute fitness aggregates. Hypothesis H2 was tested by joining pathway dependency classes with pangenome conservation. Metabolic ecotypes were detected by hierarchical clustering and principal component analysis of within-species pathway variation. 1
Two GapMind pathways, deoxyribonate and myoinositol, had no matching SEED subsystem role descriptions and were excluded from all analyses. Full-name phenylalanine and tyrosine lacked SEED coverage, but their three-letter equivalents, phe and tyr, were included through abbreviation-based matching. Alanine was excluded from classification for every organism because fewer than 3 SEED-annotated genes met the minimum coverage threshold. 1
Caveats and limitations
The study states that SEED-proxy mapping can introduce false positives because related subsystem annotations may not represent direct GapMind pathway membership; direct GapMind per-step gene assignments would improve precision. These false-positive genes from related subsystems dilute the fitness signal and could misclassify pathways that would otherwise differ in conservation. The large intermediate zone (32.3%) makes the latent fraction moderately sensitive to threshold tightening, as shown by the 4.7%–21.1% sensitivity range. 1
Fitness experiments are biased toward laboratory conditions, so pathways that are important in environments not represented by the tested media may appear latent, inflating the latent fraction. Pathway-level conservation cannot detect partial erosion or progressive loss of individual genes within otherwise complete pathways, and only 48 organisms were fitness-tested among 293,000 genomes with pathway predictions, limiting generalization across taxa. 1
The conservation comparison may be affected by species-level averaging: many genomes in a species clade were not fitness-tested, potentially inflating apparent conservation of pathways classified from a limited set of organisms. The reported Black Queen signal may also be difficult to detect because gene loss can require longer evolutionary timescales than current sampling captures. As a proposed explanation of this evolutionary lag, the report suggests that latent capabilities may be mid-loss in some lineages but still appear conserved at the species level. 1
The ecotype analysis is observational. Environment-cluster associations, including those in Salmonella and Phenylobacterium, may be confounded by phylogenetic structure because explicit phylogenetic correction was not performed. Marine non-associations may reflect coarse NCBI isolation-source metadata or pathway-level annotations that miss ecologically relevant gene-content and expression differences. 1
An attempted organism-to-clade linkage using NCBI taxonomy IDs from kbase_ke_pangenome.gtdb_metadata returned zero matches because the relevant column contained boolean strings rather than numeric taxids. Downstream analyses therefore used organism-level fitness aggregates without an explicit clade-level linkage, which may reduce the precision of the H2a conservation comparison. 1
Literature context and interpretation
The report reads its H2a and H2b results together as mixed rather than uniform support for the Black Queen framework, the idea that costly functions are lost when neighbours supply them. The report cites the Black Queen Hypothesis as Morris, Lenski and Zinser (2012), mBio 3(2):e00036-12, DOI 10.1128/mBio.00036-12. It describes the positive clade-level association between latent capability rate and pangenome openness as consistent with ongoing streamlining. It also notes that per-pathway cross-genome conservation did not distinguish latent from active pathways, and it infers that the signal operates at the level of genome dynamics and community context. The report aligns the pathway-level null with Schakel et al. (2025), who showed that cross-feeding-based gene loss requires spatial structuring and is not straightforwardly predicted by the fitness cost of gene retention alone. This is cited literature context, not a test performed in this analysis. 1
The report cites D’Souza et al. (2014) as showing that biosynthetic gene loss provides a ~13% fitness benefit when metabolites are available from neighbors. This is a literature result, not a measurement made in this analysis. 1
The report aligns H1 with Ramoneda et al. (2023). That study mapped amino acid auxotrophies across >26,000 genomes using GapMind and found that auxotrophies cluster in nutrient-rich, host-associated environments; the report presents this as consistent with carbon-pathway latency in copiotrophic organisms. Elsewhere the report gives the size of the Ramoneda et al. (2023) survey as 26,277 bacterial genomes, in the context of ecological partitioning of amino acid dependencies. The report interprets the most variable pathways, valine/leucine (0.60), tryptophan (0.51) and lysine/threonine (0.49) biosynthesis, as cases where some populations retained biosynthetic independence while others lost it. That interpretation is contextual and was not directly tested. For the marine non-associations, the report cites Nowinski et al. (2023): ecological divergence in marine bacteria is shaped by gene content and expression, a signal that pathway-level clustering may partially miss. 1
Proposed future work
- Gene-level conservation analysis: the pathway-level conservation comparison does not directly test the Black Queen prediction of progressive gene loss. The report proposes replacing it with per-gene dN/dS or gene presence/absence across a phylogeny. 1
- Direct GapMind gene mapping: use GapMind per-step gene assignments rather than the SEED proxy to improve pathway-to-fitness mapping precision and reduce false positives. 1
- Longitudinal validation: identify lineages with recent gene loss events (singletons or auxiliary genes in the pangenome) in pathways classified as latent. Then verify that these represent actual deletion events in the phylogeny. 1
- Environmental metadata enrichment: supplement NCBI isolation source with trait databases such as BacDive and GTDB environmental labels to improve resolution of the ecotype-environment association test. 1
- Cross-species latency patterns: test whether organisms with higher latent fractions are more likely to encode public-goods pathways or to co-occur with cross-feeding partners in community datasets. This is a proposed test, not a reported result. 1
Figures
- Pathway dependency-class distribution by category:
figures/nb03_stacked_bar.png1 - Scatter of mean absolute t-score versus percentage of essential genes, colored by dependency class:
figures/nb03_scatter.png1 - Per-organism breakdown of active versus latent pathway counts:
figures/nb03_organism_overview.png1 - Pathway conservation by dependency class:
figures/nb04_conservation_boxplot.png1 - Cumulative distribution of conservation rates by dependency class:
figures/nb04_conservation_cdf.png1 - Pangenome openness versus per-clade latent capability rate (Spearman ρ=0.69, p=0.0004, n=22 clades):
figures/nb04_openness_scatter.png1 - Principal-component analysis of pathway profiles for all 10 target species, colored by cluster:
figures/nb05_pca_all_species.png1 - Pathway heterogeneity overview (top 30 most variable pathways across target species):
figures/nb05_pathway_heterogeneity.png1 - Salmonella enterica metabolic-profile heatmap:
figures/nb05_heatmap_Salmonella_enterica.png1 - Prochlorococcus metabolic-profile heatmap:
figures/nb05_heatmap_Prochlorococcus_A_sp000635495.png1 - Pelagibacter metabolic-profile heatmap:
figures/nb05_heatmap_Pelagibacter_sp003209915.png1 - Clustered genome-by-pathway heatmaps for each of the 10 target species:
figures/nb05_heatmap_*.png1
Slots Into
- condition-specific-fitness — The 15.8% latent fraction, carbon-versus-amino-acid contrast, threshold sensitivity, and laboratory-condition limitation show that genomic pathway completeness does not by itself establish fitness dependence. 1
- gene-essentiality — The active, intermediate, and latent classes are defined using pathway-level mean absolute fitness t-scores and percentages of essential genes. 1
- metabolic-model-gapfilling — GapMind completeness predictions, SEED-proxy mapping, excluded pathways, and the proposed direct GapMind gene mapping expose how annotation choices affect metabolic capability analysis. 1
- pangenome-integration — The positive association between latent capability rate and pangenome openness (ρ = 0.69, p = 0.0004, n = 22 clades) connects fitness-neutral pathways to pangenome dynamics. 1
- ecotype-environment-gene-content — All 10 target species formed metabolic clusters, with significant environment-cluster associations in Salmonella enterica and Phenylobacterium sp. 1
- gene-function-acquisition-depth — The findings distinguish encoded metabolic capability from measured dependency and identify pathway-category-specific functional realization. 1
- community-metabolic-interdependence — The 15.8% latent fraction is read alongside the Black Queen framework. The clade-level openness association contrasts with the pathway-level conservation null, and the report cites D’Souza et al. (2014) and Schakel et al. (2025) as context, with evolutionary lag as a proposed explanation. 1
- biosynthetic-prototrophy-and-auxotrophy — Amino acid biosynthesis pathways were mostly active (6.5% latent). Valine/leucine, tryptophan and lysine/threonine biosynthesis were the most heterogeneous pathways, read against Ramoneda et al. (2023). 1
- ecotype-clustering-validity — All 10 target species had silhouette scores > 0.2, ranging from 0.35 to 0.89, with no phylogenetic correction. 1
- computational-pathway-prediction-validation — Fitness data test GapMind completeness predictions, but only through a SEED-proxy mapping that can introduce false-positive pathway genes. 1
- pathway-versus-reaction-evidence-resolution — The analysis relies on SEED subsystem proxies rather than direct GapMind per-step gene assignments, and pathway-level clustering may miss gene-content differences. 1
- pangenome-openness-determinants — Pangenome openness for 7,334 species, with Klebsiella pneumoniae and Mycobacterium tuberculosis as the reported open and closed extremes among well-sampled pathogens. 1
- pangenome-conservation-fitness-decoupling — Pathway-level conservation did not distinguish latent from active pathways, and the completeness-based measure cannot detect partial gene erosion. 1
- pangenome-core-boundary-and-clade-size-bias — Species-level averaging over clades with few fitness-tested members may inflate apparent conservation. 1
- costly-dispensable-gene-loss — The report proposes that latent capabilities may be mid-loss in some lineages yet still appear conserved at the species level. It also frames the carbon-versus-amino-acid latency contrast as an untested gene-loss prediction and calls for phylogenetic verification of apparent deletions. 1
- fitness-condition-coverage-prioritization-bias — Laboratory media may omit conditions in which pathways matter, potentially inflating the latent fraction. 1
- genetic-perturbation-coverage-bias — Fitness data for 48 organisms cover only a small fraction of the 293,000 genomes with pathway predictions. 1
- taxonomic-nomenclature-reconciliation — NCBI-taxid organism-to-clade matching returned zero matches because the metadata column held boolean strings. 1
- phylogenetic-confounding-of-pangenome-associations — Environment-cluster associations in Salmonella and Phenylobacterium were not phylogenetically corrected and may be confounded by phylogenetic structure. 1