Raw report: module_conservation Feeds into: cofitness-network-architecture, core-gene-annotation-paradox, fitness-matched-null-models, fitness-module-detection-sensitivity, gene-essentiality, genetic-perturbation-coverage-bias, module-level-coinheritance, ontology-and-category-schema-sensitivity, pangenome-conservation-fitness-decoupling, pangenome-core-boundary-and-clade-size-bias, pangenome-integration, transposon-callability-bias, two-speed-bacterial-genome
Overview
This analysis uses independent component analysis (ICA), a decomposition method for identifying co-regulated fitness modules, together with pangenome conservation mappings to test whether module genes and cross-organism module families preferentially occupy the bacterial core genome. It analyzes 1,116 co-regulated ICA fitness modules across 32 organisms (fitness_modules/data/modules/), cross-organism module families, gene-to-cluster conservation mappings, and essentiality classifications. 1
Key Findings
Module Genes Are More Core Than Average
Module genes are 86.0% core, compared with 81.5% for all genes, a difference of +4.5 percentage points. The enrichment is statistically strong (OR=1.46, p=1.6e-87), indicating that co-regulated functional units preferentially reside in the conserved core genome, although the absolute effect is modest because the baseline core rate is already high. 1
Most Modules Are Core
Of 974 modules with >=3 mapped genes, 577 (59%) are core modules (>90% core genes), 349 (36%) are mixed modules (50-90% core), and 48 (5%) are accessory modules (<50% core). The median module is 93.4% core, showing that most co-regulated fitness-response units are embedded in the conserved genome. 1
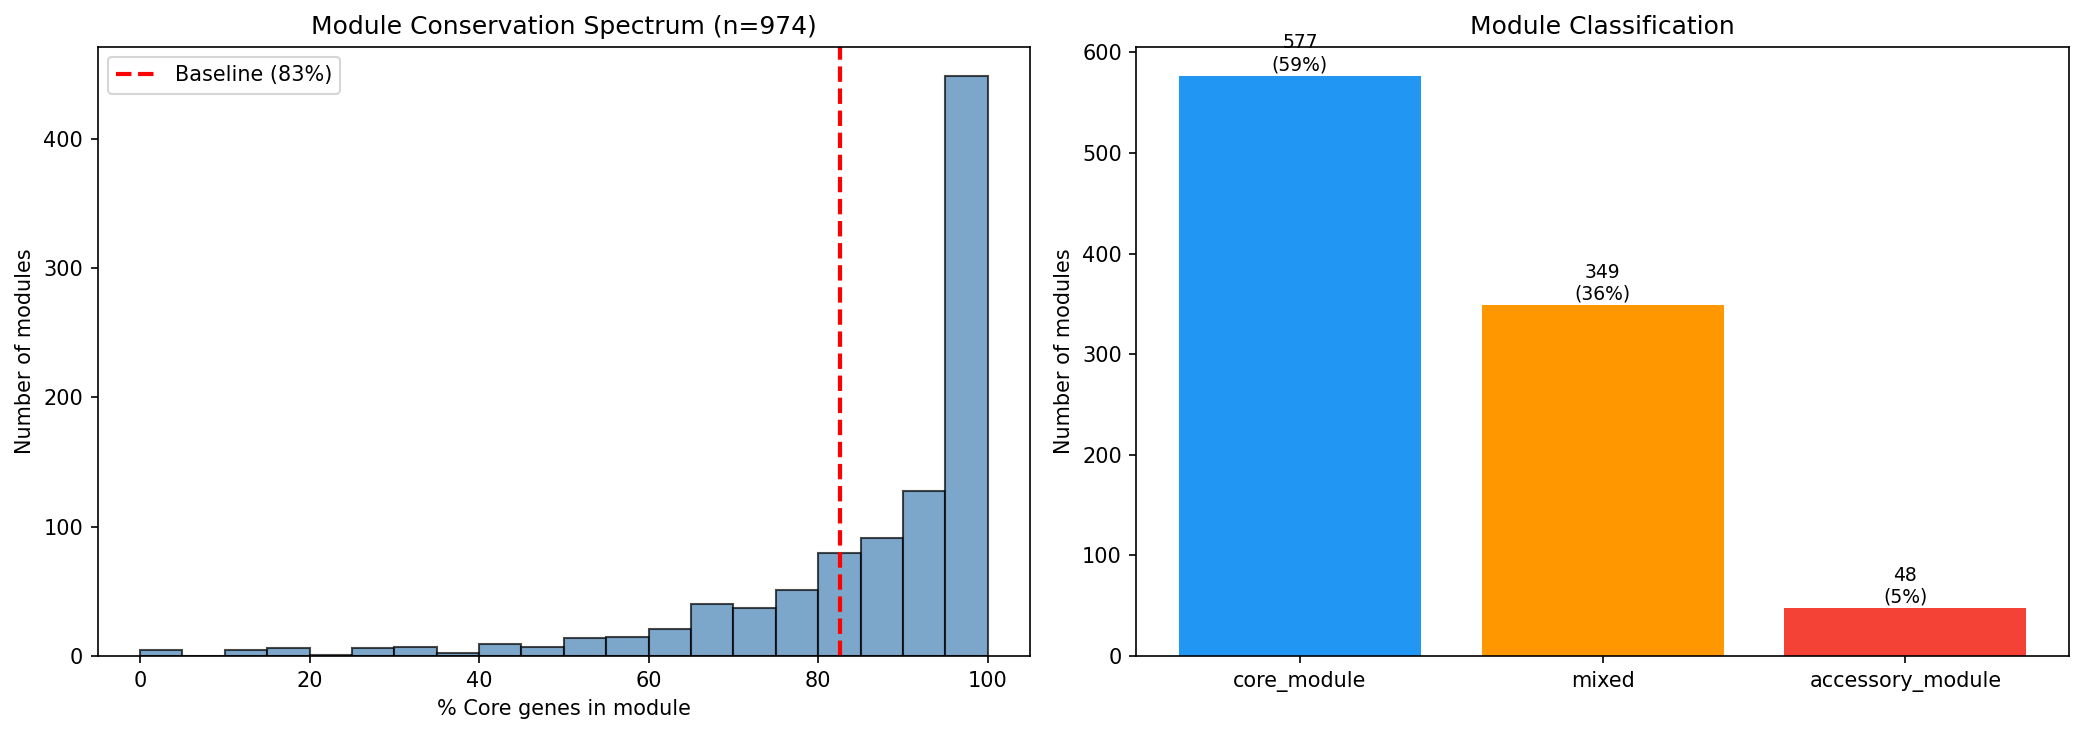 Module Core Distribution. From module_conservation.
The report’s figure “Module Core Distribution” (figures/module_core_distribution.png) shows the distribution of per-module core fractions. 1
Family Breadth Does Not Predict Conservation
Module families spanning more organisms do not have higher core fractions: the Spearman correlation was rho=-0.01 with p=0.914. Families are nearly all core regardless of the number of organisms they span, suggesting that conservation is a property of individual genes rather than the cross-organism scope of their regulatory module; the high core-genome baseline of ~82% leaves little room for a breadth-dependent gradient. 1
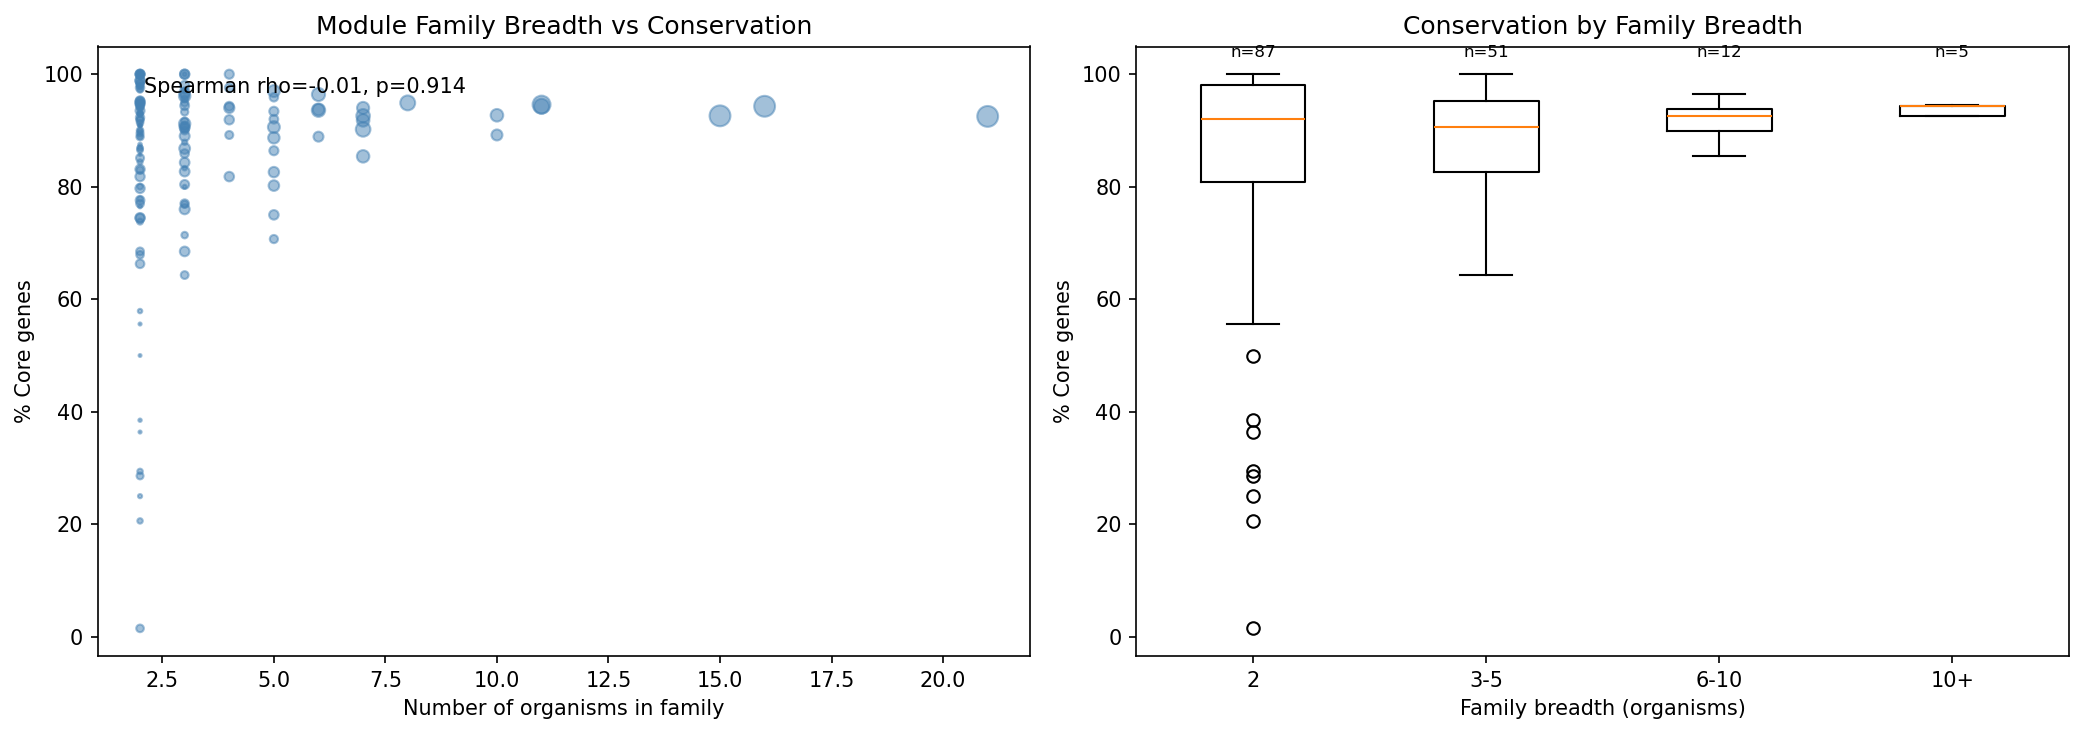 Family Breadth vs Conservation. From module_conservation.
The report’s figure “Family Breadth vs Conservation” (figures/family_breadth_vs_conservation.png) plots module-family breadth against core fraction. 1
Accessory Module Families Exist
Thirty-eight families have <50% core genes. These are co-regulated accessory gene modules that are conserved across organisms, and they may represent horizontally transferred functional units or niche-specific operons; this interpretation is a hypothesis because the analysis identifies conservation patterns rather than directly demonstrating horizontal transfer or niche-specific regulation. 1
Essential Genes Are Absent from Modules
Zero essential genes appear in any module. Because ICA requires measurable fitness variation from transposon-insertion data, essential genes with no usable insertion-based fitness data are invisible to the modules, so the modules represent the non-essential portion of the genome. 1
Interpretation and Context
The 86.0% module-gene core fraction versus the 81.5% all-gene baseline supports enrichment of co-regulated functional units in the conserved genome, but the +4.5 percentage-point difference is modest under the ceiling imposed by the already high baseline. The null association between family breadth and conservation (rho=-0.01, p=0.914) redirects interpretation toward gene-level conservation rather than module-family scope. 1
The analysis builds on the Fitness Browser data and ICA decomposition approach of Price et al. (2018), Saelens et al. (2018), cited as literature support (not a result measured in this project) for ICA outperforming other decomposition methods on microbial gene expression data, and core/accessory pangenome definitions reviewed by Vernikos et al. (2015). The finding that 59% of fitness modules are >90% core extends the notion of core conservation from individual genes to functionally coherent regulatory units. 1
Caveats
The baseline core rate is already ~81.5%, limiting the maximum observable enrichment; consequently, the +4.5 percentage-point difference to 86% is statistically significant but represents a modest absolute effect. 1
The pangenome-linked analysis covers a 29/32 organism subset because Cola, Kang, and SB2B lack pangenome links; their species had too few genomes in GTDB for pangenome construction. 1
Upstream ICA module membership uses |Pearson r| >= 0.3 with a maximum of 50 genes per module, so this threshold can influence which genes are classified as module members and therefore the conservation composition. 1
The >90% core and <50% core cutoffs used to classify core, mixed, and accessory modules are convenient classification thresholds rather than biologically motivated boundaries. 1
Essential genes are excluded from all modules because ICA requires fitness data and essential genes lack transposon insertions; therefore, the reported module conservation profiles cannot characterize essential-gene modules. 1
Data and Provenance
The analysis used ICA fitness modules from fitness_modules/data/modules/, cross-organism module families from fitness_modules/data/module_families/, the KBase pangenome gene-to-cluster conservation table conservation_vs_fitness/data/fb_pangenome_link.tsv, and essentiality classifications from conservation_vs_fitness/data/essential_genes.tsv. It generated data/module_conservation.tsv, which holds per-module conservation composition, and data/family_conservation.tsv, which holds per-family conservation summaries; notebooks 01_module_conservation.ipynb and 02_family_conservation.ipynb provide the per-module and family-breadth analyses. 1
Slots Into
- pangenome-integration — The finding that 86.0% of module genes are core versus 81.5% of all genes extends pangenome conservation analysis from individual genes to co-regulated functional units. 1
- cofitness-network-architecture — The distribution of 974 mapped modules, including 577 (59%) core modules and 38 accessory module families, characterizes the genomic conservation architecture of fitness modules. 1
- gene-essentiality — The finding that 0 essential genes appear in any ICA module clarifies how essentiality and transposon-based fitness measurements constrain module discovery. 1
- module-level-coinheritance — Module genes are 86.0% core versus 81.5% of all genes (OR=1.46, p=1.6e-87), the median module is 93.4% core, and 38 families have <50% core genes, so conservation is examined at the level of co-regulated units. 1
- two-speed-bacterial-genome — Core-enriched modules alongside 38 accessory module families conserved across organisms (hypothesized, not shown, to be horizontally transferred units or niche-specific operons) bear on the core/accessory split of genome function. 1
- pangenome-core-boundary-and-clade-size-bias — The null family-breadth result (rho=-0.01, p=0.914), the ~82% core baseline ceiling, the arbitrary 90%/50% cutoffs, and the 29/32 organism subset limited by too few GTDB genomes illustrate how core-boundary definitions and clade size constrain inference. 1
- fitness-module-detection-sensitivity — Module membership depends on |Pearson r| >= 0.3 with max 50 genes per module, and modules capture only the non-essential genome. 1
- transposon-callability-bias — Essential genes lack transposon insertions and are therefore invisible to ICA modules. 1
- genetic-perturbation-coverage-bias — The 0 essential genes in modules show that perturbation-based module discovery cannot cover the essential genome. 1
- ontology-and-category-schema-sensitivity — The 90% and 50% core/mixed/accessory cutoffs are convenient rather than biologically motivated categories. 1