Projects in this corpus disagree on whether genes important for metal tolerance sit mainly in the pangenome core (gene families shared across a species’ genomes) or in the accessory genome (families present in only some genomes). The metal atlas reports broad metal-important genes at 87.4% core versus a 76.9% baseline. 1 A single-organism analysis of Desulfovibrio vulgaris Hildenborough (DvH) reports heavy-metal genes at 71.2% core. 2 The answer decides whether metal resistance reads as a conserved cellular function or as an accessory trait. Definitions, thresholds, organism sets and stress histories differ, so the estimates cannot be averaged. 1 2 3 This tension appears in condition-specific-fitness, gene-essentiality and metal-cross-resistance.
Evidence Sides
Side A: metal-important genes are core-enriched
- The metal atlas found broad metal-important genes to be 87.4% core versus a 76.9% baseline. 1 The atlas itself attributes much of this signal to general cellular vulnerability. 4,1
- A three-tier analysis found metal-specific genes to be 89.8% core. 4,1
- The metal-specificity analysis found metal-specific genes to be 84.8% core when pooled. These genes were less enriched than general sick genes (genes with fitness defects across conditions broadly, not only under metals), which were 90.2% core. Genes important for both metal and other stresses were 94.3% core. 3 This analysis refines rather than resolves the tension, because its inclusion and classification rules differ. 3
Side B: condition-specific heavy-metal genes are less conserved
- In DvH, heavy-metal-important genes were 71.2% core. They were not significantly enriched after multiple-testing correction (adjusting significance for the number of hypotheses tested). 2
- Genes in DvH’s broader field-stress class were 83.6% core. That class includes uranium and mercury alongside other field stresses such as nitrate, so 83.6% is not a uranium/mercury-only estimate. 2
- The report offers a tentative explanation. Specific resistance mechanisms such as efflux pumps and metal-binding proteins may be accessory traits. Uranium and mercury responses may instead involve core stress pathways such as DNA repair and sulfate reduction. 2
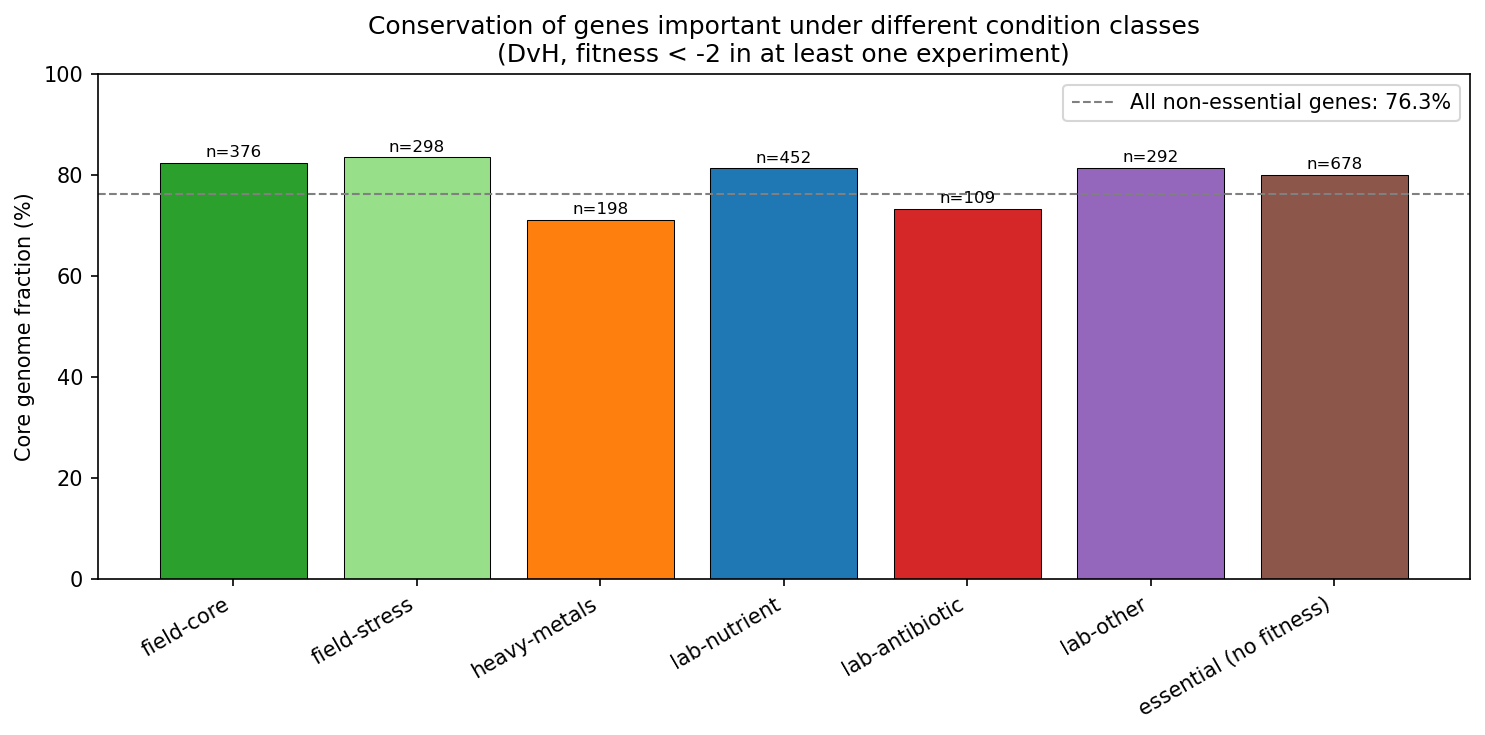 Core genome percentage for genes important under each condition class, with baseline. From field_vs_lab_fitness.
The sources differ in definitions, organism coverage, how much general stress each gene set captures, and whether putatively essential genes were excluded. 1,2,3
Possible Reconciliations
- Hypothesis: gene-class definition drives the difference. Broad “any metal defect” sets capture core vulnerability genes, while condition-specific sets may include proportionally more accessory resistance genes. The specificity ordering, with metal-specific genes below general sick genes, is consistent with this but does not settle it. 3
- Hypothesis: DvH is atypical. Its 71.2% 2 may reflect one organism’s lineage-specific gene content and stress history rather than a general pattern.
- Hypothesis: differences in thresholds and in the exclusion of putatively essential genes shift each set’s core fraction independently of biology.
Resolving Work
- Shared definition across all organisms: apply one shared metal-specific definition to the atlas organisms, including DvH, and recompute the core fractions. Does DvH remain an outlier under the same rule?
- Non-metal controls: compare metal-specific sets against non-metal condition-specific gene sets matched in size and threshold, such as antibiotic or nutrient sets. Is low conservation particular to metals or common to all narrowly defined classes?
- Dose normalization: normalize metal doses relative to each organism’s minimum inhibitory concentration (MIC), the lowest dose that prevents growth, then reclassify genes. Does dose-relative stress change which genes are called metal-specific?
- Phylogenetic contrasts: fit comparative models that account for shared ancestry among organisms. Does core enrichment of metal genes survive the correction, or does it track particular clades?
- Essential-gene handling: recompute every estimate with and without putatively essential genes. How much of the gap between estimates comes from that exclusion alone?