Raw report: adp1_deletion_phenotypes Feeds into: condition-space-dimensionality, condition-specific-fitness, fitness-module-detection-sensitivity, gene-essentiality, genetic-perturbation-coverage-bias, multi-omics-integration, pangenome-core-boundary-and-clade-size-bias, pangenome-integration, respiratory-capacity-and-nadh-load
Overview
This analysis integrates growth measurements, TnSeq essentiality classifications, functional annotations, and pangenome status for Acinetobacter baylyi ADP1 genes. The complete growth matrix contains 2,034 genes measured across 8 carbon sources; growth ratios are mutant/wild-type values, with values below 1.0 indicating growth defects and values above 1.0 indicating no defect or a slight growth advantage from experimental normalization. Mean growth ratios span a 3.3-fold range, from 0.41 on urea to 1.36 on quinate. The study organism is Acinetobacter baylyi ADP1. The report cites the deletion-collection work of de Berardinis et al. (2008), “A complete collection of single-gene deletion mutants of Acinetobacter baylyi ADP1” (Molecular Systems Biology 4:174, PMID 18319726). 1
Key Findings
Three-tier essentiality landscape
The 8 carbon sources form demanding, moderate, and robust tiers based on the fraction of genes showing growth defects. Urea is the most demanding condition, with 97.9% of genes showing severe defects at growth ratio < 0.5, whereas quinate is the most robust, with only 1.6% defective. The tier structure remains consistent across multiple thresholds. Demanding conditions are urea, acetate, and butanediol, with mean growth ratios of 0.41–0.65 and 95–100% of genes defective at ratio < 0.8; moderate conditions are asparagine and lactate, with mean ratios of 0.80–0.82 and 37–45% defective; robust conditions are glucarate, glucose, and quinate, with mean ratios of 1.25–1.36 and 0.5–2.4% defective. 1
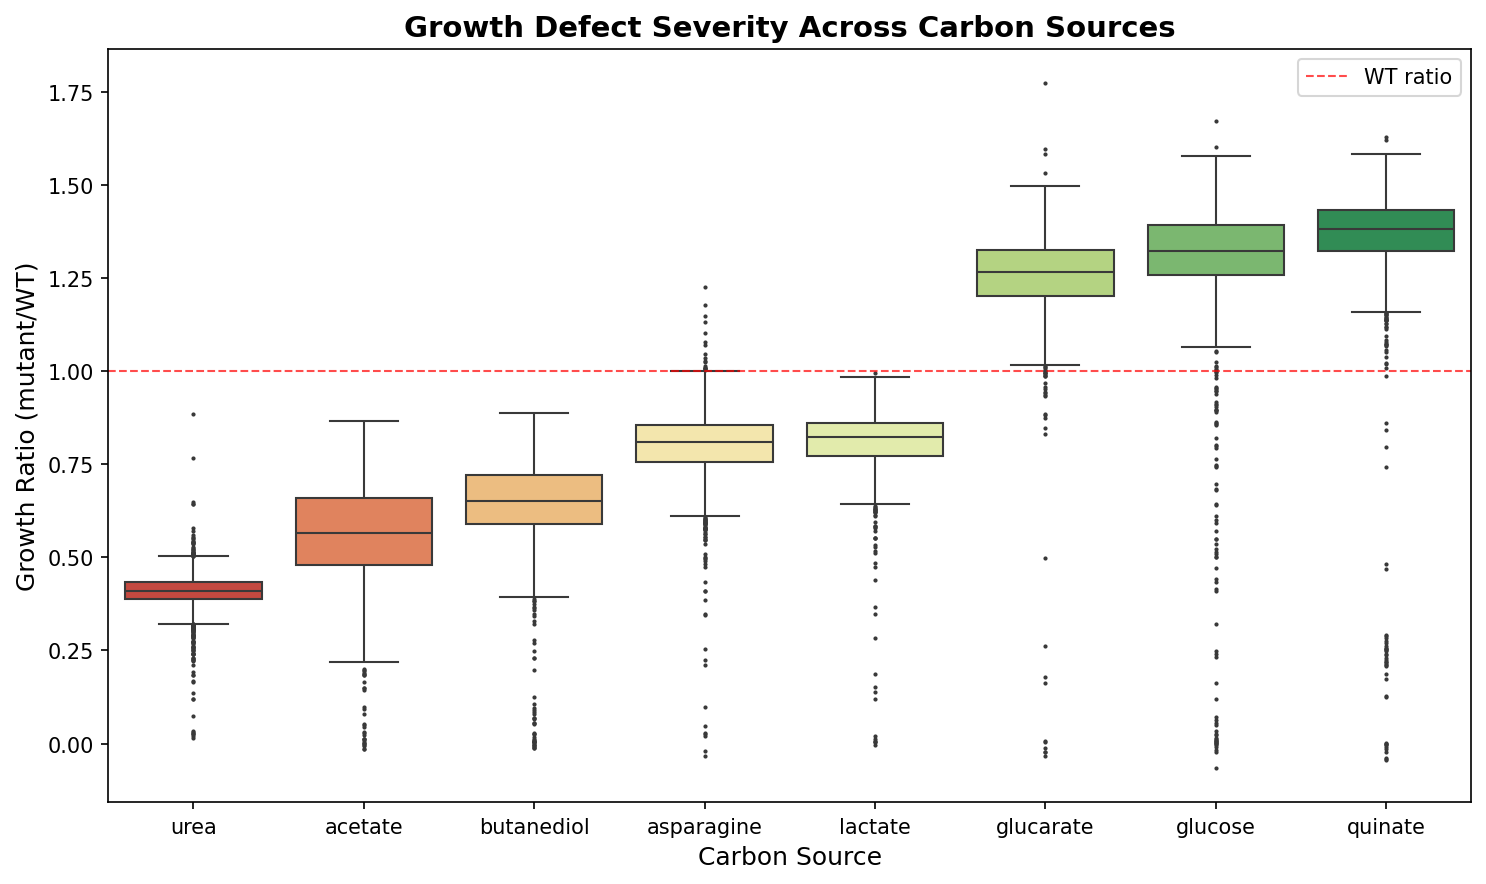 Growth defect severity across carbon sources. From adp1_deletion_phenotypes.
Largely independent condition dimensions
Principal component analysis (PCA), a method that summarizes correlated variation into orthogonal components, found that 5 components capture 82% of the variance in the 2,034×8 growth matrix. PC1 explains 36.7% and represents general growth sensitivity, with all conditions loading positively; PC2 explains 12.7% and isolates urea, which has a loading of +0.75, separating nitrogen metabolism from carbon metabolism. No single component captures more than 37% of variance. 1
Pairwise Pearson correlations are moderate at best: the highest is acetate–butanediol at r = 0.58, and the median across all 28 condition pairs is r = 0.25. These results support approximately 5 independent dimensions of phenotypic information rather than a simple two-group demanding-versus-robust model. 1
A continuous phenotype landscape with one discrete module
Hierarchical clustering of genes by their 8-condition growth profiles produced an optimal K = 3 but a low silhouette score of 0.24. The silhouette score stayed low across all tested k values (2–25), which indicates that the phenotypic landscape lacks natural cluster boundaries. The two large modules contain 1,160 and 850 genes and represent broadly sensitive versus broadly tolerant profiles; no specific functional enrichment survived false discovery rate (FDR) correction. This supports a continuous condition-dependent essentiality gradient rather than discrete functional categories. The report relates this result to the proposal by Guzman et al. (2018) that essentiality is a continuous variable. In these data, that continuity takes the form of a gradient across conditions rather than discrete functional modules. As a null result, the module-enrichment output file (data/module_enrichment.csv) contains 0 rows because no enrichment remained significant after FDR correction. 1
A small module of 24 genes is the exception: it has extreme quinate-specific defects, with a mean quinate z-score of -7.28 and near-zero scores on other conditions. These genes are aromatic degradation pathway genes and form the only discrete phenotypic module identified in the dataset. 1
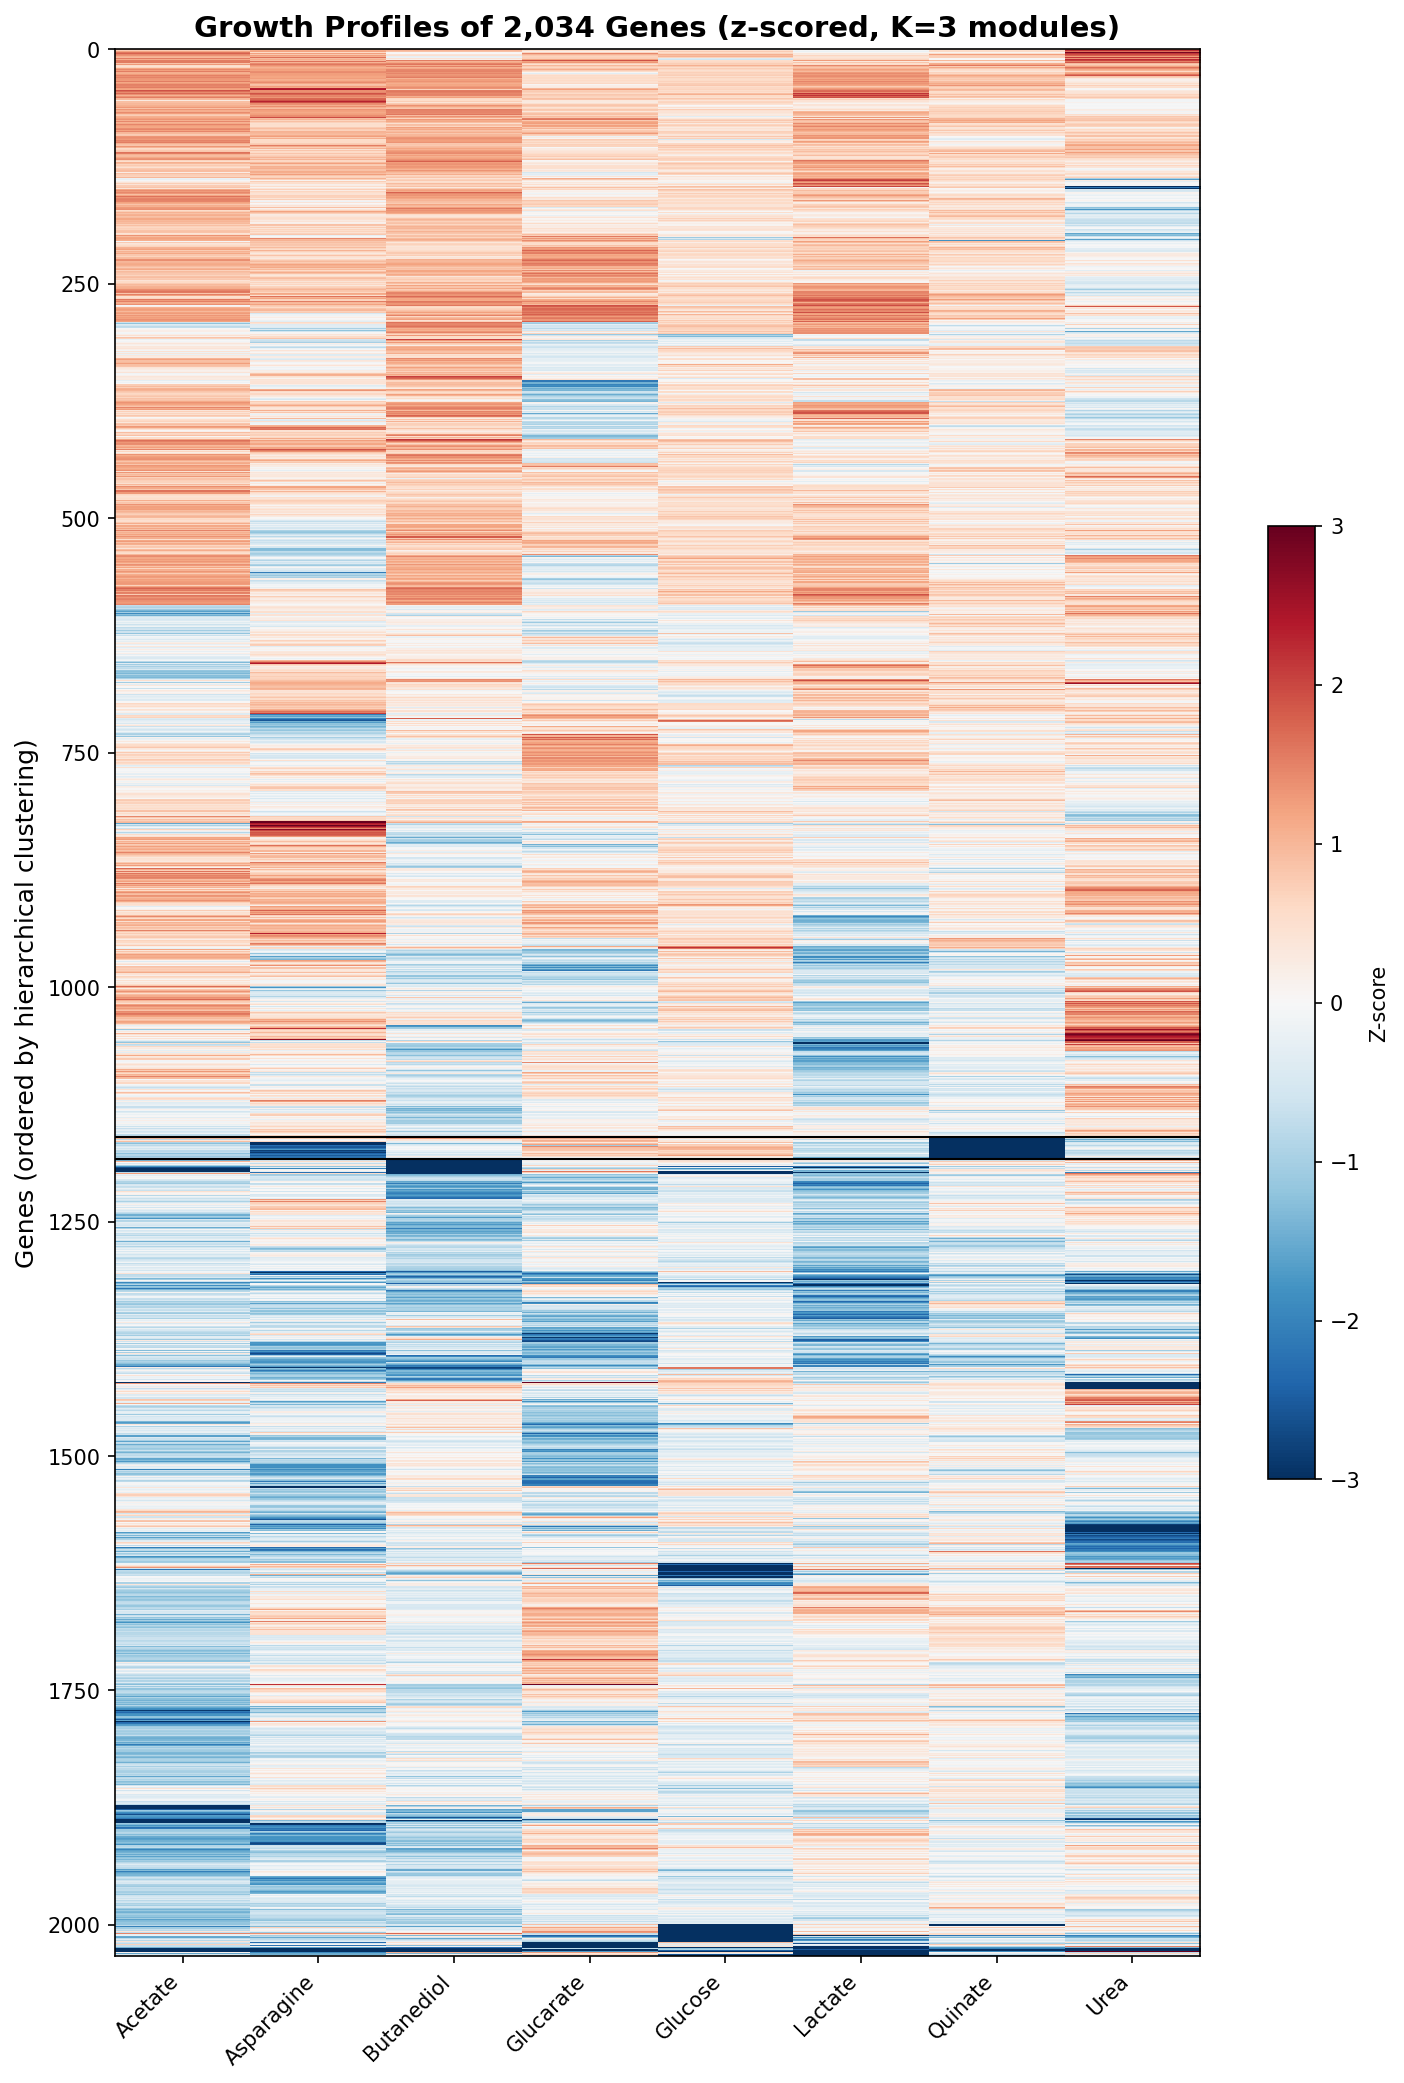 Growth profiles of all 2,034 genes ordered by hierarchical clustering. From adp1_deletion_phenotypes.
Condition-specific genes map to metabolic architecture
A total of 625 genes, or 31% of the complete matrix, have a condition-specificity score ≥ 1.0, indicating that their growth importance is concentrated on one carbon source. The top condition-specific genes correspond to expected pathways: quinate selects pcaC, pcaG, pcaH, pcaB, quiA, quiB, pqqC, and pqqD for protocatechuate/quinate degradation and PQQ biosynthesis; urea selects ureA, ureB, ureC, ureD, ureE, ureF, and ureG for the urease complex; asparagine selects aspartate ammonia-lyase and L-asparaginase; acetate selects fadB, malate synthase G, and citB for fatty acid β-oxidation and the glyoxylate shunt; glucarate selects gudD, a D-glucarate transporter, and 2,5-dioxovalerate dehydrogenase; glucose selects eda, gntT, gluconokinase, and glucose dehydrogenase (PQQ) for the Entner-Doudoroff pathway and PQQ-glucose dehydrogenase; butanediol selects 2,3-butanediol dehydrogenase and E2 acetyltransferase, associated with butanediol catabolism and the acetoin pathway; and lactate selects lldR and cyoC/cyoD, associated with lactate regulation and cytochrome oxidase. The asparagine-specific functions are assigned to asparagine catabolism and the glucarate-specific functions to glucarate degradation. 1
The quinate-specific gene set contains 51 genes at specificity > 0.5 and z < -1. In addition to core aromatic degradation genes, it includes NADH-ubiquinone oxidoreductase subunits from respiratory Complex I, suggesting the hypothesis that aromatic catabolism creates distinctive electron-transport-chain demands. PQQ biosynthesis genes are condition-specific for both quinate and glucose, consistent with PQQ-dependent dehydrogenases catalyzing the first step of both pathways. 1
TnSeq coverage gaps are associated with gene properties
Of 2,593 TnSeq-dispensable genes, 272 (10.5%) lack growth data from the deletion collection, while 2,321 have growth data. The missing genes have a mean length of 813 bp versus 981 bp for present dispensable genes, are RAST annotated at 91% versus 100%, are KO annotated at 49% versus 59%, and are pangenome-core at 76.5% versus 93.3%; the core-status difference has p = 1.4×10⁻²⁰. 1
Hypothetical proteins are enriched among missing genes: 25 are completely unannotated, with q = 2.4×10⁻²⁵, and 48 are annotated as “hypothetical protein,” with q = 3.0×10⁻⁴. The 313 uncertain-class genes have a mean length of 361 bp, 42% annotation coverage, and 31% pangenome-core status, a profile consistent with gene fragments or pseudogenes rather than true essential genes. 1
Interpretation and contribution
The quinate/protocatechuate pathway specificity agrees with Fischer et al. (2008), while the 625 condition-specific genes support the adaptive-flexibility view that binary essential/non-essential labels miss condition-dependent effects. Unlike the discrete phenotypic modules reported for chemical-genetic profiles in E. coli, this single-gene deletion analysis finds a continuous gradient in ADP1, with only the 24-gene quinate module forming a discrete exception. The result is consistent with the possibility that single-gene deletions and chemical perturbations expose different architectures, or that ADP1 metabolism is more interconnected. 1
Wetmore et al. (2015) showed that RB-TnSeq (random barcode transposon sequencing) across diverse conditions identifies condition-specific gene functions. This analysis uses single-gene deletions rather than TnSeq but reaches the same conclusion: condition-specific phenotyping increases functional annotation yield. The 625 condition-specific genes include many with known functions that would not be detected on a single carbon source. The report cites that work under the title “Rapid quantification of mutant fitness in diverse bacteria by sequencing randomly bar-coded transposons.” Its pangenome comparison further links deletion-collection coverage to evolutionary conservation: the 272 missing dispensable genes are less conserved than present dispensable genes, although the report notes that this conclusion comes from a species-level A. baylyi pangenome. 1
Data Sources and Outputs
Pangenome cluster IDs and core/accessory status come from the kbase_ke_pangenome collection, cross-referenced through the pangenome_cluster_id column in genome_features. The generated data/growth_matrix_all.csv contains 2,350 genes with growth data on any condition. The complete 2,034-gene matrix analysed above is a subset of these genes. 1
growth_distributions.png— histograms of growth ratios per condition. 1condition_boxplots.png— box plots comparing growth-defect severity across conditions. 1condition_correlations.png— Pearson and Spearman correlation heatmaps. 1condition_correlation_preview.png— initial correlation preview from NB01. 1condition_clustermap.png— clustered correlation heatmap with dendrograms. 1condition_dendrogram.png— hierarchical clustering dendrogram of conditions. 1pca_variance.png— scree plot and cumulative variance explained. 1pca_biplot.png— PCA biplot with gene scores and condition loadings. 1silhouette_analysis.png— silhouette scores for K=2 to K=25. 1gene_heatmap.png— z-scored growth profiles of all 2,034 genes. 1module_profiles.png— mean z-score profiles per module. 1specificity_distribution.png— distribution of maximum condition-specificity scores. 1condition_specific_heatmap.png— z-score heatmap of top condition-specific genes. 1tnseq_gap_coverage.png— TnSeq essentiality class versus growth-data coverage. 1missing_gene_length.png— gene length comparison of present versus missing dispensable genes. 1
Caveats
- Growth ratios are single-timepoint measurements with unknown technical noise, so condition-specificity scores may reflect measurement error as well as biology. 1
- The complete matrix contains 2,034 genes and excludes 499 essential genes plus 316 genes with incomplete data, biasing the analysis toward dispensable genes with successful deletion mutants. 1
- Only 8 carbon sources were tested, so the approximately 5 independent dimensions may increase when additional conditions are measured. 1
- Pangenome core/accessory status comes from the KBase Data Lakehouse’s species-level pangenome for A. baylyi and may have limited resolution compared with a population-level analysis. 1
- The low clustering silhouette score and absent FDR-significant enrichments support a gradient interpretation, but the report’s proposed independent component analysis (ICA) and expanded condition panel remain future work rather than completed analyses. 1
Slots Into
- condition-specific-fitness — The 625 condition-specific genes, three-tier condition structure, and pathway-specific growth requirements quantify how fitness depends on the carbon source. 1
- gene-essentiality — The continuous sensitivity gradient, 499 excluded essential genes, and condition-dependent importance of 625 genes refine binary essentiality classifications. 1
- pangenome-integration — The comparison of missing and present dispensable genes links deletion-collection coverage to pangenome conservation, including 76.5% versus 93.3% core status. 1
- multi-omics-integration — Integration of deletion phenotypes with TnSeq classifications, functional annotations, and pangenome data demonstrates a cross-dataset approach to ADP1 gene-function analysis. 1
- condition-space-dimensionality — 5 principal components capture 82% of variance, the median pairwise r is 0.25, and the report infers approximately 5 independent dimensions from only 8 conditions, a number it says may increase with more conditions. 1
- fitness-module-detection-sensitivity — The low silhouette score (0.24) across k = 2–25, the absence of FDR-surviving module enrichments, and the single discrete 24-gene quinate module contrast with the discrete phenotypic modules reported for E. coli chemical-genetic profiles. 1
- respiratory-capacity-and-nadh-load — Complex I subunits in the 51-gene quinate-specific set and cyoC/cyoD among the lactate-specific genes suggest the hypothesis that some carbon sources place specific demands on the electron transport chain. 1
- genetic-perturbation-coverage-bias — 272 (10.5%) TnSeq-dispensable genes lack deletion growth data and are shorter, less annotated and less often core, and the complete matrix excludes 499 essential and 316 incomplete-data genes. 1
- pangenome-core-boundary-and-clade-size-bias — The core/accessory calls come from a species-level A. baylyi pangenome, which may have limited resolution compared with a population-level analysis. 1