Raw report: adp1_triple_essentiality Feeds into: capability-versus-kinetic-predictability, condition-space-dimensionality, condition-specific-fitness, cross-condition-metabolic-comparability, essentiality-assay-discordance, fitness-condition-coverage-prioritization-bias, gene-essentiality, genetic-perturbation-coverage-bias, metabolic-model-gapfilling, multi-omics-integration, pangenome-conservation-fitness-decoupling, transposon-callability-bias
Overview
This report integrates an original analysis of 478 triple-covered acinetobacter-baylyi-adp1 (Acinetobacter baylyi ADP1) genes with a refined analysis of all 5,852 genes, including TnSeq-essential genes, comparing flux-balance-analysis (FBA), tnseq/RB-TnSeq (random barcode transposon sequencing), complete-gene knockout phenotypes, mutant growth rates, and proteomics. The original study asked whether FBA distinguishes growth-defective genes among TnSeq-dispensable genes; the refined study evaluated concordance with experimental knockout lethality across rich and minimal media and tested continuous fitness and expression predictors. The original analysis took three inputs. Binary minimal-media TnSeq essentiality came from the kescience-fitnessbrowser (Fitness Browser). Essential, variable or blocked minimal-media FBA classes came from a modelseed metabolic model. Deletion-mutant growth on 8 carbon sources (glucose, acetate, asparagine, butanediol, glucarate, lactate, pyruvate, succinate) came from de Berardinis et al. (2008). The refined analysis evaluated five RB-TnSeq thresholds (0.01, 0.025, 0.05, 0.10, 0.20). 1
Key Findings
FBA and experimental essentiality
Among 478 genes with TnSeq, FBA, and mutant-growth data, all genes were TnSeq-dispensable. FBA class was not associated with growth-defect status: chi-squared = 0.93, p = 0.63, 2 df. Defect rates were 73.1% (57/78) for FBA-essential genes, 73.5% (150/204) for FBA-variable genes, and 69.4% (136/196) for FBA-blocked genes; the Kruskal-Wallis test on mean growth rates was also non-significant (H = 1.67, p = 0.43). The report shows these results in its contingency-table, defect-rate and growth-rate-distribution figures. Among FBA-essential genes, 57/78 (73%) had growth defects, which matches the 72% background rate. The other 21/78 (27%) grew normally, so FBA over-predicts for these genes. Among FBA-blocked genes with zero predicted flux, 136/196 (69%) showed growth defects, so FBA under-predicts for them. The remaining 60/196 (31%) grew normally, consistent with FBA. Because the defect rate is uniform across FBA classes, growth measurements in this selected sample do not differentially validate FBA-essential versus FBA-blocked predictions. 1
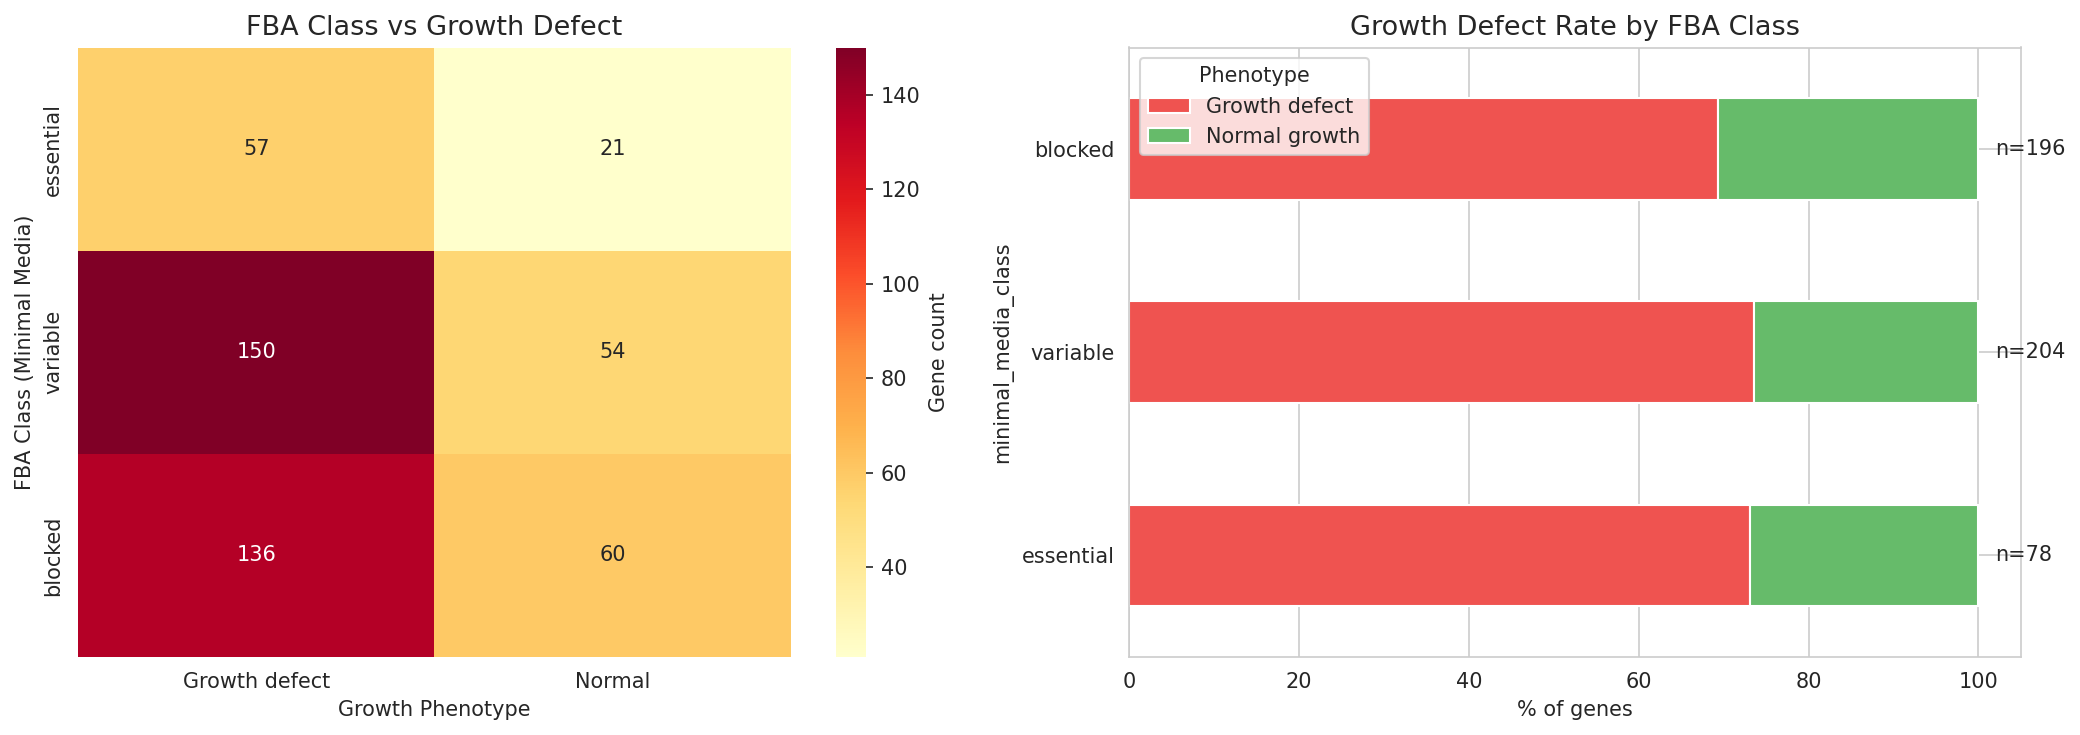 FBA class vs growth defect contingency table and defect rates. From adp1_triple_essentiality.
The null association persisted from Q10 through Q35 growth-defect thresholds. At Q10, Q15, Q20, Q25, Q30, Q35, and Q40, the chi-squared p-values were 0.985, 0.887, 0.405, 0.629, 0.313, 0.058, and 0.048, respectively. The Q25 threshold classified 72% of genes as defective, with defect rates of 73%, 74%, and 69% in the FBA-essential, FBA-variable, and FBA-blocked groups. Only at Q40 did a marginal association appear (p = 0.048). It was driven by a slight divergence between FBA-essential and FBA-blocked defect rates (90% vs 81%). The threshold-independent Kruskal-Wallis test on continuous mean growth rates confirms no association (H = 1.67, p = 0.43). The report’s threshold-sensitivity figure shows these results. Overall defect prevalence was 41%, 56%, 65%, 72%, 77%, 82%, and 85% at Q10, Q15, Q20, Q25, Q30, Q35, and Q40, respectively. The FBA-essential, FBA-variable, and FBA-blocked defect rates at the other thresholds were 1:
- Q10: 41%, 42%, and 41%
- Q15: 55%, 57%, and 55%
- Q20: 65%, 68%, and 62%
- Q30: 79%, 79%, and 73%
- Q35: 85%, 85%, and 77%
- Q40: 90%, 88%, and 81% 1
The refined analysis found moderate FBA concordance with knockout lethality. ModelSEED FBA binary predictions (essential vs non-essential) classified 866 genes in rich media and 866 genes in minimal media. In rich media, FBA versus knockout data covered 724 genes (true positives (TP) = 164, false positives (FP) = 92, false negatives (FN) = 106, true negatives (TN) = 362) and yielded recall = 60.8%, precision = 64.0%, specificity = 79.7%, F1 = 0.624, and Cohen’s kappa = 0.486. In minimal media, 833 genes (TP = 229, FP = 102, FN = 120, TN = 382) yielded recall = 65.6%, precision = 69.2%, specificity = 78.9%, F1 = 0.673, and Cohen’s kappa = 0.493. The report’s FBA concordance comparison figure summarizes these metrics. The report finds FBA performs better in minimal media (F1=0.67) than in rich media (F1=0.62). It offers tighter metabolic constraints in minimal media as a likely explanation, but does not test it. The report recommends FBA as a first-pass screen. It cites ~60-70% accuracy (κ≈0.49) and better performance in minimal than rich media, and says all predictions should be validated experimentally. 1
These results distinguish two prediction tasks. FBA shows moderate concordance with knockout lethality at the lethal-versus-dispensable boundary (κ≈0.49). However, FBA class does not predict quantitative growth defects within the TnSeq-dispensable set (p=0.63). The report cautions that the methods measure different biology. FBA captures metabolic necessity, knockout measures lethality, TnSeq measures fitness cost, proteomics indicates expression requirement, and growth measurements capture condition-specific optimization. Knockout essentiality is measured by complete gene deletion and viable colony formation, a binary outcome of whether the organism can survive without the gene. FBA is in silico flux balance analysis that asks whether flux through the gene is required for growth in defined media. The report treats knockout experiments as the best proxy for lethality, while fitness, expression, and growth rates reveal additional, complementary biology. 1
RB-TnSeq, fitness, and knockout discordance
RB-TnSeq essentiality thresholds systematically disagreed with knockout essentiality in rich media. Across thresholds of 0.01, 0.025, 0.05, 0.10, and 0.20, Cohen’s kappa was -0.139, -0.122, -0.081, -0.024, and -0.014, respectively. At the 0.05 threshold, the comparison included 1,933 genes: recall = 7.9%, precision = 5.8%, specificity = 82.8%, F1 = 0.067, and kappa = -0.081. The thresholds were based on the essentiality_fraction distribution, which had mean = 0.026 and median = 0.0. Continuous fitness values were also used and were inverted (fitness × -1) for ROC analysis. The best tabulated F1 was 0.077 at the 0.025 threshold, with recall = 15.3% and precision = 5.1%. No threshold showed positive kappa, so threshold choice does not resolve the TnSeq–knockout discordance. 1
At the 0.05 threshold, the concordance categories were both essential = 18 genes (0.9%), both dispensable = 1,411 genes (73.0%), knockout-essential/TnSeq-dispensable = 211 genes (10.9%), and knockout-dispensable/TnSeq-essential = 293 genes (15.2%). The report interprets these differences as evidence that transposon insertion measures fitness cost and may preserve partial function, whereas complete deletion measures lethality. 1
Continuous fitness performed better than binary essentiality fraction. Inverted fitness had AUC = 0.700 in rich media (1,933 genes) and AUC = 0.725 in minimal media (2,011 genes), where it was the best TnSeq-based predictor. Essentiality fraction had AUC = 0.344 (1,933 genes) and AUC = 0.403 (2,011 genes), respectively, both worse than random. AUC means Area Under the ROC Curve, a threshold-independent classification measure. In the same comparison, minimal-media proteomics (log2) had AUC = 0.743 across 2,288 genes and was the best overall continuous predictor. Fitness was multiplied by -1 because negative fitness indicates a fitness defect. Higher inverted fitness, meaning more negative original fitness, should therefore predict essentiality, and the AUC direction is read on the inverted value. The report summarizes that binary essentiality_fraction systematically disagrees with knockout experiments (κ<0) and performs worse than random (AUC<0.5); the revision history gives this as AUC=0.34-0.40. Continuous fitness, by contrast, shows fair prediction (AUC=0.70-0.73). The report connects this to the original study, which used mutant growth rates on 8 carbon sources as a continuous predictor. 1
These class profiles come from the 0.05 threshold compared against rich-media knockout calls among 1,933 genes. The 211 discordant knockout-essential/TnSeq-dispensable genes (10.9%) had mean essentiality fraction = 0.0034, standard deviation = 0.010, mean fitness = -0.79, and standard deviation = 0.93. The 293 knockout-dispensable/TnSeq-essential genes (15.2%) had mean essentiality fraction = 0.1023, standard deviation = 0.118, mean fitness = -0.34, and standard deviation = 0.66. The 1,411 genes called dispensable by both methods (73.0%) had mean essentiality fraction = 0.0116, standard deviation = 0.016, mean fitness = -0.32, and standard deviation = 0.60. The 18 genes called essential by both methods (0.9%) had mean essentiality fraction = 0.0969, standard deviation = 0.041, mean fitness = -1.18, and standard deviation = 1.49. 1
Proteomics and multi-omic evidence
Proteomics measured average log2 expression across 7 Acinetobacter strains. In minimal media, among 2,288 genes, essential genes (n = 464) had mean log2 expression = 28.43 ± 2.94, while dispensable genes (n = 1,824) had mean log2 expression = 25.73 ± 2.96; the difference was 2.70 log2 units, corresponding to 6.5-fold higher expression (shown in the report’s proteomics expression-distribution figure). The Mann-Whitney U p-value was 9.91×10⁻⁵⁹. 1
Expression correlated with knockout essentiality at Pearson r = 0.345 (p = 5.32×10⁻⁶⁵) and Spearman ρ = 0.338 (p = 3.28×10⁻⁶²), with ROC AUC = 0.743. The executive summary reports these as r=0.35 and AUC=0.74, with essential genes expressed 6.5-fold higher, and describes the proteomics AUC=0.74 as comparable to fitness. These results make proteomics a fair-to-good continuous predictor and provide an independent evidence axis alongside FBA and fitness. In minimal media, the report presents proteomics (AUC=0.74) and FBA (F1=0.67) as complementary measures: proteomics validates essentiality and FBA predicts metabolic requirement. 1
Condition-specific growth and model gaps
Across eight carbon sources, 333 of 478 genes (70%) showed condition-specific growth defects, 10 genes (2%) showed defects across all eight conditions, and 135 genes (28%) showed no defect on any condition. Mean pairwise defect correlation was 0.38, with a range of -0.03 to 1.0. This indicates moderate but not complete overlap in the gene sets required for growth on different carbon sources, as shown in the report’s defect-correlation figure. 1
Condition-specific FBA flux had weak, mixed correlations with measured growth: glucose ρ = -0.021 (p = 0.677; n = 387), acetate ρ = -0.153 (p = 0.004; n = 352), asparagine ρ = -0.257 (p < 0.001; n = 286), butanediol ρ = -0.145 (p = 0.092; n = 137), glucarate ρ = +0.246 (p = 0.005; n = 127), and lactate ρ = -0.160 (p = 0.065; n = 135). The report’s flux-versus-growth scatter plots by carbon source display these relationships. The positive glucarate correlation is opposite the expected direction and suggests condition-specific model inaccuracies. The report summarizes these flux correlations as weak (ρ = -0.26 to +0.25). It also notes that FBA essentiality class does not capture the condition-specific growth defects shown by 70% of genes (p=0.63). 1
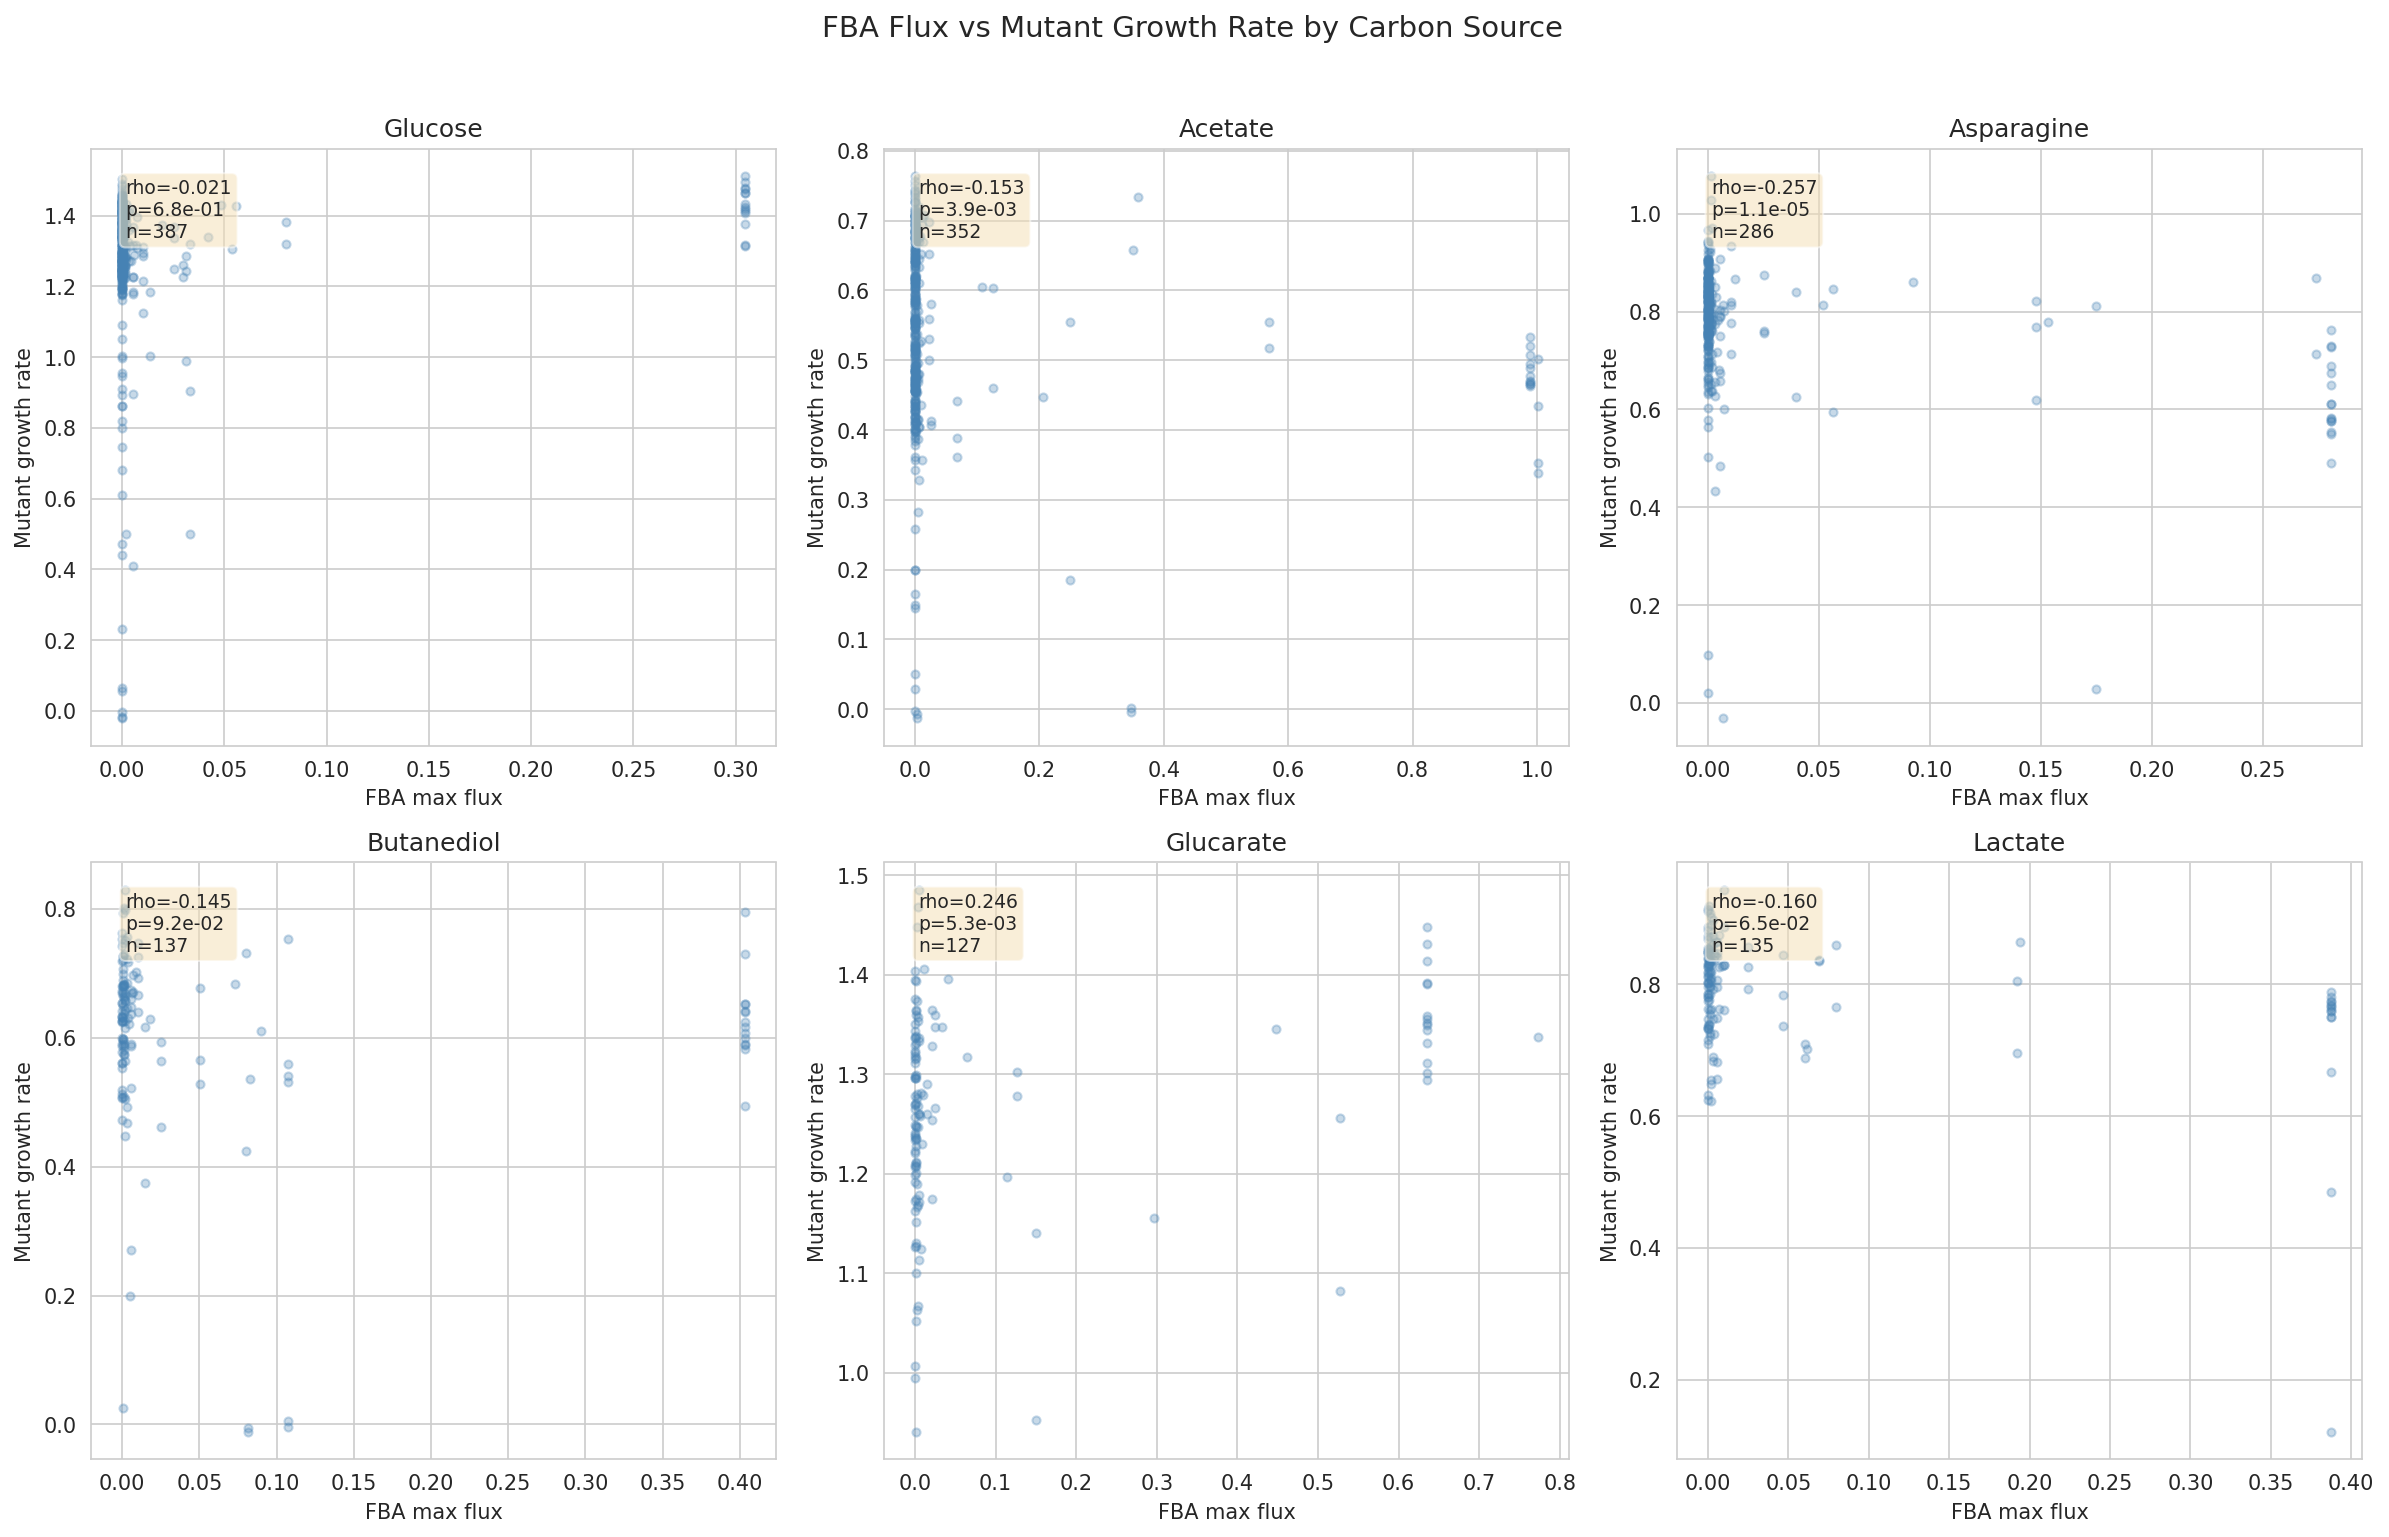 FBA flux vs mutant growth rate scatter plots by carbon source. From adp1_triple_essentiality.
RAST function annotations covered 100% of genes. Fisher’s exact tests with Benjamini-Hochberg false discovery rate correction found two functional categories significantly enriched or depleted among the 157 discordant genes, as shown in the report’s RAST enrichment and category-distribution figures. Aromatic degradation was strongly enriched among FBA-discordant genes: 9 of 11 genes were discordant, with odds ratio (OR) = 9.70 (given as OR=9.7 in the revision history) and Benjamini-Hochberg false discovery rate (FDR)-adjusted q = 0.012. Almost all of these genes are FBA-under-predicted: the model assigns them zero flux, yet their deletion impairs growth. Directional enrichment for FBA under-prediction was OR = 12.0, q = 0.004. Lipid metabolism was depleted among discordant genes, with OR = 0.34 and q = 0.042; only 7 of 46 lipid-metabolism genes were discordant, and the report describes lipid metabolism as well captured by FBA. 1
The report identifies beta-ketoadipate-pathway genes, including 4-carboxymuconolactone decarboxylase and beta-ketoadipate enol-lactone hydrolase, as examples of genes predicted as blocked by FBA but associated with experimental growth defects. It proposes that missing aromatic substrates or mismatched environmental assumptions, rather than network topology alone, may explain this model gap. The report notes that ADP1 is renowned for aromatic compound metabolism (Barbe et al. 2004). Because the FBA model assumes minimal media without aromatic compounds, it predicts zero flux (blocked) for these genes. The report offers two explanations, neither confirmed: experimental media may contain trace aromatics (from yeast extract or agar impurities), or the genes may have moonlighting functions. 1
Pangenome status did not explain discordance: genes were overwhelmingly core across discordance classes at 93–100%, and the Fisher enrichment test gave OR = 0.89 and p = 0.80 (shown in the report’s pangenome-status figure). 1
Caveats and Interpretation Limits
The original analysis is restricted by design to 478 TnSeq-dispensable genes because TnSeq-essential genes do not provide viable deletion mutants for the growth-rate analysis. Therefore, its null result concerns growth variation among dispensable genes and cannot be interpreted as a whole-genome test of FBA lethality prediction. The original analysis also had no direct lethality measurements and used TnSeq as a proxy. The report states that, among dispensable genes, growth rates vary from 10% to 100% of wild-type. 1
The Q25 threshold flags the bottom 25% of growth rates separately in each condition, so the reported “any defect” rate across eight conditions is an aggregation-dependent quantity. The report notes an expected rate of 1 − 0.75⁸ = 90% under independent conditions, compared with the observed 72% of 478 genes with a defect on at least one of the 8 conditions; the report attributes this difference to positive inter-condition correlation. 1
The refined knockout comparison merges minimal-media and rich-media calls by prioritizing minimal-media data and using rich-media data as fallback. The knockout labels come from the de Berardinis et al. (2008) complete collection of single-gene deletion mutants of Acinetobacter baylyi ADP1 (Molecular Systems Biology 4:174; adp1-single-gene-deletion-collection). The report treats this collection as biological ground truth for essentiality in both studies. It supplied mutant growth rates on 8 carbon sources for the original study and essentiality calls for rich (LB) and minimal media for the refined study. Rich-media (LB) knockout data covered 2,953 genes, including 346 essential and 2,607 dispensable genes; the merged minimal-media set covered 3,092 genes, including 499 essential genes. 1
Proteomics was not part of the original study and was added in the refined analysis. Its input was average log2 expression across 7 Acinetobacter strains for 2,383 genes, with locus tags parsed from complex-format feature IDs. It is not an ADP1-only measurement and was not measured only in the exact knockout assay condition, so its association with essentiality is independent supporting evidence rather than a condition-matched causal test. 1
The five RB-TnSeq thresholds were tested without formal multiple-testing correction. The report states that because every threshold produced negative Cohen’s kappa, correction would not change the conclusion of systematic disagreement across the tested thresholds. The report is internally inconsistent about the optimal threshold. Its connection-to-original-study passage notes that the original study analyzed only TnSeq-dispensable genes (n=478). It then says only 7.9% (18/229) of KO-essential genes are caught by TnSeq “at the optimal threshold”. However, 7.9% is the recall reported at the 0.05 threshold. The report’s threshold table instead labels 0.025 as the optimal-F1 threshold, with recall of 15.3% there. This summary records both statements and does not resolve the discrepancy. 1
The proposed explanations for TnSeq/knockout discordance—including partial or truncated protein production, read-through transcription, retained functional domains, and condition aggregation—are mechanistic hypotheses rather than directly resolved demonstrations in this report. The report proposes that the 211 KO-essential/TnSeq-dispensable genes (mean essentiality_fraction = 0.0034) likely tolerate partial function from transposon-disrupted genes. It proposes that the 293 TnSeq-essential/KO-dispensable genes (mean essentiality_fraction = 0.10) may be fitness-important but not lethal, because transposon insertion is not equivalent to gene deletion. On condition aggregation, the Fitness Browser TnSeq data span diverse conditions across many studies, and essentiality_fraction mixes those conditions. The report states that condition-matched comparisons are more informative. Similarly, the proposed explanation that trace aromatics in experimental media account for aromatic-pathway discordance requires testing with measured media composition and revised FBA constraints. 1
The report recommends condition-matched TnSeq and knockout experiments (running TnSeq in identical media to separate condition effects from method effects), domain- and insertion-position analysis of the 211 knockout-essential/TnSeq-dispensable genes, addition of trace aromatic compounds to the minimal-media FBA definition, which would test whether aromatic-degradation gene discordance resolves and match in silico environmental assumptions to experimental reality. It also recommends using continuous flux values instead of the binary essentiality class, through linear or rank regression between flux and growth rate, which may capture quantitative growth effects. Further recommendations are condition-specific flux simulations, and combined FBA-plus-fitness-plus-proteomics prediction. For dispensable genes, the report advises growth assays on specific carbon sources, because FBA class shows no association with growth-defect rate (p=0.63). 1
Data Products and Figures
The original integrated table of TnSeq, FBA, growth, and annotation data (data/triple_gene_table.csv) contains 478 genes. The refined essentiality-vectors table (data/essentiality_vectors.csv) contains 5,852 genes × 19 columns. A shared 136 MB SQLite database, not stored in git, holds a genome_features table of 5,852 genes and 51 columns and a gene_phenotypes table of 239,584 rows. 1
The report’s figures are as follows 1:
figures/data_assembly_overview.png— FBA class distribution and growth defect by conditionfigures/growth_rate_distributions.png— per-condition growth-rate histograms with Q25 thresholdsfigures/fba_growth_concordance.png— FBA class versus growth-defect heatmapfigures/growth_by_fba_class.png— violin and box plots of growth rate by FBA classfigures/threshold_sensitivity.png— defect rate across Q10–Q40 thresholdsfigures/flux_vs_growth_scatter.png— per-condition FBA flux versus growth ratefigures/defect_condition_correlation.png— inter-condition growth-defect correlation heatmapfigures/rast_enrichment_discordant.png— RAST functional-category enrichmentfigures/rast_by_discordance_class.png— RAST distribution across concordance classesfigures/pangenome_discordance.png— core-gene fraction by concordance classfigures/concordance_comprehensive.png— 4-panel FBA and TnSeq concordancefigures/discordance_analysis.png— 6-panel TnSeq–knockout discordance breakdownfigures/fba_comparison.png— FBA rich versus minimal media comparisonfigures/proteomics_expression_distribution.png— expression by essentiality statusfigures/roc_comprehensive.png— ROC curves for all continuous predictors 1
Provenance and Attribution
The work builds on several external inputs. The de Berardinis et al. (2008) knockout collection supplied essentiality calls and mutant growth phenotypes. Durot et al. (2008), “Iterative reconstruction of a global metabolic model of Acinetobacter baylyi ADP1 using high-throughput growth phenotype and gene essentiality data” (BMC Systems Biology 2:85), supplied the FBA metabolic model predictions for both studies. That original report gave ~75% FBA-TnSeq concordance; this figure is cited, not re-derived here. The kescience-fitnessbrowser (fit.genomics.lbl.gov) supplied RB-TnSeq data aggregated across multiple studies. It provided binary TnSeq essentiality for the original study and essentiality fraction and fitness values for the refined study. The KBase Data Lakehouse supplied three kinds of data: proteomics expression across 7 Acinetobacter strains for the refined study, genome features and annotations for both studies, and pangenome cluster assignments for the original study. Three further works are cited. Barbe et al. (2004; Nucleic Acids Research 32(19):5766-5779) is cited for genome annotation and aromatic degradation pathways. Price et al. (2018; Nature 557:503-509) is cited for Fitness Browser and RB-TnSeq methodology. Suárez et al. (2020; Nucleic Acids Research 48(8):4585-4600) is cited for combining FBA and TnSeq in ADP1 genome engineering. 1
Paramvir Dehal (ORCID 0000-0001-5810-2497; Lawrence Berkeley National Laboratory, US Department of Energy) is credited with the original triple essentiality study, dated 2026-02-18. Christopher Henry (ORCID 0000-0001-8058-9123; Lawrence Berkeley National Laboratory, US Department of Energy) is credited with the refined comprehensive analysis and integration, dated 2026-02-19. 1
Slots Into
- gene-essentiality — FBA, knockout, RB-TnSeq, fitness, and proteomics measure distinct aspects of essentiality, with exact concordance and AUC results.
- condition-specific-fitness — Mutant growth defects vary across carbon sources, and continuous fitness outperforms binary essentiality fraction.
- metabolic-model-gapfilling — Aromatic degradation is enriched among FBA-discordant genes, identifying environmental assumptions as a model gap.
- multi-omics-integration — Proteomics, FBA, knockout, TnSeq, and growth measurements provide complementary essentiality evidence.
- pangenome-integration — Pangenome core status was tested as a source of discordance and showed no significant enrichment.
- essentiality-assay-discordance — RB-TnSeq and knockout essentiality disagree at every tested threshold, and the report’s “optimal threshold” statement is internally inconsistent.
- genetic-perturbation-coverage-bias — The triple-covered sample excludes TnSeq-essential genes by design, which limits the FBA–growth comparison.
- transposon-callability-bias — Threshold choice on essentiality_fraction does not resolve TnSeq–knockout discordance; residual function after insertion is proposed but not demonstrated.
- capability-versus-kinetic-predictability — FBA flux correlates only weakly with measured mutant growth rates, with mixed signs.
- cross-condition-metabolic-comparability — The opposite-sign glucarate correlation points to condition-specific model inaccuracy.
- pangenome-conservation-fitness-decoupling — Core genome status does not distinguish FBA-discordant genes.
- fitness-condition-coverage-prioritization-bias — The aggregated essentiality_fraction mixes diverse Fitness Browser conditions, and the report argues that condition-matched comparisons are more informative.