Key Findings
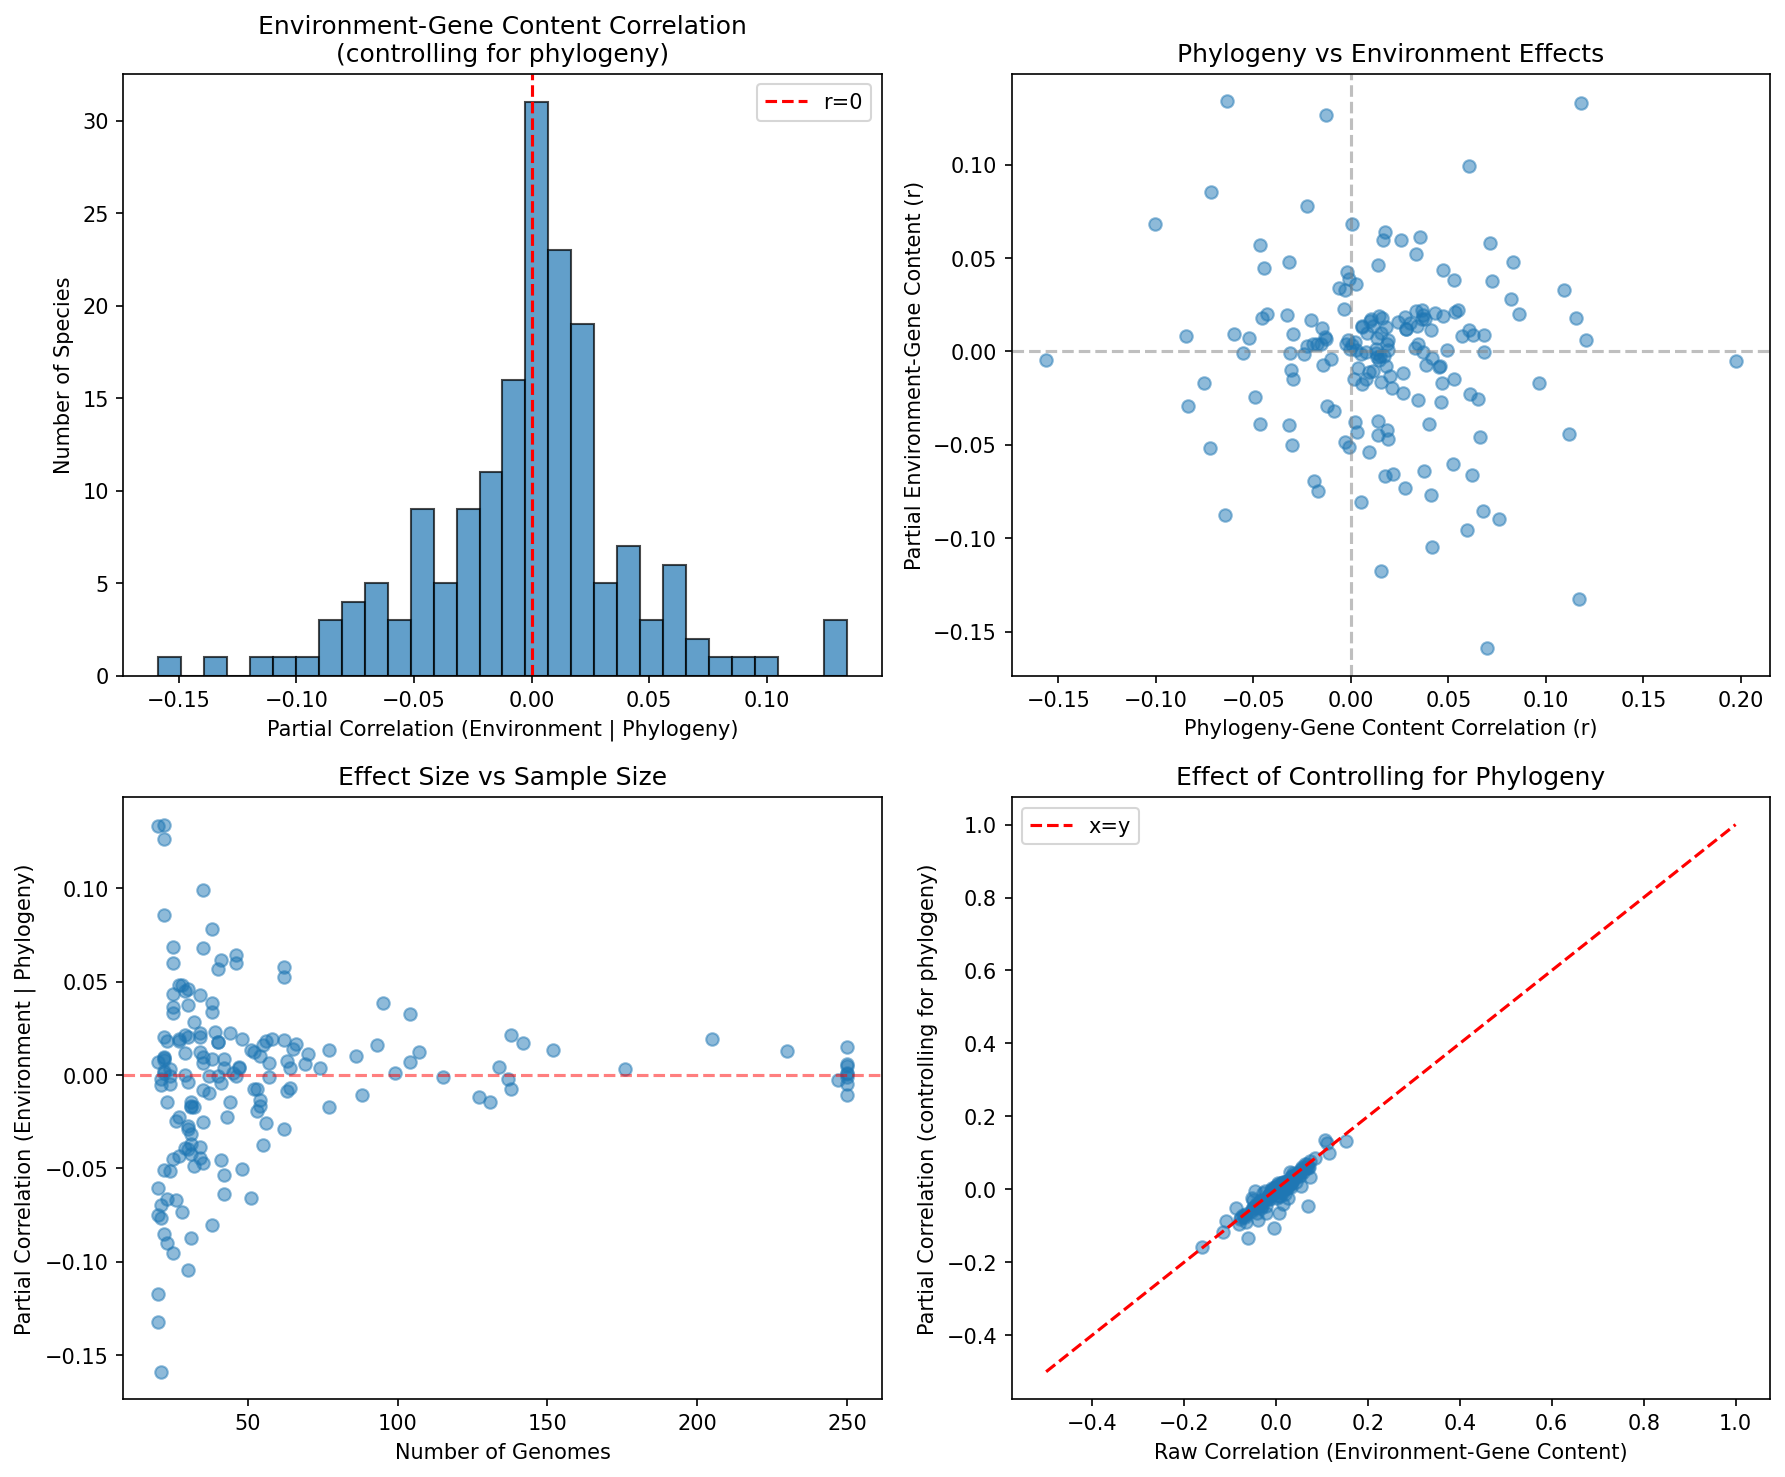
Analysis of 172 species with sufficient environmental and phylogenetic data reveals:
Phylogeny Usually Dominates
- Median partial correlation for environment: 0.0025
- Median partial correlation for phylogeny: 0.0143
- Phylogeny dominates in 60.5% of species
- Environment dominates in 39.5% of species
Provenance:
notebooks/02_ecotype_correlation_analysis.ipynb
No Difference by Lifestyle
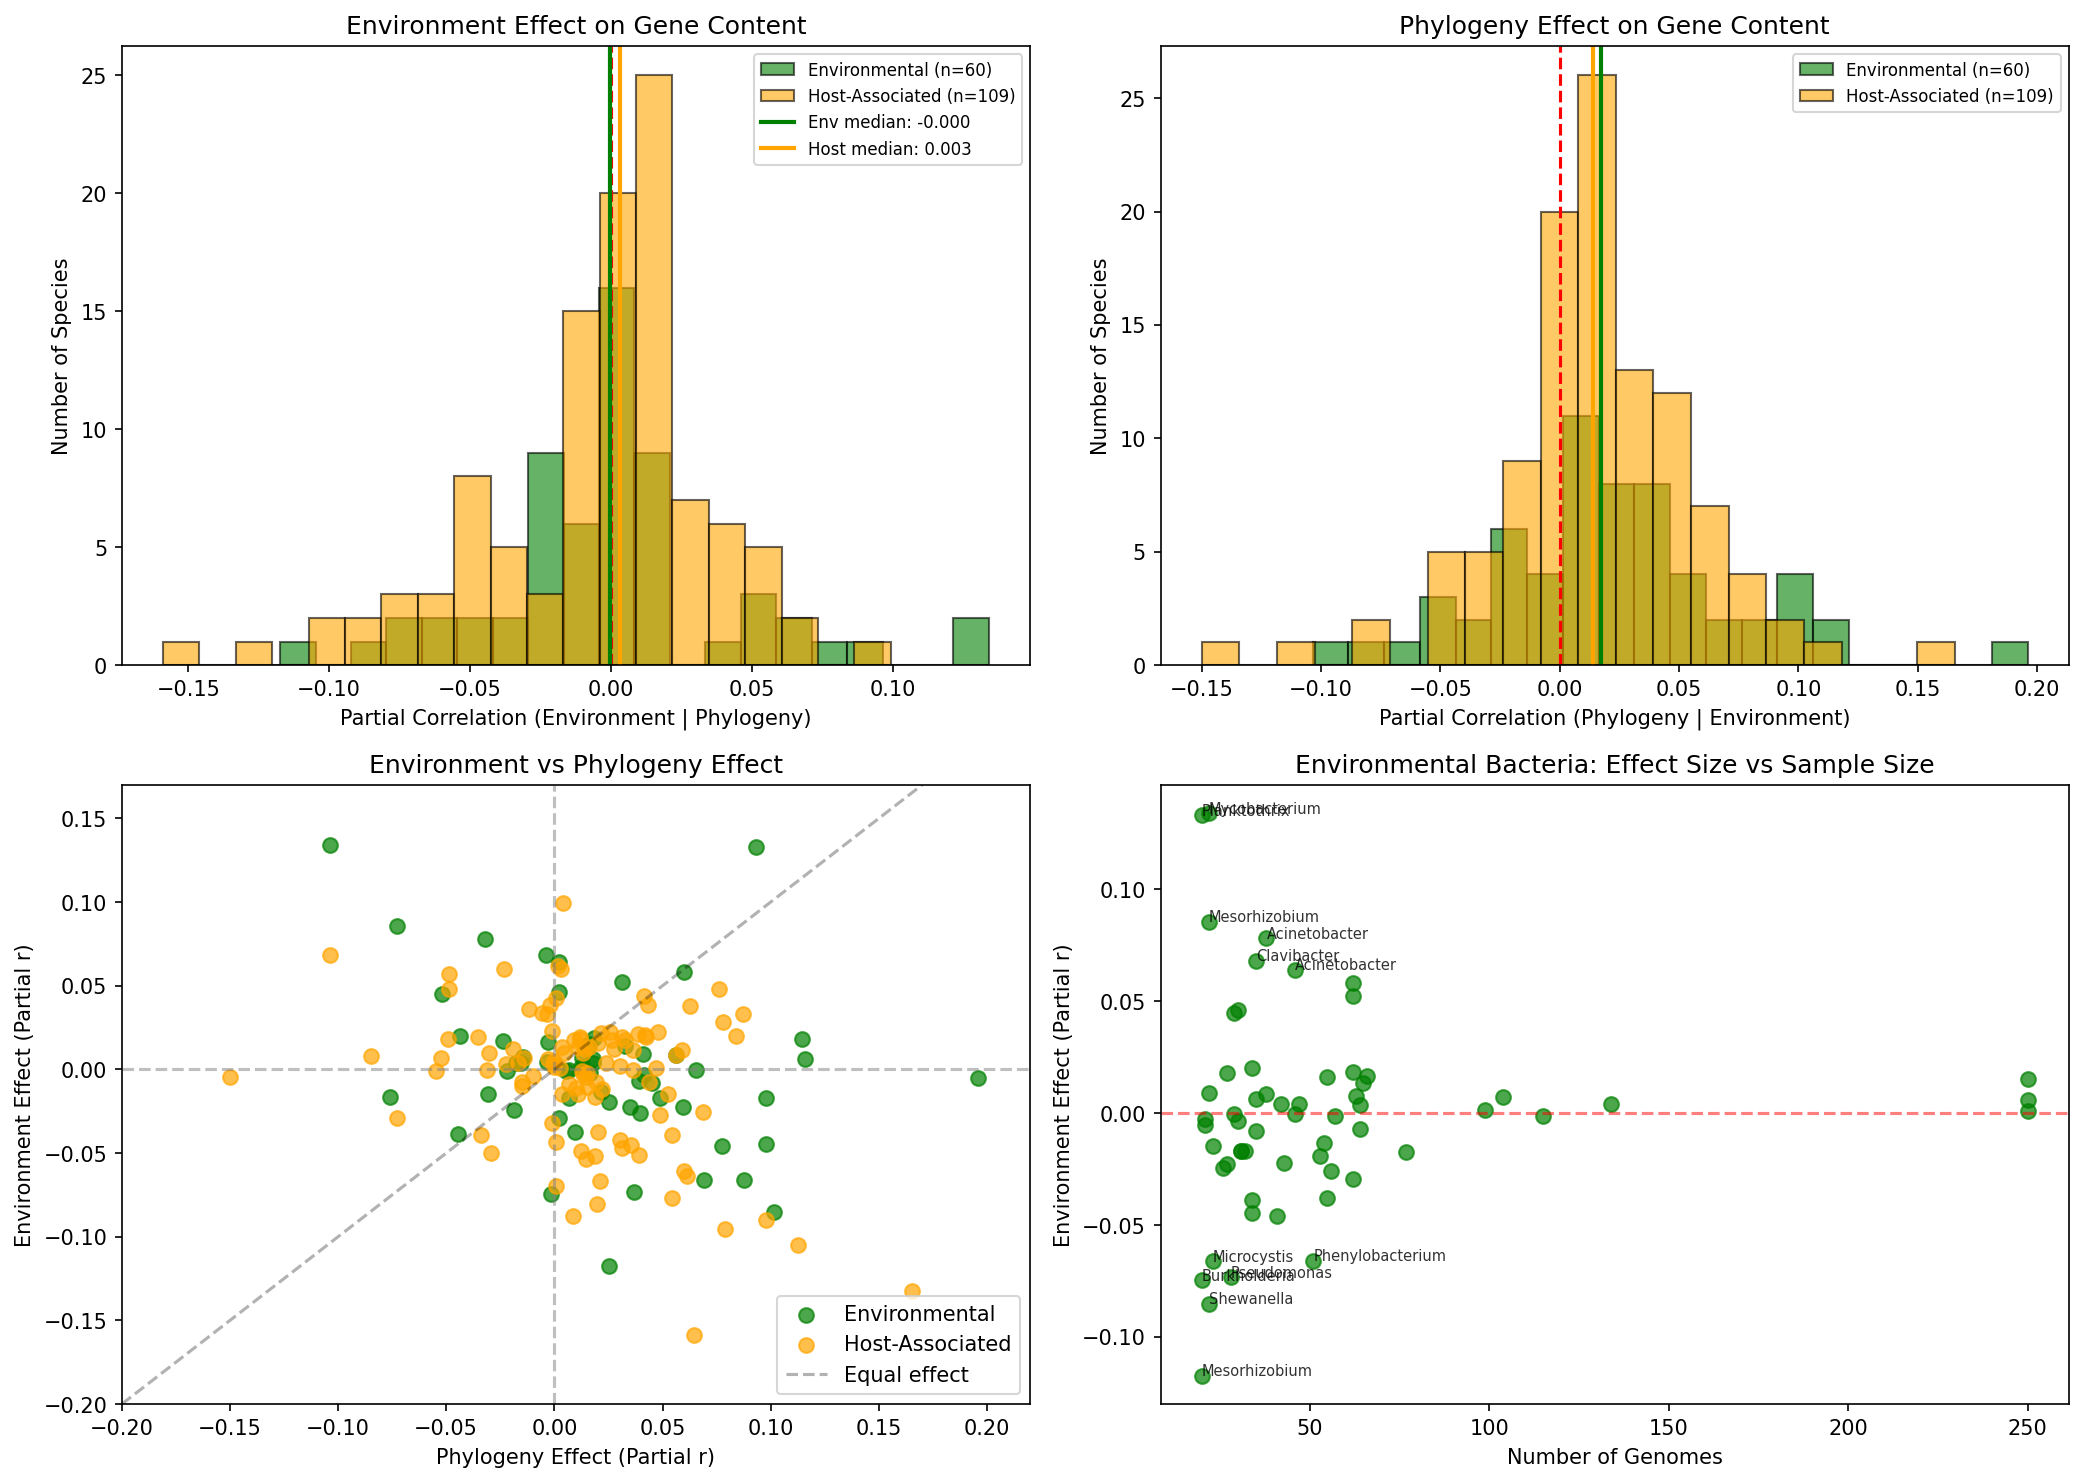
Tested whether “environmental” bacteria (free-living, where lat/lon is meaningful) show stronger environment effects than host-associated bacteria. No significant difference found (p=0.66).
Provenance:
notebooks/02_ecotype_correlation_analysis.ipynb
Statistical Summary
- Significant positive environment effect (p<0.05): 12 species (7.0%)
- Significant negative environment effect: 4 species (2.3%)
- Not significant: 156 species (90.7%)
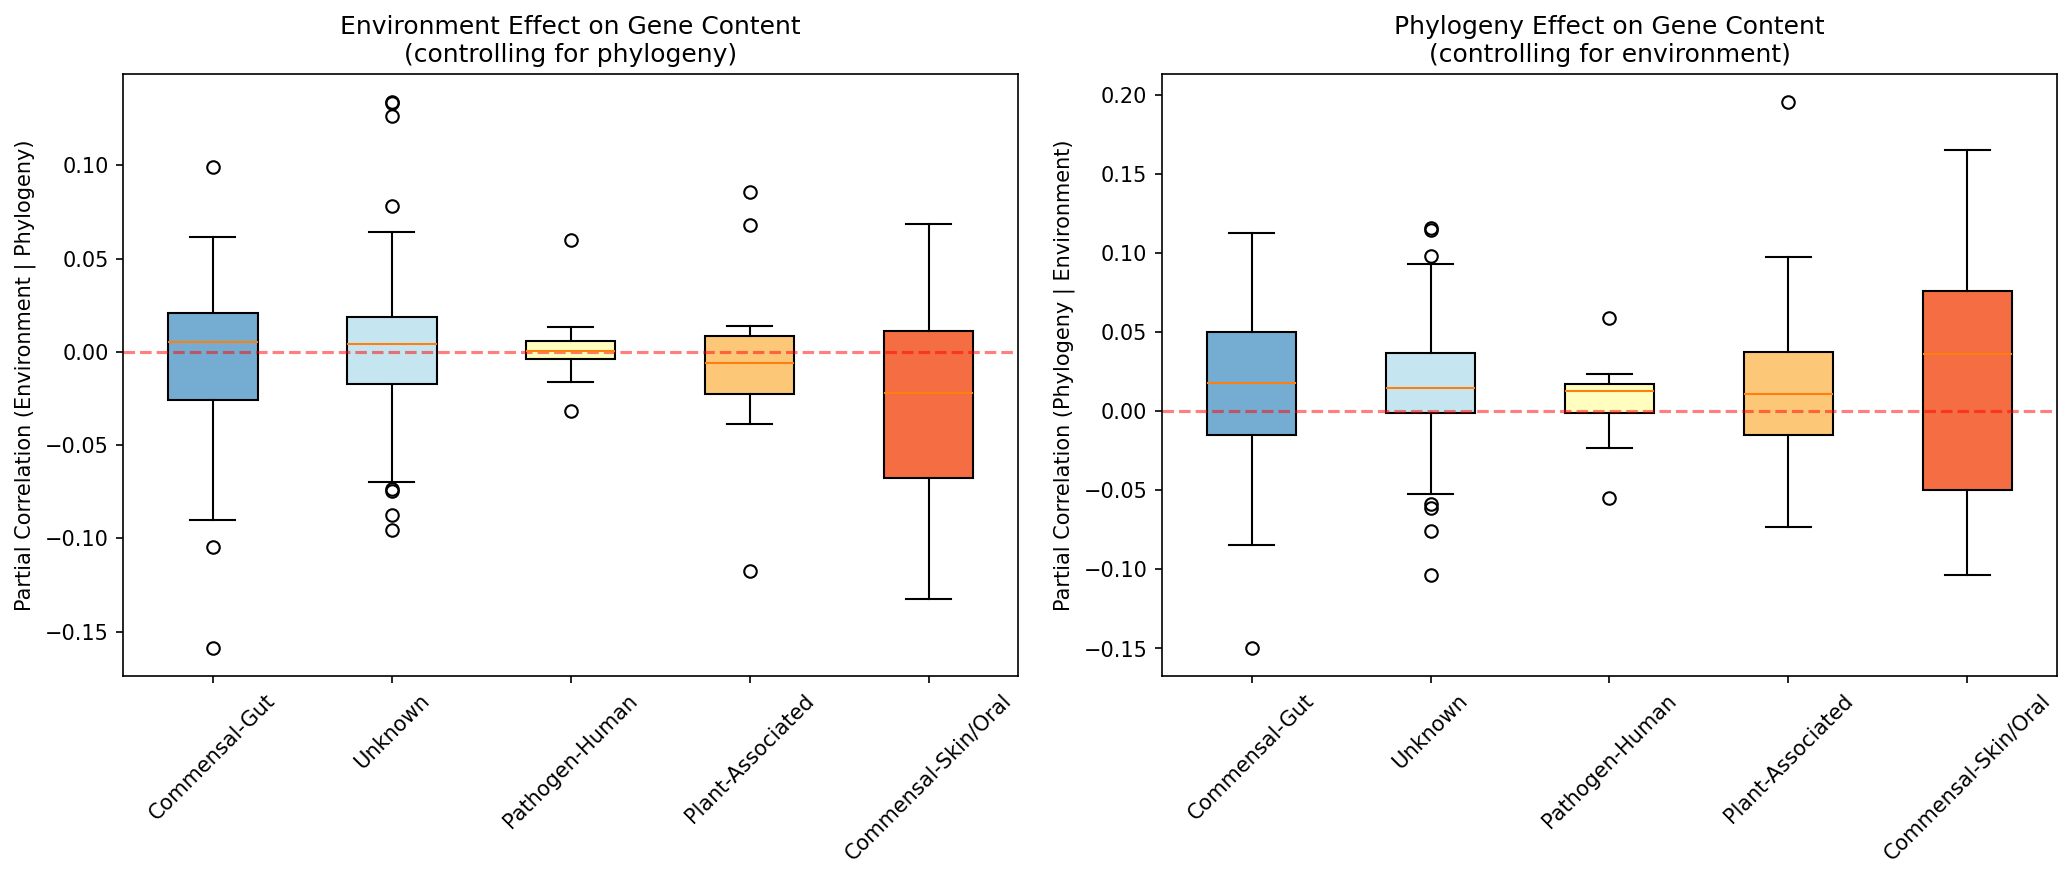
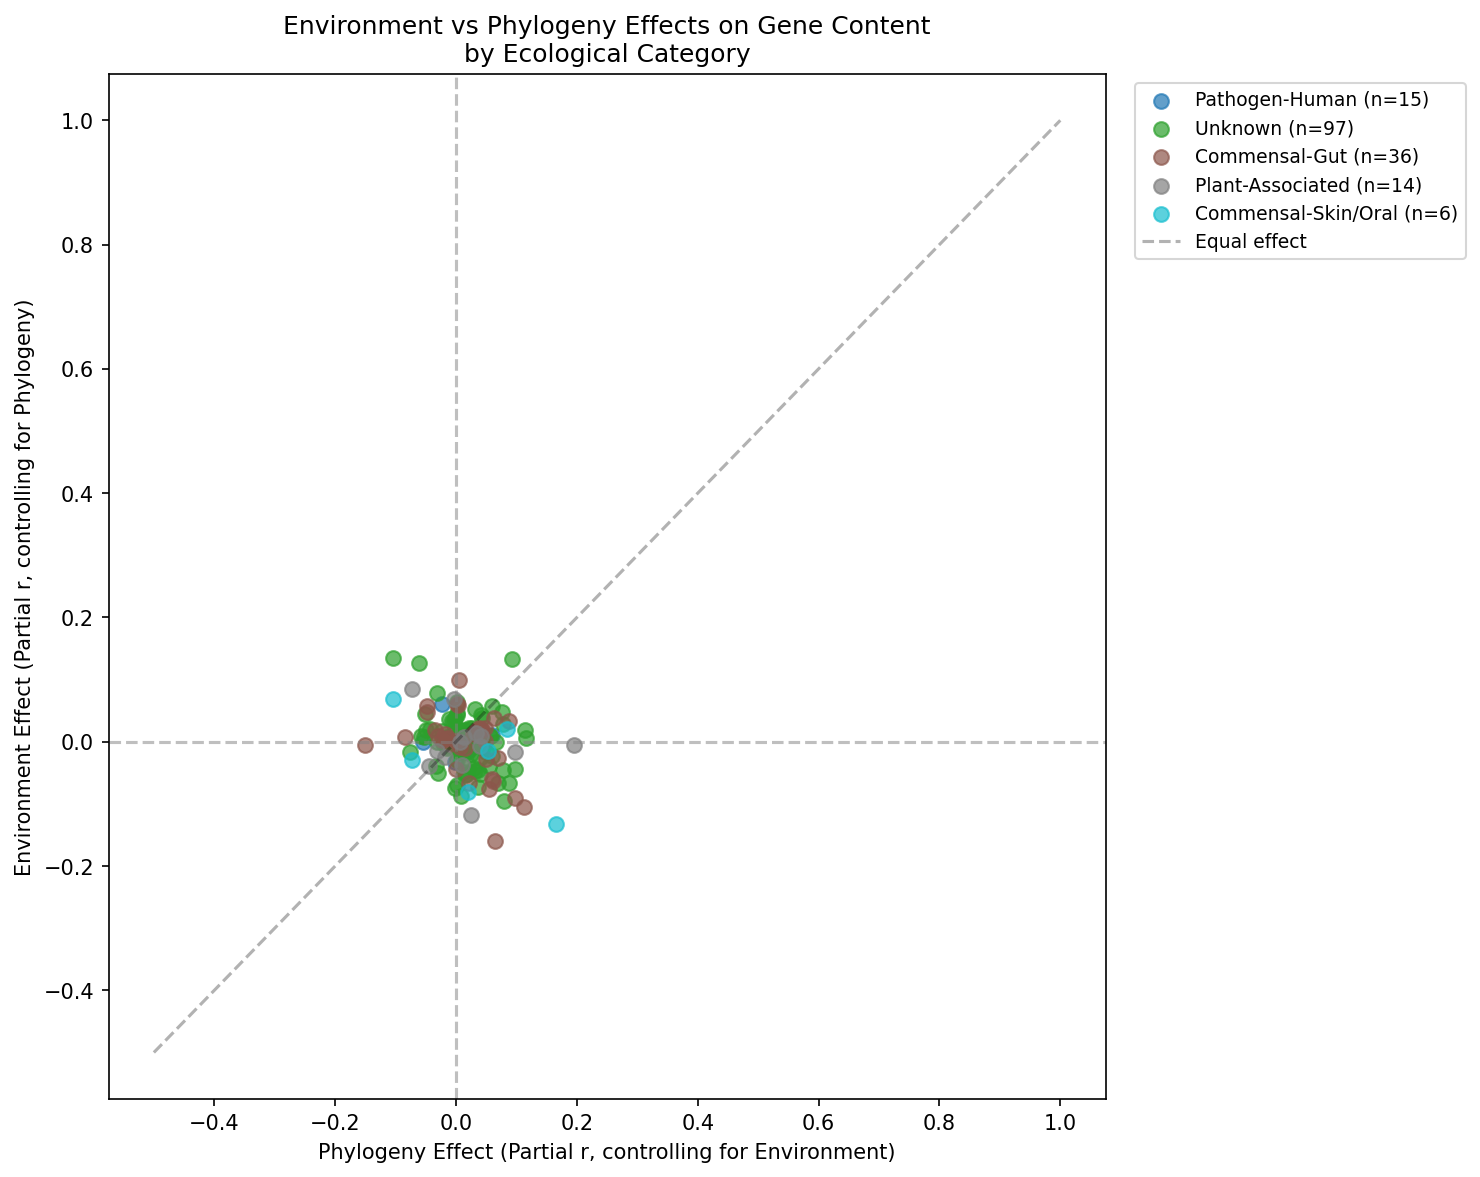
Category Breakdown
Provenance:
notebooks/02_ecotype_correlation_analysis.ipynb
Embedding Diversity
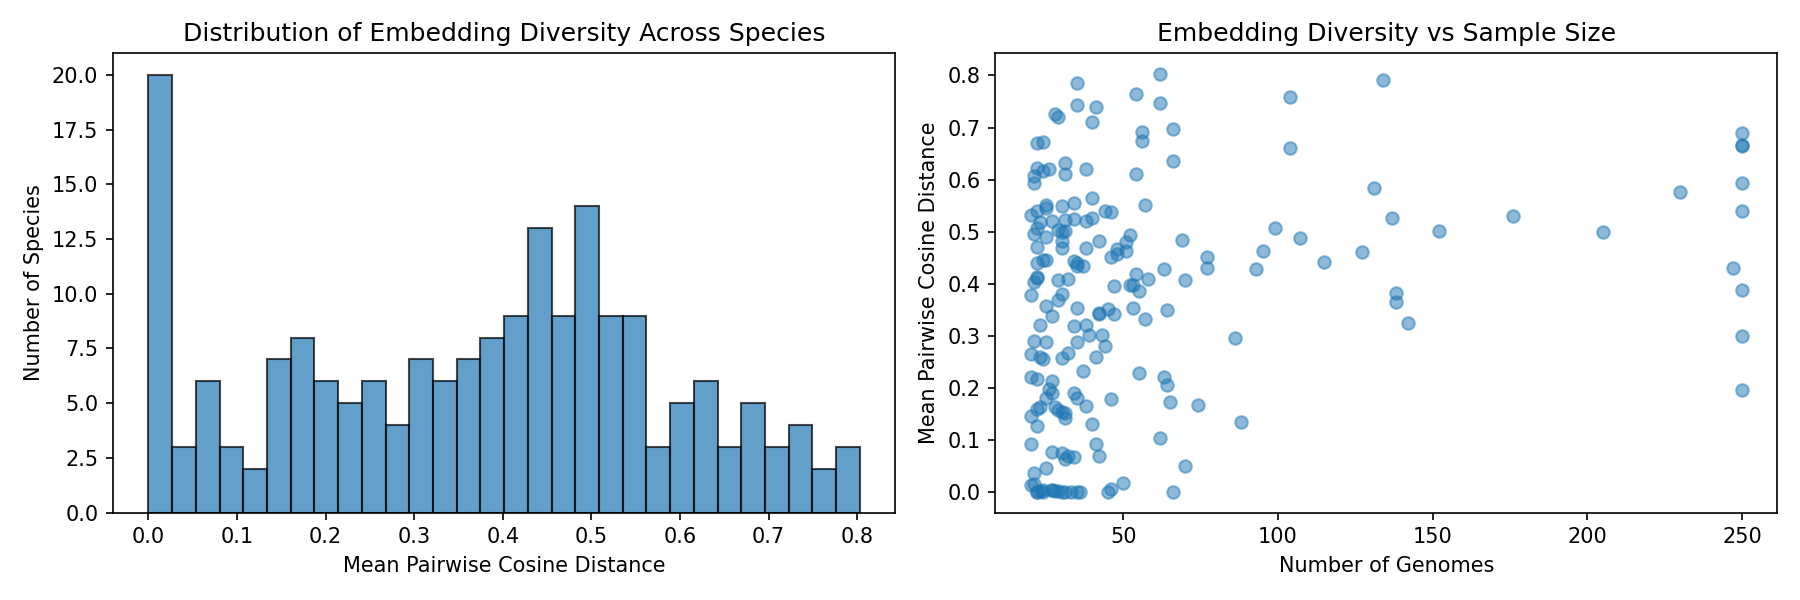
Provenance:
notebooks/01_data_extraction.ipynb
Interpretation
For most bacterial species, phylogenetic history is a stronger predictor of gene content than environmental similarity. This suggests that:
- Vertical inheritance dominates the gene content signal
- Environmental adaptation may act on specific gene subsets rather than the whole genome
- The AlphaEarth embeddings may not fully capture ecologically relevant environmental variation
Literature Context
- The finding that phylogeny dominates gene content similarity is consistent with work by Garud et al. (2019) and Shapiro et al. (2012) on within-species population structure, which show that clonal ancestry shapes genome-wide variation more than ecological niche.
- The weak environmental effects on gene content relate to findings by Polz et al. (2013), who argue that horizontal gene transfer shapes population structure at specific loci rather than genome-wide, consistent with our observation that environment may act on gene subsets rather than the whole genome.
Limitations
- AlphaEarth embeddings have only 28.4% genome coverage, limiting the environmental signal available for analysis.
- Geographic coordinates from NCBI metadata are often missing or imprecise, reducing the quality of environmental associations.
- Partial correlations assume linear relationships between distance matrices, which may not capture nonlinear ecological effects.
- Host-associated organisms have less meaningful lat/lon data, as the reported coordinates reflect collection site rather than the organism’s actual microenvironment.
Data
Sources
Data was queried from the kbase_ke_pangenome database using the following tables:
| Table | Usage |
|---|---|
alphaearth_embeddings | Environmental embeddings for geographic coordinates |
genome | Genome metadata and taxonomy |
ncbi_env | NCBI environmental and isolation source metadata |
pangenome | Pangenome composition per species |
gene_cluster | Gene cluster presence/absence profiles |
Generated Data
| File | Description |
|---|---|
target_genomes_expanded.csv | 13,381 genomes across 224 species with metadata |
species_selection_stats.csv | Per-species statistics for species selection |
species_embedding_diversity.csv | Environmental diversity metrics per species |
species_embedding_coverage.csv | Embedding coverage statistics per species |
embeddings_expanded.csv | Expanded embedding vectors for target genomes |
ecotype_correlation_results.csv | Correlation results for all 172 species |
ecotype_correlation_results_with_categories.csv | Correlation results with ecological categories |
ecotype_correlation_environmental_only.csv | Correlation results for environmental species only |
ecotype_correlation_refined_categories.csv | Correlation results with refined category assignments |
ecotype_correlation_with_pangenome.csv | Correlation results incorporating pangenome metrics |
species_ecological_categories.csv | Ecological categorization of species |
embedding_diversity_distribution.png | Distribution plot (copy in data directory) |
ani_expanded/ | Per-species ANI distance matrices |
gene_clusters_expanded/ | Per-species gene cluster profiles |
Future Directions
- Subset by gene function: Test whether specific COG categories (e.g., V-Defense, L-Mobile) show stronger environment effects
- Alternative distance metrics: Try different embedding distances or environmental metadata directly
- Within-ecotype comparison: For species with identified ecotypes, compare gene content between ecotype clusters
Supporting Evidence
Notebooks
| Notebook | Purpose |
|---|---|
01_data_extraction.ipynb | Extract embeddings, ANI, and gene clusters for 224 target species |
02_ecotype_correlation_analysis.ipynb | Compute correlations and generate visualizations |
Figures
| Figure | Description |
|---|---|
ecotype_correlation_summary.png | 4-panel summary: correlation distributions, env vs phylo effects, sample size effect, raw vs partial |
ecotype_by_category.png | Box plots comparing environment and phylogeny effects by ecological category |
ecotype_scatter_by_category.png | Scatter plot of environment vs phylogeny effects, colored by category |
embedding_diversity_distribution.png | Distribution of environmental embedding diversity across species |
environmental_vs_host_comparison.png | Comparison of effects between environmental and host-associated bacteria |
Data Files
| File | Description |
|---|---|
target_genomes_expanded.csv | 13,381 genomes across 224 species with metadata |
species_selection_stats.csv | Per-species statistics for species selection |
species_embedding_diversity.csv | Environmental diversity metrics per species |
ecotype_correlation_results.csv | Correlation results for all 172 species |
species_ecological_categories.csv | Ecological categorization of species |
References
- Garud NR et al. (2019). “Population genetics in the human microbiome.” Trends Genet 35:626-636.
- Shapiro BJ et al. (2012). “Population genomics of early events in the ecological differentiation of bacteria.” Science 336:48-51.
- Polz MF et al. (2013). “Horizontal gene transfer and the evolution of bacterial and archaeal population structure.” Trends Genet 29:170-175. PMID: 23332119
- Parks DH et al. (2022). “GTDB: an ongoing census of bacterial and archaeal diversity through a phylogenetically consistent, rank normalized and complete genome-based taxonomy.” Nucleic Acids Res 50:D199-D207. PMID: 34520557
Revision History
- v2 (2026-02): Added figures inline, interpretation section with literature context and limitations, data section, references
- v1 (2026-02): Migrated from README.md