This page records a disagreement between two projects about where adaptive functions sit in bacterial genomes. A cross-species analysis of COG (Clusters of Orthologous Groups, a standard scheme that assigns genes to broad functional categories) places adaptive-leaning categories in the novel or singleton gene class. 1 A plant-microbiome analysis finds that a curated adaptive marker class sits mostly in the core genome, the genes shared across a species’ genomes. 2 The answer matters for adaptive-versus-housekeeping-functional-differentiation. If adaptive functions are not reliably accessory, then larger adaptive shifts between gene-content ecotypes (groups of genomes within a species clustered by accessory gene-content differences) cannot be read simply as accessory-genome turnover.
Evidence Sides
Side A: adaptive categories are accessory-leaning. The broader cross-species comparison places adaptive-leaning categories in the novel or singleton gene class. Mobile elements (COG category L) show +10.88% enrichment with 100% consistency, and defense (COG category V) shows +2.83% enrichment with 100% consistency. 1 The same comparison lists housekeeping-leaning categories with the core-gene class: J (translation), F (nucleotide metabolism), H (coenzyme metabolism), E (amino acid metabolism) and C (energy production). 1 The unit of comparison is gene classes, and functions are defined by COG category membership. 1,2
Side B: an adaptive marker class sits inside the core. Beneficial plant-growth-promoting (PGP) gene clusters had a 64.6% core fraction. Pathogenic clusters had 45.2%, and the genome-wide baseline was 46.8%. This places an adaptive marker class inside the core. 2 The unit here is marker clusters, and functions are defined by curated beneficial or pathogenic markers rather than COG categories. 1,2
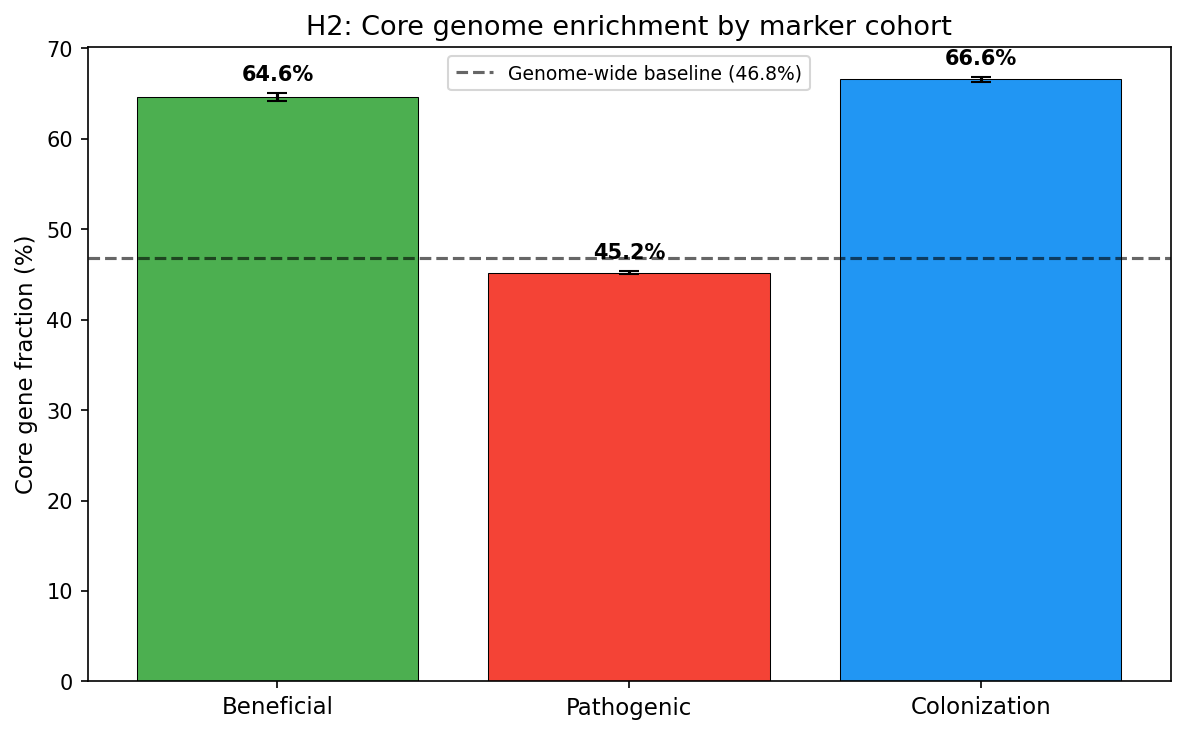 Core vs accessory distribution by functional cohort. From plant_microbiome_ecotypes.
The two sides differ in both their function definitions and their units. The disagreement is therefore partly about what counts as an adaptive function. It must not be settled by averaging the core fractions. 1,2
Possible Reconciliations
- Hypothesis 1: definitional mismatch. “Adaptive” may cover two different gene sets: COG category membership and curated beneficial/pathogenic markers may select different genes, so the two results may not truly conflict. 1,2
- Hypothesis 2: unit and aggregation effects. Measuring enrichment across gene classes and measuring core fractions across marker clusters may weight species and gene families differently, which alone could produce opposite-looking placements. 1,2
- Hypothesis 3: a split within the adaptive group. Adaptive functions may divide into an accessory-leaning part and a core-leaning part; if so, “adaptive means accessory” would hold only for some categories. 1,2
Resolving Work
- Common scoring. Take one shared genome set and score every gene under both the COG category scheme and the curated beneficial/pathogenic marker scheme. Then compare core fractions category by category to see whether the opposite placements persist once the genomes are held constant. 1,2
- Ecotype effect sizes. Using the ecotype COG profiles together with each category’s core or accessory leaning, test whether the categories with larger ecotype effect sizes (the magnitude of functional differences between ecotypes) are the accessory-leaning ones. 1,2
- Cross-mapping. Map the curated plant-growth-promoting and pathogenic markers onto COG categories, and ask whether the core-leaning beneficial markers fall in categories the cross-species comparison treats as housekeeping-leaning or adaptive-leaning. 1,2
- Unit harmonization. Recompute both analyses at the same unit, either gene classes or marker clusters, against a shared baseline, and ask whether the opposite placements reflect biology or aggregation. 1,2