Raw report: pseudomonas_carbon_ecology Feeds into: computational-pathway-prediction-validation, cultivation-collection-bias-in-ecological-genomics, ecotype-clustering-validity, ecotype-environment-gene-content, environment-embedding-geography, lab-field-fitness-concordance, metabolic-capacity-specialization, metabolic-model-gapfilling, occurrence-versus-catabolic-activity, ontology-and-category-schema-sensitivity, pangenome-integration, pangenome-openness-determinants, pathway-versus-reaction-evidence-resolution, phylogenetic-confounding-of-pangenome-associations, sample-size-aware-phenotype-consensus, sampling-depth-and-downsampling-effects, taxonomic-resolution-dependent-functional-inference, two-speed-bacterial-genome, within-species-conservation-between-species-functional-divergence
Overview
This report analyzes standardized GapMind carbon-pathway predictions from the KBase Data Lakehouse kbase_ke_pangenome collection across 12,732 genomes and 433 Pseudomonas species clades (GTDB r214), testing whether carbon utilization profiles distinguish host-associated, free-living, and plant-associated lifestyles and environments. It finds strong pathway loss in the Pseudomonas s.s. (P. aeruginosa group) relative to Pseudomonas_E (P. fluorescens/putida group), while carbon profiles retain a statistically significant but modest ecological signal among free-living species. 1
Key Findings
Host-associated sugar-pathway loss
Among 7 Pseudomonas s.s. species and 189 Pseudomonas_E species with at least 5 genomes, 43 of 62 pathways differed significantly by Mann-Whitney U testing with Benjamini-Hochberg false-discovery-rate correction (q < 0.05). The largest differences involved plant-derived sugars and sugar alcohols: xylose completeness was 0.0% versus 74.4% (+74.4 percentage points), ribose 27.9% versus 92.0% (+64.2 percentage points), arabinose 0.0% versus 62.6% (+62.6 percentage points), galacturonate 28.6% versus 88.4% (+59.8 percentage points), myo-inositol 0.0% versus 58.8% (+58.8 percentage points), mannitol 25.9% versus 77.5% (+51.6 percentage points), and sorbitol 25.9% versus 77.4% (+51.5 percentage points), respectively comparing the P. aeruginosa and P. fluorescens groups. 1
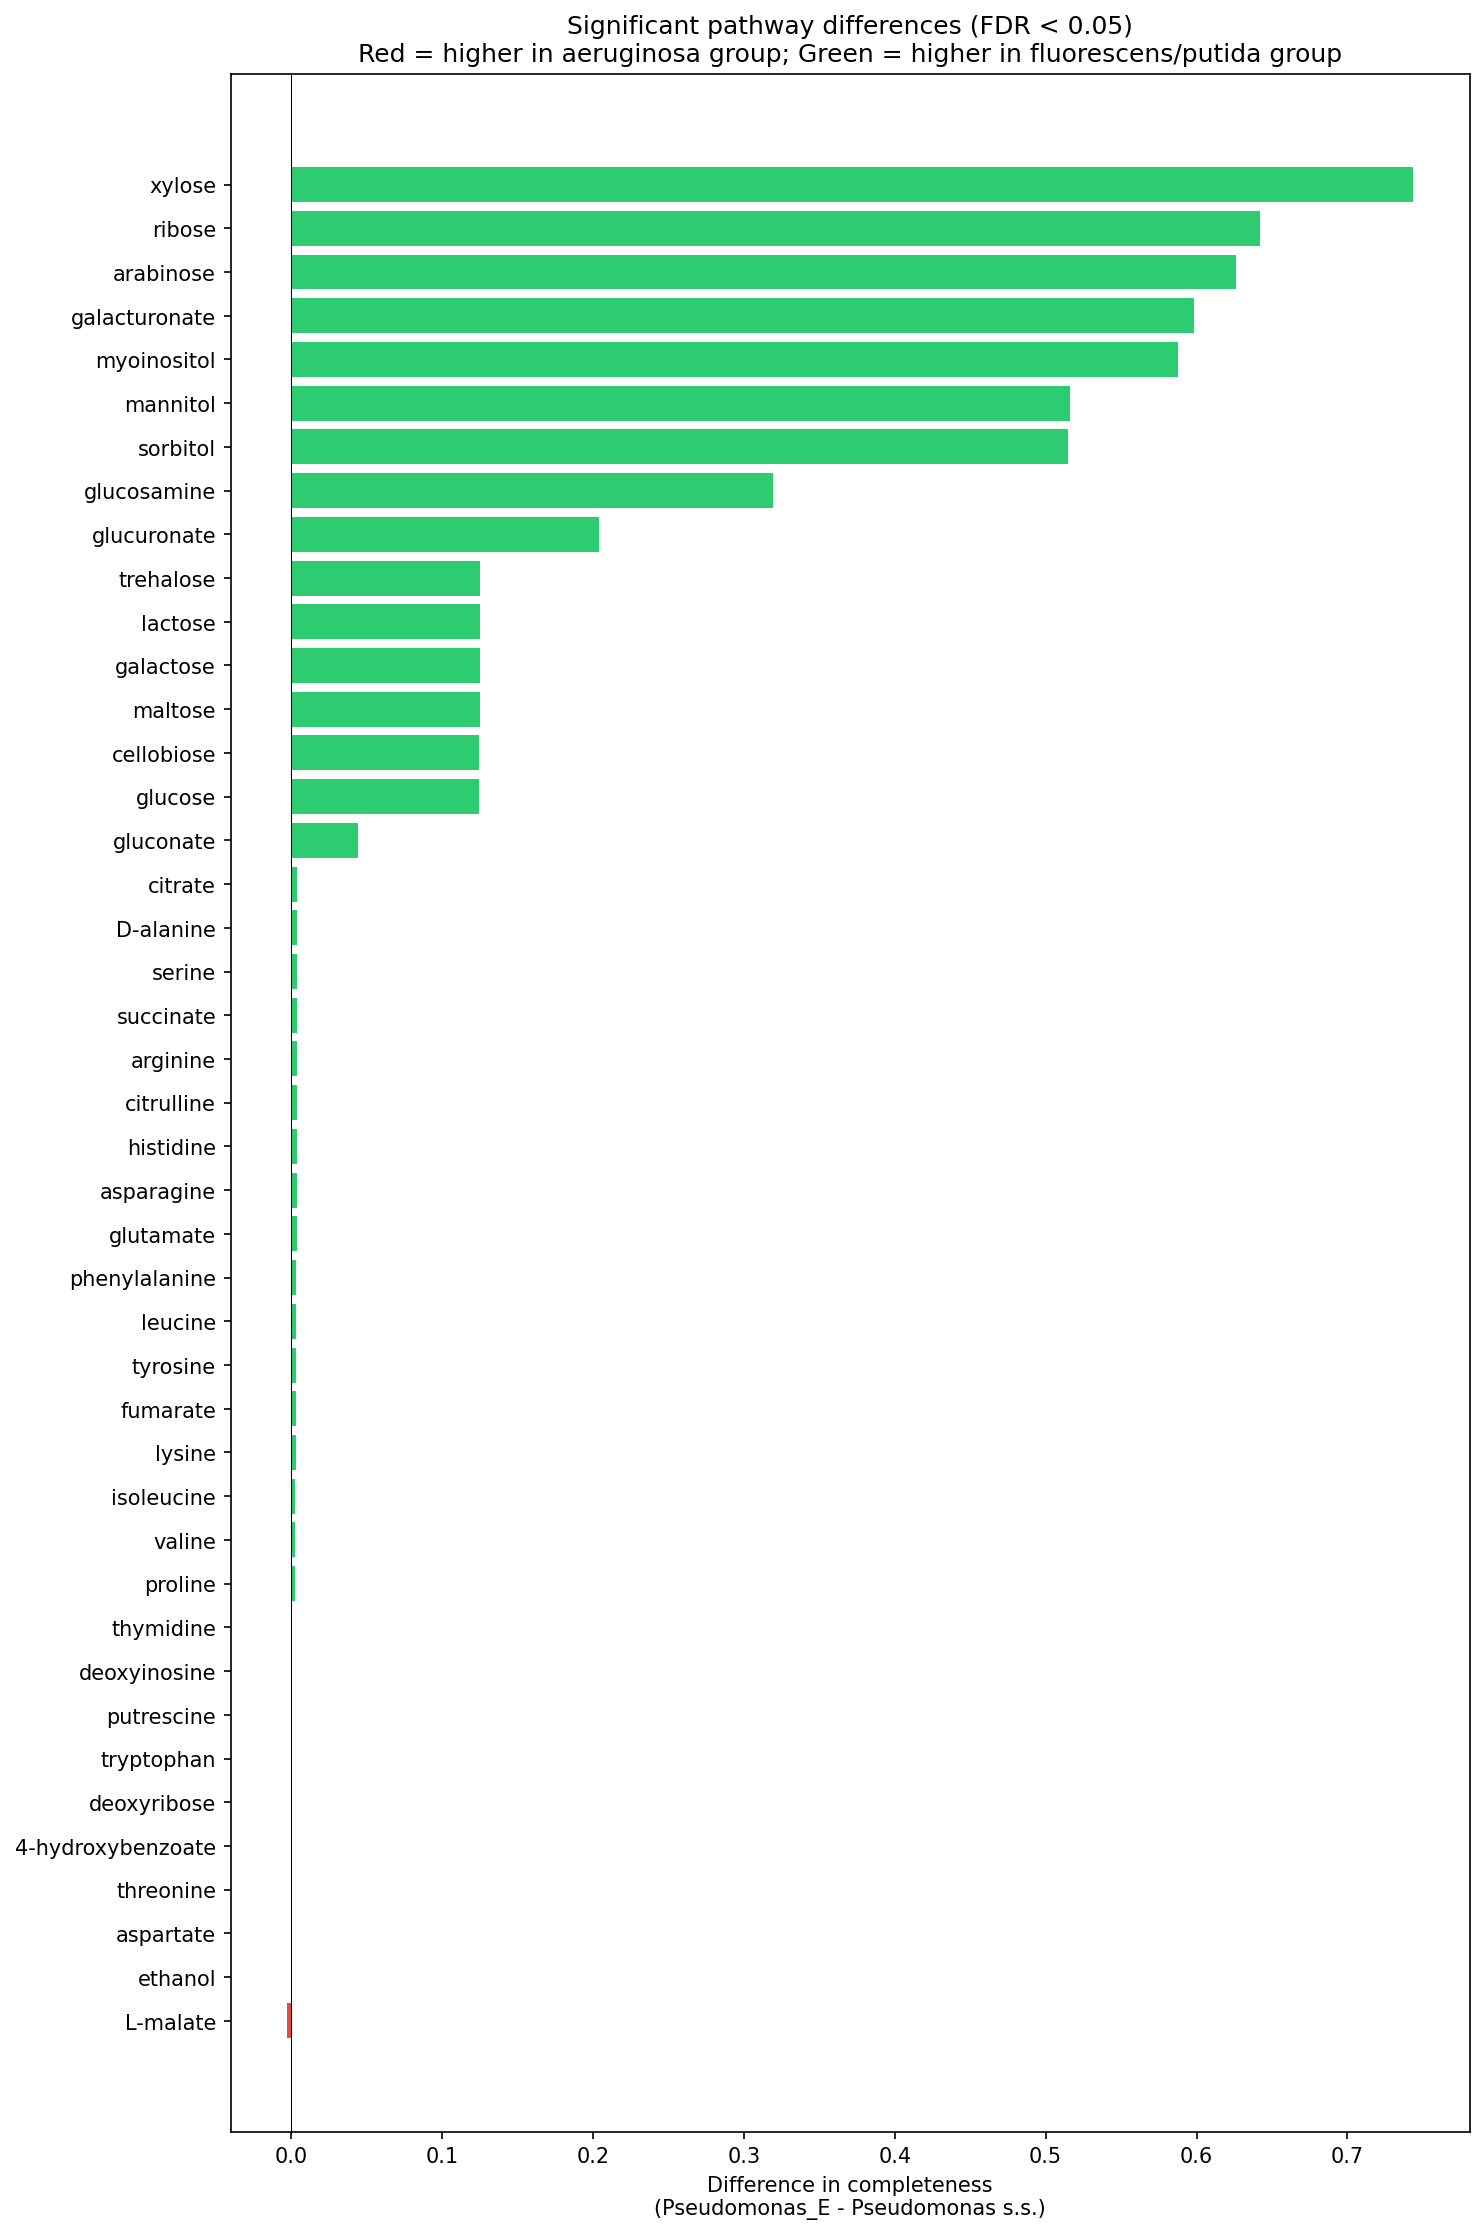 Barplot of pathway completeness differences between subgenera. From pseudomonas_carbon_ecology.
Amino-acid pathways, including arginine, histidine, serine, and glutamate, and core organic-acid pathways, including citrate, succinate, and pyruvate, remained near-universal (>99%) in both groups; arginine, histidine, serine, and glutamate pathways remained >99.5% complete in P. aeruginosa. Nineteen pathways showed no significant subgenus difference, including acetate, pyruvate, fructose, L-lactate, D-lactate, glycerol, alanine, sucrose, 2-oxoglutarate, propionate, phenylacetate, deoxyribonate, and glucose-6-phosphate. 1
Rhamnose and fucose were more complete in P. aeruginosa (66.8%) than in the P. fluorescens group (41.3% and 45.1%, respectively), although these differences were not statistically significant after FDR correction. The report interprets the overall result as strongly supporting the hypothesis of pathway loss in host-associated clades, while noting that the rhamnose pattern may reflect P. aeruginosa use of rhamnolipids as virulence factors. 1
Carbon profiles contain ecological signal
Among 54 free-living and plant-associated species with at least 5 genomes and at least 60% majority-environment agreement, carbon pathway profiles were significantly associated with isolation environment. A PERMANOVA-like permutation test using 999 permutations produced p = 0.006, with between-group mean distance of 2.054 exceeding within-group mean distance of 1.890 and a between/within ratio of 1.087. Principal component analysis (PCA) of the 62-pathway profiles captured 74.9% of variance in the first 5 components; PC1 explained 31.2% and PC2 explained 17.9%. 1
A Random Forest classifier trained on four environment classes—soil, freshwater, plant_surface, and rhizosphere—achieved balanced accuracy of 0.408 +/- 0.169 in 5-fold stratified cross-validation, above the 0.250 chance baseline. The filtered dataset contained 51 species: soil 13, freshwater 13, plant_surface 19, and rhizosphere 6. The most discriminating pathways were D-serine (importance 0.132), which the report associates with rhizosphere niches; arabinose (0.094), a plant-derived pentose sugar; rhamnose (0.086), a plant cell wall component; fucose (0.085), a plant/animal glycan sugar; and xylose (0.070), a hemicellulose-derived sugar. 1
The report assesses ecology prediction as partially supported: environment categories were non-random in carbon-pathway space, but the balanced accuracy of 0.408 indicates that carbon profiles alone are insufficient for fine-grained environment discrimination among free-living species. 1
Pathway richness and the subgenus split
Across Pseudomonas species with at least 5 genomes, free-living and plant-associated species had higher carbon pathway richness than host-associated species, with a median of 57 pathways complete in more than 50% of genomes versus 55. Within Pseudomonas_E, plant-associated species averaged 56.7 pathways, free-living species 56.1, and host-associated species 55.2. 1
Across all species, the primary PCA axis separated Pseudomonas s.s. from Pseudomonas_E, driven by sugar-pathway loss; lifestyle categories substantially overlapped within Pseudomonas_E. The report therefore identifies the deep subgenus division as the dominant source of carbon-pathway variation rather than lifestyle differences within Pseudomonas_E. 1
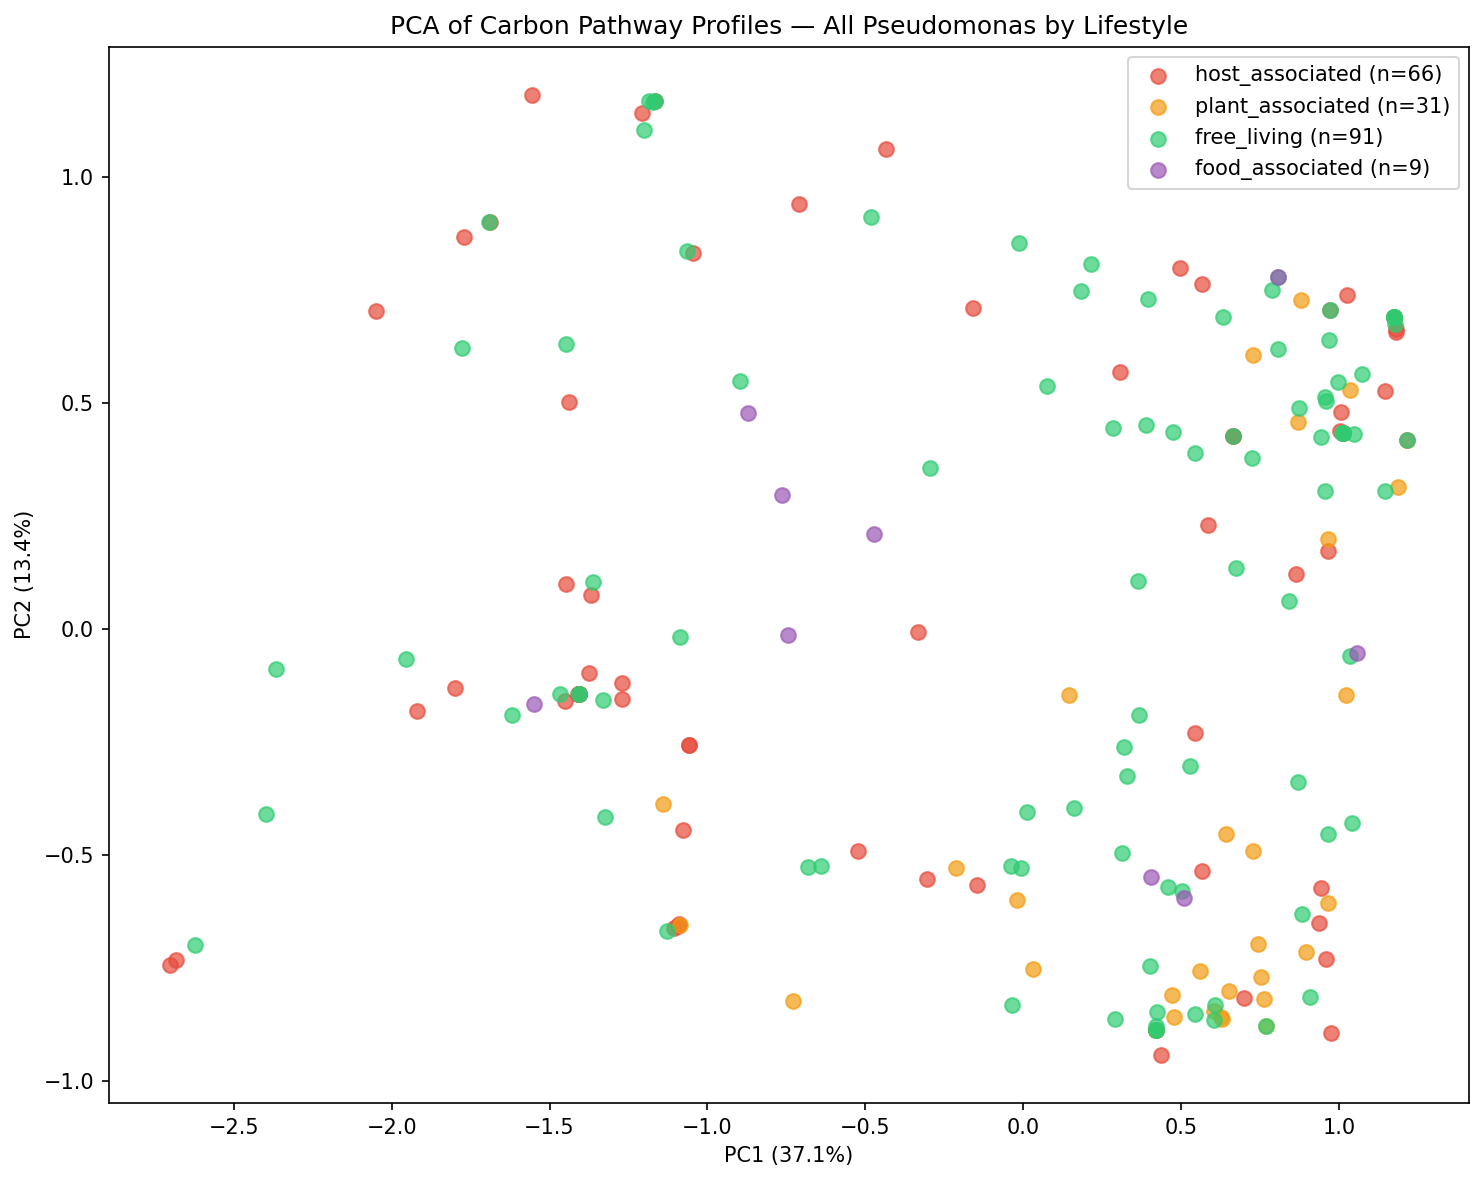 PCA of all Pseudomonas species colored by lifestyle. From pseudomonas_carbon_ecology.
Interpretation and literature context
The report characterizes the scale of sugar-pathway loss as completeness differences of >50 pp for 7 pathways and >10 pp for 15 pathways between the host-associated and free-living subgenera. It notes that the specific pathways lost (xylose, arabinose, myo-inositol, galacturonate) are those involved in plant cell wall and rhizosphere carbon cycling. It interprets this as consistent with release from selection for plant-associated metabolism during a transition to animal host environments. That transition was not directly tested, so this remains a hypothesis. 1
The report cites Rossi et al. (2021), who documented progressive loss of metabolic versatility in chronic P. aeruginosa infections. It suggests the hypothesis that much of this “loss” is not acquired during infection but instead reflects ancestral metabolic streamlining of the P. aeruginosa lineage itself, because these pathways were already absent at the species level across thousands of isolates. The timing of loss is an interpretation, not a measured result. 1
The report places its results against earlier work on P. fluorescens-group metabolic diversity. It attributes to Silby et al. (2011) and Loper et al. (2012) the estimate that ~54% of the P. fluorescens-group pangenome encodes variable metabolic capabilities. It cites Belda et al. (2016) as documenting 92 catabolic pathways in the re-annotated P. putida KT2440 genome. It cites Nikel & de Lorenzo (2018) on P. putida’s broad carbon-source utilization spanning sugars, organic acids, and aromatics. The report states that its analysis quantifies this at genus scale: the P. fluorescens/putida group maintains mean richness 56.1, compared with ~50 in P. aeruginosa, particularly in sugar and sugar-alcohol catabolism. The 56.1 value matches the figure reported above for free-living species within Pseudomonas_E, and the report gives the P. aeruginosa value only as approximate. 1
The report cites Saati-Santamaria et al. (2022), who analyzed 3,274 Pseudomonas genomes and found niche-dependent functional divergence with environment-specific metabolic pathway sets. It describes the modest accuracy for fine-grained environment type (0.41) as consistent with Guo et al. (2026), who found hydrocarbon degradation genes concentrated in the accessory genome with strain-level rather than species-level variation. From this, the report hypothesizes that GapMind’s 62 carbon pathways (Price et al. 2022) may be too coarse to capture niche-specific metabolic differences operating at the strain level within environmental species. 1
Dataset scale and pathway profiles
The analysis extracted GapMind carbon-pathway predictions for 12,732 genomes across 433 Pseudomonas species clades (GTDB r214). The genus spans 5 GTDB subgenera. Two of them dominate: Pseudomonas s.s. (19 species, 6,905 genomes, primarily P. aeruginosa) and Pseudomonas_E (398 species, 5,687 genomes, comprising the P. fluorescens, P. putida, and P. syringae groups). Isolation-source metadata were available for 64.2% of genomes (8,171/12,732 with classifiable sources). Keyword classification assigned genomes to 10 environment categories. The percentages below are the report’s own and are shares of all 12,732 genomes: clinical 4,197 (33.0%), human (other) 1,659 (13.0%), freshwater 566 (4.4%), soil 551 (4.3%), plant surface 503 (4.0%), rhizosphere 275 (2.2%), food/dairy 141 (1.1%), animal 136 (1.1%), industrial 80 (0.6%), and marine 63 (0.5%). 1
Of 433 species, 387 had at least one classifiable genome, yielding majority-lifestyle assignments of 204 free-living, 109 host-associated, 59 plant-associated, and 15 food-associated species. Species-level pathway completeness was the fraction of genomes scored complete or likely_complete for each of 62 GapMind pathways; mean completeness across species was 0.882, and pathway richness ranged from 27 to 61 pathways, with mean 54.6. The generated genome-level carbon-pathway table contained 789,012 rows. 1
The inputs came from the kbase_ke_pangenome collection: the tables pangenome, gapmind_pathways, genome, ncbi_env, sample, gtdb_metadata, and gtdb_taxonomy_r214v1. Together these supplied species pangenome statistics, carbon pathway predictions, isolation-source metadata, and taxonomy. 1
Figures
pathway_heatmap.png— heatmap of pathway completeness across species, ordered by subgenus and lifestyle. 1pathway_loss_barplot.png— barplot of pathway-completeness differences between Pseudomonas s.s. and Pseudomonas_E. 1pathway_pca_by_environment.png— PCA of free-living species colored by isolation environment. 1rf_importance.png— Random Forest feature importance for environment prediction. 1pathway_richness_by_lifestyle.png— boxplots of pathway richness by lifestyle category. 1pathway_pca_by_lifestyle.png— PCA of all species colored by lifestyle category. 1environment_by_subgenus.png— environment distribution by GTDB subgenus. 1
Caveats and Limitations
The report identifies sampling bias as a limitation: P. aeruginosa comprised 53% of all genomes (6,760/12,732) because of clinical importance, while many environmental species had fewer than 10 sequenced genomes. This imbalance affects the power of species-level comparisons. 1
Isolation-source classification was based on free-text keywords and introduced approximately 6.7% “unknown” and approximately 29.1% “other” classifications; misclassification could attenuate the ecological signal. Species-level majority-vote assignment also obscures genuinely generalist species that inhabit multiple environments. 1
GapMind’s 62 carbon pathways cover common carbon sources but omit genus-specific capabilities, particularly aromatic degradation pathways such as toluene, naphthalene, and benzoate degradation that are central to P. putida ecology. The report proposes extending the analysis with aromatic-pathway modules, including KEGG modules, to test whether they provide stronger environmental signal. 1
Phylogenetic confounding is substantial: the dominant PCA signal separates subgenera rather than lifestyles, and the analyses do not explicitly control for phylogenetic non-independence among species. The report proposes phylogenetic generalized least squares (PGLS), a regression method that accounts for phylogenetic relatedness, or phylogenetic logistic regression using the GTDB species tree. 1
The report further notes that the moderate classifier accuracy may reflect small sample sizes per class, overlap between related environments such as soil and rhizosphere, and the coarse resolution of the 62 GapMind pathways. Several species, such as P. fluorescens and P. putida, are isolated from multiple environments, so the report proposes a within-species analysis of pathway variation to test whether it reveals metabolic ecotypes, meaning subpopulations adapted to different niches. Environment prediction in this report was conducted at species level. The report proposes moving to genome-level prediction using the full 789K genome-pathway matrix with genome-specific isolation sources, to increase statistical power. It also proposes cross-referencing carbon pathway predictions with RB-TnSeq (random barcode transposon sequencing) fitness data from the kescience_fitnessbrowser (Fitness Browser) collection. That comparison would experimentally test which pathways are functionally important on specific carbon sources. None of these analyses is reported as performed. 1
Slots Into
- ecotype-environment-gene-content — Carbon pathway profiles, environment associations, and proposed within-species metabolic ecotypes connect gene content to ecological niche. 1
- environment-embedding-geography — PCA, permutation testing, and Random Forest results quantify how pathway profiles embed isolation environments, while the modest classifier accuracy defines the limits of that signal. 1
- pangenome-integration — The report uses species- and genome-scale pangenome pathway matrices and proposes integrating them with strain-level metadata and fitness data. 1
- metabolic-model-gapfilling — GapMind pathway completeness supplies standardized metabolic-capability predictions and motivates adding aromatic degradation pathways and experimental fitness validation. 1
- metabolic-capacity-specialization — Lineage-level loss of plant-sugar pathways in the P. aeruginosa group, the shared-core null pathways, and the non-significant rhamnose/fucose excess illustrate subgenus-scale metabolic specialization. 1
- within-species-conservation-between-species-functional-divergence — Large between-subgenus completeness differences contrast with species-level pathway conservation. 1
- two-speed-bacterial-genome — Near-universal amino-acid and core organic-acid pathways persist while sugar catabolism is lost. 1
- biosynthetic-prototrophy-and-auxotrophy — Retained amino-acid pathways in P. aeruginosa are interpreted as nutritional specialization. 1
- pangenome-openness-determinants — The report cites literature estimating that much of the P. fluorescens-group pangenome encodes variable metabolic capabilities. 1
- phylogenetic-confounding-of-pangenome-associations — The dominant PCA axis separates subgenera, analyses lack phylogenetic control, and PGLS is proposed. 1
- cultivation-collection-bias-in-ecological-genomics — Clinical over-representation of P. aeruginosa genomes and incomplete isolation-source metadata bias the ecological comparison. 1
- sampling-depth-and-downsampling-effects — Sparse genomes for environmental species and the proposed shift to genome-level prediction bear on statistical power. 1
- sample-size-aware-phenotype-consensus — Species-level completeness fractions, minimum-genome filters, and majority-vote environment assignment shape the consensus phenotype. 1
- ontology-and-category-schema-sensitivity — Keyword environment categories and the fixed GapMind pathway set constrain what can be detected. 1
- pathway-versus-reaction-evidence-resolution — The report hypothesizes that GapMind pathways are too coarse for strain-level niche differences. 1
- cross-condition-metabolic-comparability — Missing aromatic degradation pathways limit comparison across catabolic capabilities. 1
- computational-pathway-prediction-validation — Aromatic-module extension and RB-TnSeq validation are proposed but not performed. 1
- lab-field-fitness-concordance — Proposed Fitness Browser cross-reference would test predicted pathways against laboratory fitness. 1
- ecotype-clustering-validity — Within-species metabolic ecotypes in multi-environment species are proposed, not yet tested. 1
- taxonomic-resolution-dependent-functional-inference — Species-level prediction is proposed to move to genome level. 1