Two reports on the Acinetobacter baylyi ADP1 mutant collection summarize pairwise Pearson correlation coefficients (r, a measure of linear association between two conditions’ gene-fitness profiles) across 8 carbon sources with different statistics, and one gives a lower central value than the other. 1,2 The difference matters for condition-space-dimensionality: the lower the typical correlation between conditions, the more independent axes the condition space appears to need. A page that quotes one statistic without naming it can overstate or understate how separable substrate-specific requirements are.
Evidence Sides
Deletion-phenotype analysis: median r = 0.25 The deletion-phenotype analysis reports a median, meaning the middle value of the ranked pairs, of r = 0.25 across all 28 condition pairs among the 8 carbon sources. 1,2 It also reports r = 0.58 for the acetate–butanediol pair. 1,2
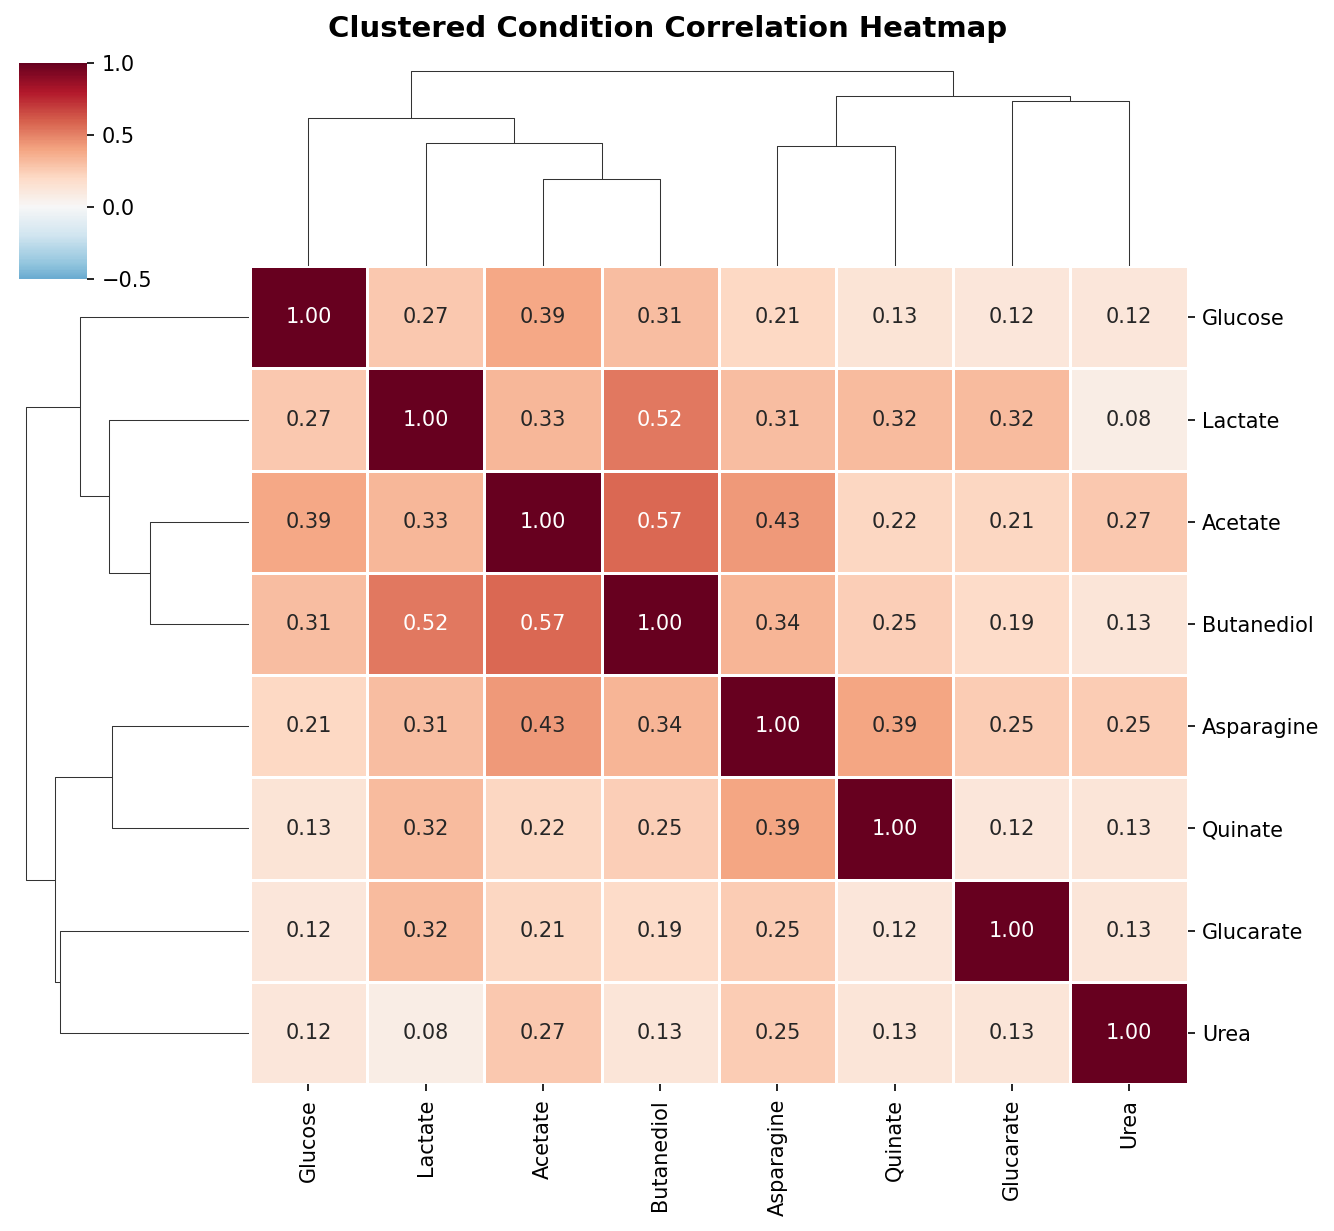 Condition correlation heatmap with hierarchical clustering. From adp1_deletion_phenotypes.
ADP1 explorer: mean r = 0.44 The ADP1 explorer reports a mean pairwise r = 0.44 across the 8 carbon sources. 1,2 It agrees on the acetate–butanediol pair at r = 0.58. 1,2
Neither report establishes why the summaries differ. The moderate-correlation interpretation should therefore be cited with the statistic each report used, not averaged. 1,2
Possible Reconciliations
- Hypothesis: summary statistic. A mean and a median over the same pairs can diverge when pairwise r values are skewed, so both figures could describe one underlying set of correlations. Neither report tests this. 1,2
- Hypothesis: gene filtering. The reports may have computed correlations over different gene sets, which would change per-pair r values, not only their summary. Neither report establishes this either. 1,2
- Hypothesis: different pair sets or correlation inputs. The explorer’s mean is reported as a mean pairwise r across the 8 carbon sources, without stating that it covers all 28 pairs. 1,2 An unstated denominator is not evidence of a different pair set or fitness metric; this would need checking against both analysis notebooks.
The shared acetate–butanediol value of r = 0.58 shows the two reports agree on at least one pair. 1,2 It does not by itself show which hypothesis, if any, holds.
Resolving Work
- Same pairs, both statistics: Recompute all 28 pairwise Pearson r values from the ADP1 growth-fitness table and report mean and median side by side. Does a summary-statistic difference alone reproduce both published values?
- Gene-set audit: Extract each project’s gene inclusion criteria and recompute correlations on each gene set and their intersection. Does filtering shift per-pair r values?
- Pair-level comparison: Align the per-pair r values each report produced, beyond acetate–butanediol. Do the reports disagree at the pair level, or only in aggregation?
- Robustness to correlation measure: Compute Spearman rank correlations (association between ranked rather than raw values) alongside Pearson on the same matrix. Is the “moderate correlation” reading sensitive to outlier genes?
- Dimensionality consequence: Re-run the dimensionality estimate under each gene set. Does the inferred number of independent condition axes change?