The central discoveries digest and the environmental-resistome analysis report different efflux-pump shares of antimicrobial-resistance (AMR) genes for human-gut and aquatic species, and attach different effect sizes to their efflux contrasts. 1,2 This matters because environmental-resistome argues that niches select for different resistance strategies, and that argument’s strength depends on which values hold. Related core/accessory values also require harmonized entity sets, filters, annotations, and denominators. 1,2,3 Core genes are present in all genomes of a species’ pangenome (the combined gene set across its genomes), while accessory genes are present in only some. The same concept page also leaves soil COG (Clusters of Orthologous Groups, families of homologous genes) associations unresolved against a metal-specific interpretation, because chromium, copper, lead, and zinc co-vary in many industrial soils. 4
Evidence Sides
Discoveries digest
- The digest reports that efflux makes up 21% of AMR in human-gut species and 1% in aquatic species. 1,2,3
- It attaches η²=0.127 to this efflux contrast. η² (eta-squared) is the proportion of variance explained by environment. 1,2
- It reports metal resistance at 45% in soil/aquatic species versus 6% in human gut (η²=0.107), and 68% accessory AMR in clinical versus 43% in soil species. 1,2
- The digest does not document denominators for these metal-resistance and clinical-versus-soil accessory figures. 1,2
Environmental-resistome analysis
- The environmental-resistome analysis reports efflux at 7.0% in human-gut species and 1.1% in aquatic species. 1,2,3
- It gives the efflux effect as η² = 0.055. 1,2
- The 21% versus 7.0% gap, and the related 13% versus 44% core/accessory values, cannot be compared until entity sets, filters, annotations, and denominators are harmonized. 1,2,3
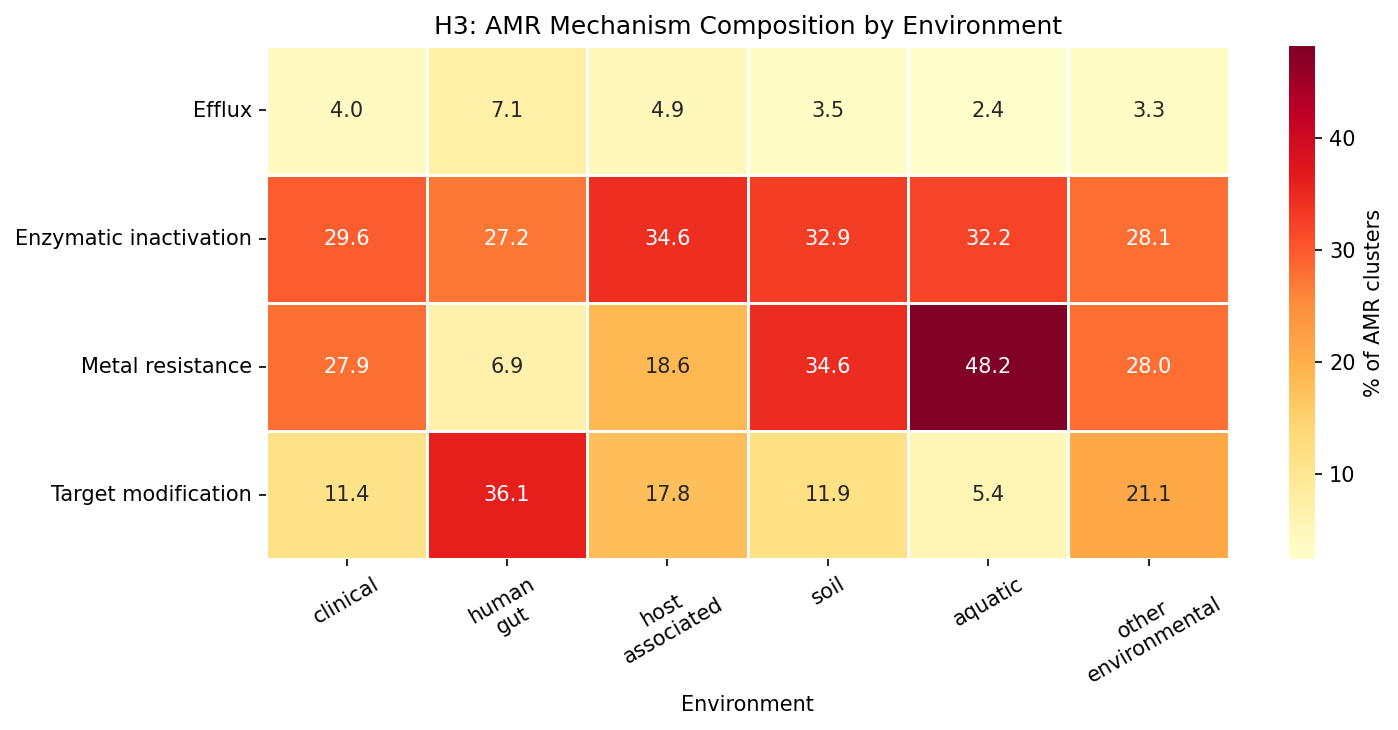 Mechanism composition by environment. From amr_environmental_resistome.
Neither side is preferred here. The two values are not averaged.
Possible Reconciliations
- Hypothesis 1: different denominators. The digest may express efflux as a share of a different total than the environmental-resistome report, such as pooled gene clusters, per-species means, or a mechanism-restricted subset. This is untested.
- Hypothesis 2: different entity sets or filters. The figures may come from different species sets, environment assignments, or inclusion thresholds, which could shift the shares, η², or both.
- Hypothesis 3: different annotation versions. Mechanism classes may have been assigned under different catalog versions or category mappings, changing which genes count as efflux.
- Hypothesis 4: transcription or provenance drift. The digest’s figures may have been carried over from an earlier or different analysis than the final report.
Resolving Work
- Recompute shares under each candidate denominator. Use the per-species AMR mechanism tables behind the environmental-resistome report. Recompute efflux shares by environment under each denominator (pooled clusters, per-species mean, per-species median). The question is whether any of them reproduces the digest’s human-gut efflux value.
- Trace the digest’s provenance. Link each digest figure (efflux, metal, accessory shares and the η² values) to a specific notebook output. The question is which analysis run, filter set, and species set produced it.
- Rerun the effect-size test on a harmonized dataset. Run the Kruskal-Wallis test (a rank-based comparison across groups) for efflux by environment on one fixed entity set and annotation version. The question is whether η² converges on one of the two reported values.
- Align the core/accessory figures. Cross-tabulate mechanism by core/accessory status on the same species set used for the environment shares. The question is whether the 13% and 44% values describe the same quantity, such as accessory fraction within a mechanism, as the 68% and 43% environment-level values.