Two projects in the corpus measured the baseline fitness cost of antimicrobial resistance (AMR) genes against their pangenome prevalence, meaning how widely each gene occurs across the sequenced genomes of its species. They reached results that do not line up. One found no difference between core and accessory AMR genes. The other found that singleton AMR genes are the costliest class. 1,2 The disagreement bears on the claim in pangenome-conservation-fitness-decoupling that an AMR gene’s prevalence does not predict the fitness effect of disrupting it. If the rarest genes behave differently, that decoupling may hold only for coarse prevalence classes. Neither side is preferred here. 1,2
Evidence Sides
Side A: no core–accessory difference (amr_fitness_cost)
This analysis split AMR genes into core and accessory using a ≥95% prevalence threshold for “core”. 1,2 It found no core–accessory difference in baseline fitness, with p = 0.33. Baseline fitness is the measured fitness effect of a gene knockout outside antibiotic selection. The p-value is the probability, assuming no true difference, of a result at least as extreme as the one observed. 1,2 This is a null result. The analysis drew on 25 organisms from the Fitness Browser, a compendium of gene-knockout fitness measurements. 1,2
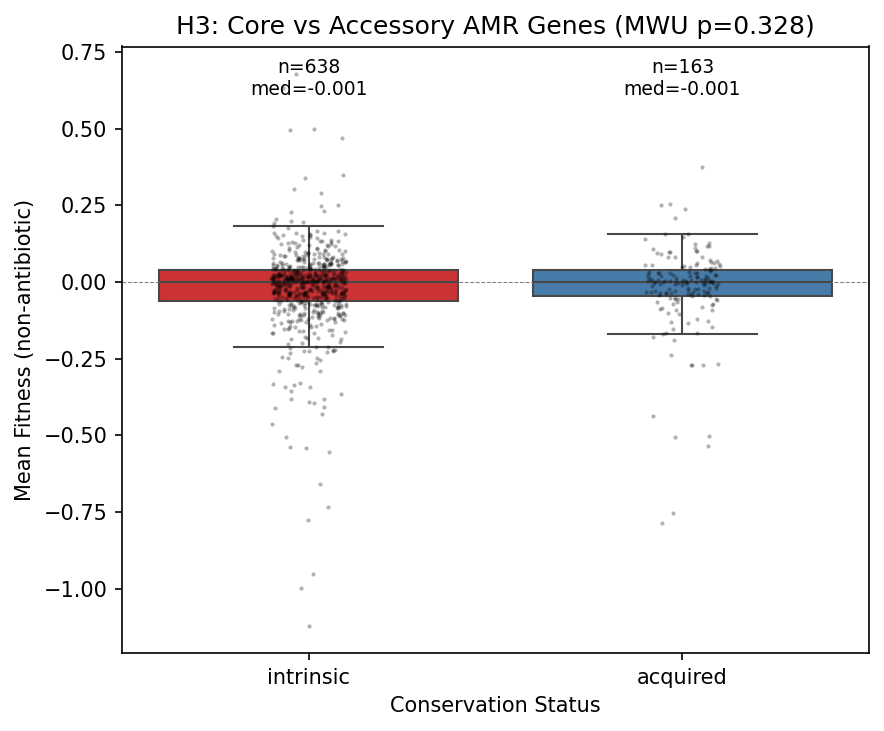 Box plot comparing core vs accessory AMR gene fitness. From amr_fitness_cost.
Side B: singleton AMR genes are costliest (amr_pangenome_atlas)
This analysis categorized genes by singleton status, where a singleton is a gene found in only one genome of the species. It found singleton AMR genes to be the costliest, with a median of -0.019. 1,2 It also found AMR genes overall slightly less costly than non-AMR genes, with a median of -0.007 vs -0.012. 1,2 It drew on 37 Fitness Browser organisms and used a different gene-linking method from Side A. 1,2
Possible Reconciliations
- Hypothesis 1 (rarity, not accessory status): The singleton result may reflect the rarest genes rather than the accessory class as a whole. 1,2 Under a ≥95% core threshold, singletons would be pooled with all other non-core genes, which could dilute their signal. Both findings could then hold at once.
- Hypothesis 2 (organism set): The two analyses cover different organism sets, 25 versus 37 organisms. 1,2 The organisms present in only one analysis might carry the singleton cost signal.
- Hypothesis 3 (gene linking): The two analyses linked fitness data to pangenome genes by different methods. 1,2 Each method might assign a different subset of AMR genes to each prevalence category.
Resolving Work
- Re-run the core-versus-accessory comparison on Side B’s organism set, then the singleton comparison on Side A’s organism set. Using the Fitness Browser fitness values and prevalence labels, this tests whether the organism set alone produces the difference.
- Split Side A’s accessory class into singleton and non-singleton genes with the same gene-linking method. This tests whether singletons are costlier within the accessory class (Hypothesis 1).
- Apply both gene-linking methods to the same organisms and cross-tabulate which AMR genes receive which prevalence label. This tests whether linking differences reassign genes between categories (Hypothesis 3).
- Model fitness as a function of prevalence treated as a continuous fraction rather than a binary label. This asks whether cost changes smoothly with rarity or only at the singleton extreme.