In this corpus, “dark” genes are genes that lack functional annotation: hypothetical proteins, DUFs (domains of unknown function) and uncharacterized proteins 1. Literature darkness, meaning a lack of connected publications, is a separate layer. A gene without text-mined papers may still carry curated knowledge 2,3. The corpus addresses both layers through:
- fitness assays showing that many unannotated genes matter in the laboratory 1;
- pangenome and structure-database joins that measure where annotation is thin 4;
- comparisons of annotation pipelines 3;
- audits showing that “unknown” and “absent” labels can reflect the method rather than the biology 5,6.
Across these sources, darkness is graded and partly method-dependent, and combined evidence resolved more than any single signal 3,1,7.
Literature Context
Many bacterial genes lack assigned function. A network-based Mycobacterium tuberculosis analysis states that up to 50% of genes in a genome are often labelled “unknown”, “uncharacterized” or “hypothetical” PMID 22837694. The original TB annotation left 40% of open reading frames (ORFs) as conserved hypothetical, hypothetical or of unknown function, motivating community reannotation PMID 23375378. Other organisms show similar fractions:
- 444 of 1,027 proteins in Treponema pallidum SS14 PMID 25894582;
- 690 of 4434 proteins (15.56%) in Serratia marcescens FGI94 PMID 32834707;
- 25% of the Pseudomonas aeruginosa proteome PMID 34383409;
- almost half of the Synechocystis proteome PMID 33636367.
Each of these is a single-strain estimate taken from an abstract, so the fractions are not directly comparable.
A review notes that structure-based homolog detection often succeeds where sequence alone fails, because folds persist after sequence similarity becomes undetectable. It also warns that homologs often differ in function and that conservation-based inferences “are tenuous” PMID 15029827. In vitro biochemistry makes this concrete. TmpA, misannotated as a γ-butyrobetaine hydroxylase, showed no activity toward γ-butyrobetaine and instead hydroxylates 2-(trimethylammonio)ethylphosphonate (TMAEP). The authors judge annotation founded solely on sequence and domain similarity unreliable in diversified metalloenzyme superfamilies PMID 30789718. In silico efforts leave much unresolved:
- Serratia: after excluding sequences of ≤100 residues, functions were predicted for 483 proteins, but with high confidence for only 108 PMID 32834707;
- Treponema: 207 of 444 at high confidence PMID 25894582;
- H. pylori: structural folds, not functions, assigned to 464 of 557 uncharacterized proteins PMID 25549250.
Context-based methods add evidence. In Synechocystis sp. PCC 6803 alone, co-fractionation mass spectrometry defined 24,092 protein-protein interactions and assigned roles to hypothetical proteins such as Sll0445–Sll0447 PMID 33636367. Phylogenetic profiling compares protein presence–absence across genomes, and community profiling compares it across microbial communities. Combining the two improved association prediction “only marginally” PMID 28454776.
The corpus is consistent with this literature and extends it. Its 24.9% unannotated fraction across 48 Fitness Browser organisms falls within the published single-genome range. It complements per-genome curation with a cross-organism measurement tied to fitness phenotypes. Bakta reclassified 83.7% of pangenome-linked dark genes, which echoes the TB reannotation framing at pangenome scale.
Multiple-sequence-alignment (MSA) depth is the number of homologs in an alignment. Its gradient, and the dark-core cluster set, fit the review’s point that evolutionary signal aids annotation without guaranteeing it. The iron-reduction marker correction is a pangenome-scale counterpart to the TmpA/TmpB case.
Gapfilling adds reactions that restore predicted growth in draft metabolic models. The corpus pipeline assigned candidate genes to 47.8% of gapfilled enzymatic reaction–organism pairs, against at most 35% for any single stream. The outcomes differ from the profiling study’s, so effect sizes are not comparable. Experimental confirmation of either is not documented in the supplied evidence.
Research-attention inequality and false negatives in literature-retrieval tools are not addressed by the supplied abstracts.
What the Corpus Shows
How much is dark depends on who is asked. Across 48 Fitness Browser organisms, 57,011 of 228,709 genes (24.9%) lacked functional annotation. Of these, 17,344 had strong fitness effects (|fitness| ≥ 2 in at least one condition) or were essential (no viable transposon mutants) 1. Reannotation moves the boundary. Bakta v1.12.0 with DB v6.0 reclassified 33,105 of 39,532 pangenome-linked dark genes (83.7%) as not hypothetical, leaving 6,427 that stayed hypothetical in both systems 1.
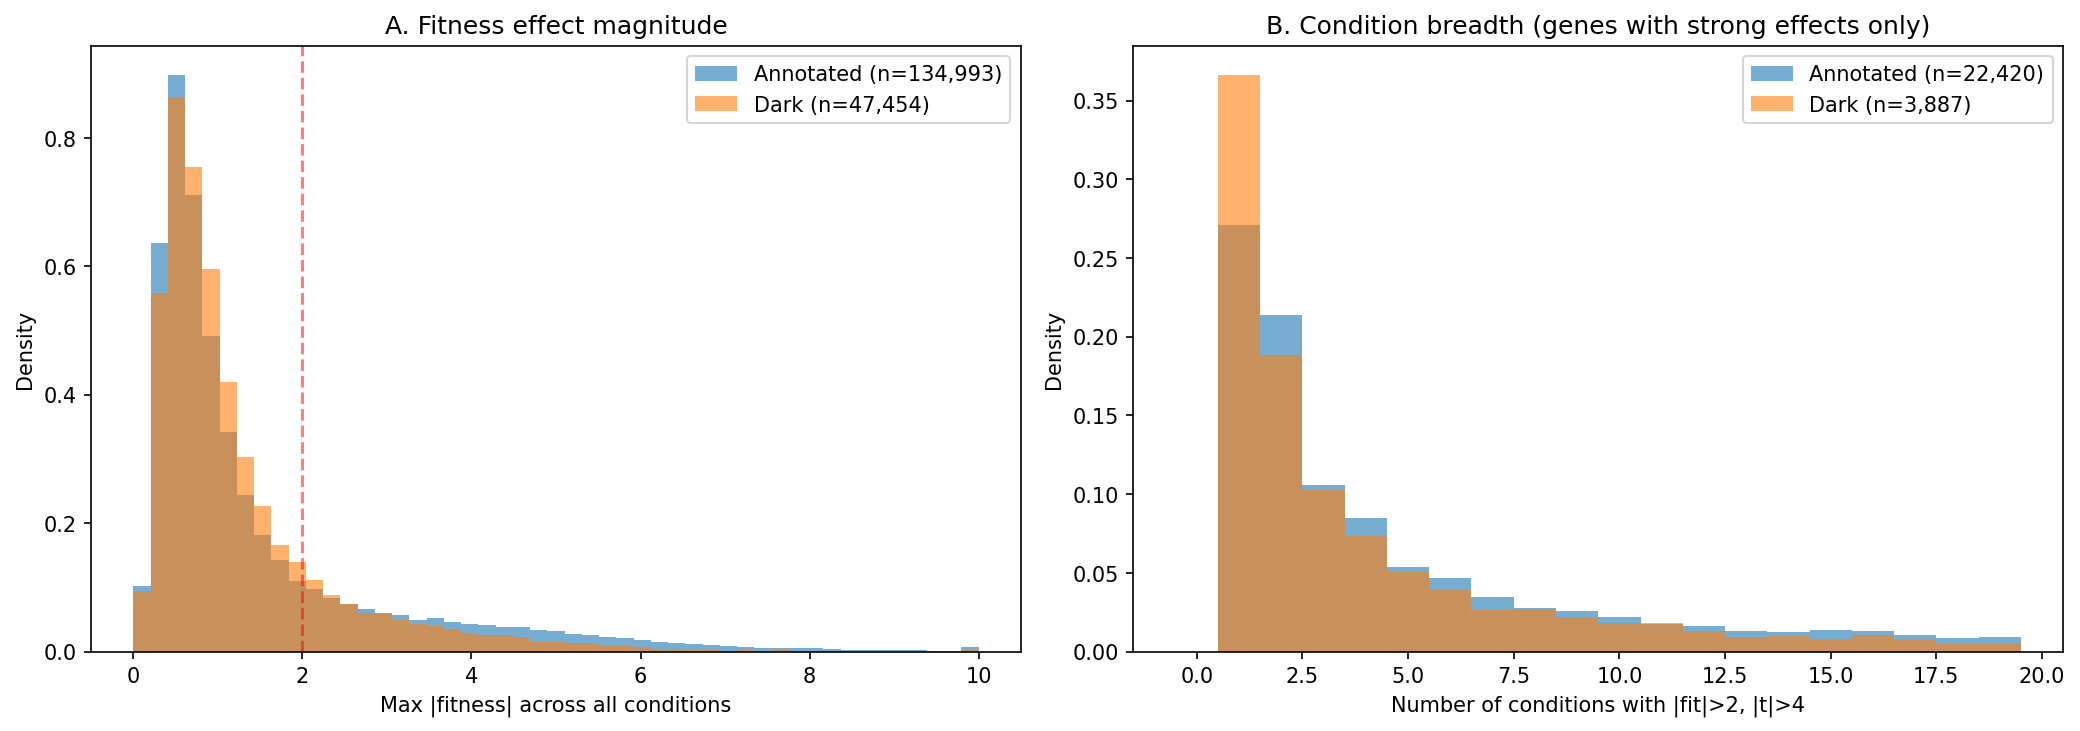 Fitness distributions for dark vs annotated genes. From functional_dark_matter.
At pangenome scale, eggNOG and Bakta cover different ground:
- eggNOG had higher coverage of COG (Clusters of Orthologous Groups), KEGG (Kyoto Encyclopedia of Genes and Genomes) and Pfam (protein-domain family) annotations 3.
- Bakta had higher coverage of GO (Gene Ontology) terms, product descriptions and UniRef50 (UniProt 50%-identity cluster) links 3.
- Their union raised any-functional-annotation coverage to 77.3% 3.
- Bakta rescued 11.2M of the 39.2M clusters that eggNOG missed 3.
Identifier bridges also leak. Only 33.3% of Bakta’s 17.6M distinct UniRef50 IDs existed in the KBase Data Lakehouse UniProt identifier table 3. Apparent darkness therefore partly reflects annotation-system and identifier coverage 3, as evidence-triangulation-for-functional-annotation argues.
Sequence-space depth predicts annotation, but conservation does not guarantee understanding. AlphaFold multiple-sequence-alignment (MSA) depth is the number of homologous sequences represented in an alignment. Across 38,051,842 gene cluster–UniProt pairs, it correlated with domain-hit count at Spearman ρ = 0.7563 4.
Pangenome class tracks the same gradient:
- Core clusters had a median MSA depth of 15,308, against 5,299 for auxiliary+singleton clusters 4.
- Hypothetical-protein rates rose from 3.8% in core clusters to 11.6% in auxiliary non-singleton clusters and 13.8% in auxiliary+singleton clusters 4.
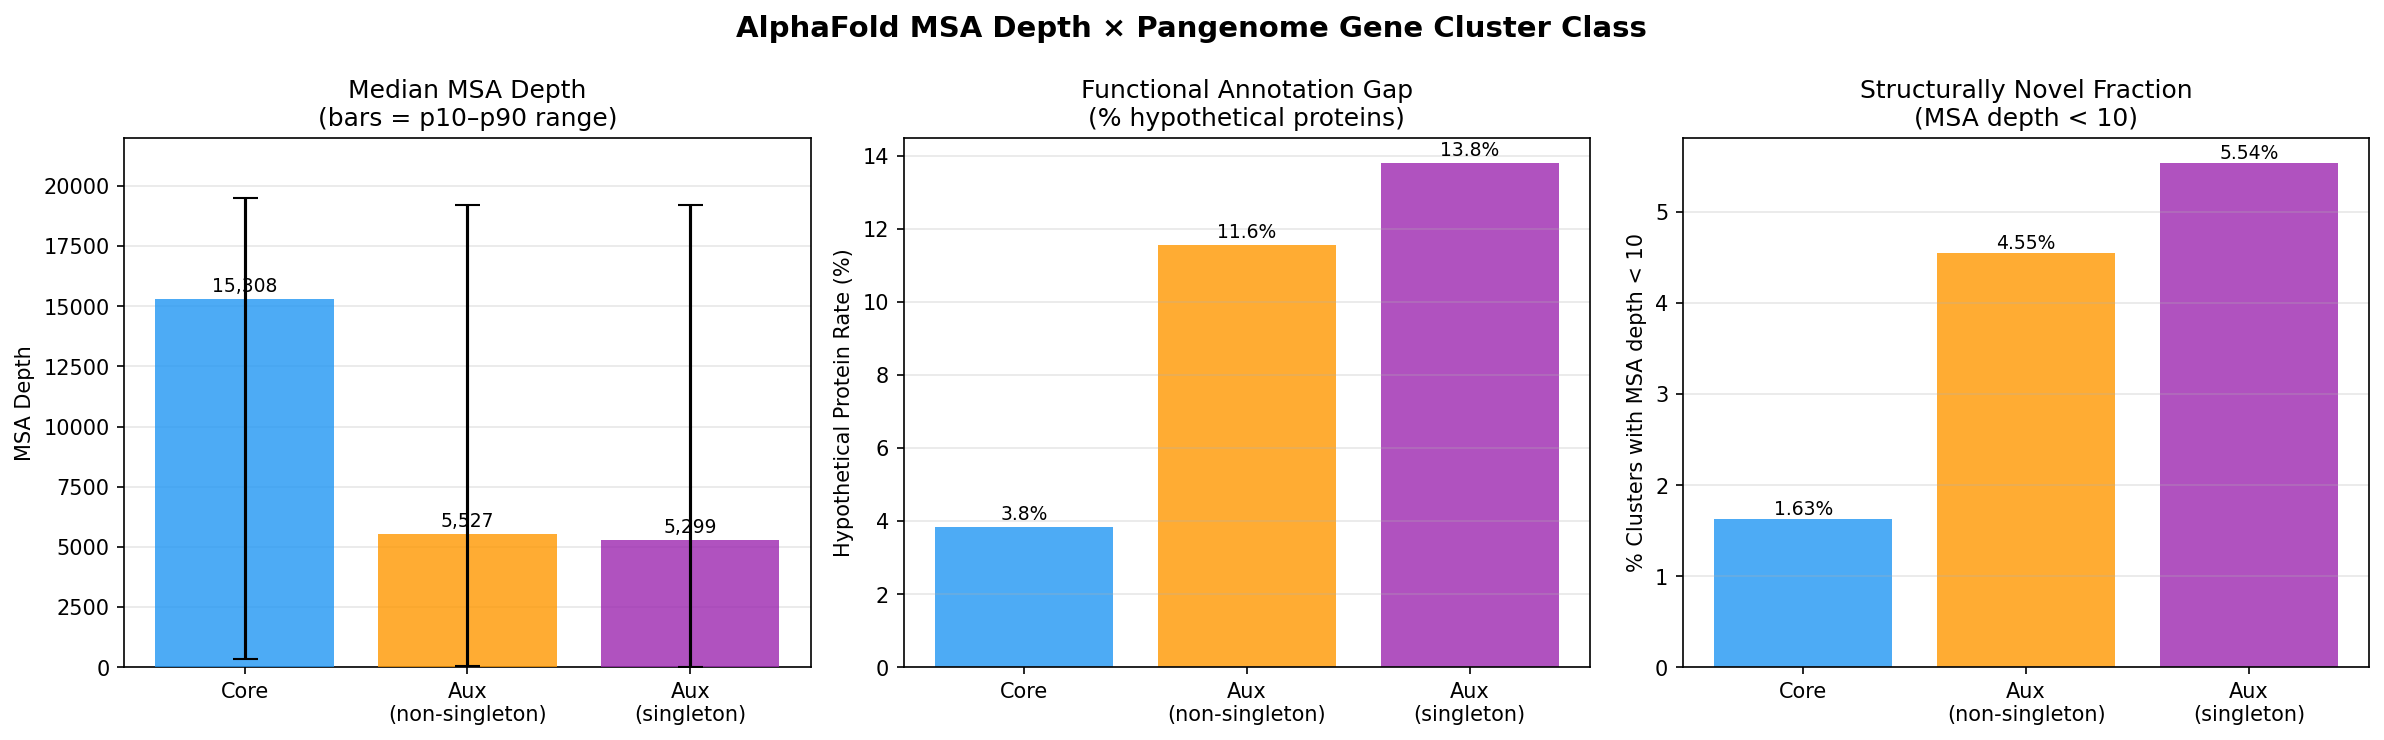 MSA depth by pangenome class, hypothetical rates, and structurally novel fraction. From alphafold_msa_annotation.
The class-level advantage hides a dark core. The analysis found 415,603 distinct core clusters with MSA depth below 10, of which 68.9% were annotated as hypothetical. 4 Fitness data support the separation of conservation from characterization. Essential genes were 82% core, but genes neutral in every experiment were still 66% core. 8,9 These patterns are developed in structural-annotation-gap and core-gene-annotation-paradox.
The literature adds a separate attention layer:
- The organism-level Gini coefficient, an inequality index in which larger values mean greater concentration, was 0.967 2.
- 5,218 multi-member 50%-identity protein families had no literature at all 2.
The PaperBLAST report presents this as research inequality rather than proof of biological inactivity. That framing is the subject of research-attention-inequality. 2
Combining evidence resolves more than any single signal. One study combined five evidence streams 7:
- metabolic-model gapfilling, which adds reactions that restore predicted growth in draft models;
- fitness phenotypes;
- pangenome conservation;
- pathway evidence;
- BLAST sequence-similarity homology.
The combined pipeline assigned candidate genes to 96 of 201 gapfilled enzymatic reaction–organism pairs (47.8%). No individual stream resolved more than 35%, and BLAST alone resolved 70 pairs (34.8%). No convincing candidate was found for the remaining 105 pairs (52.2%) 7.
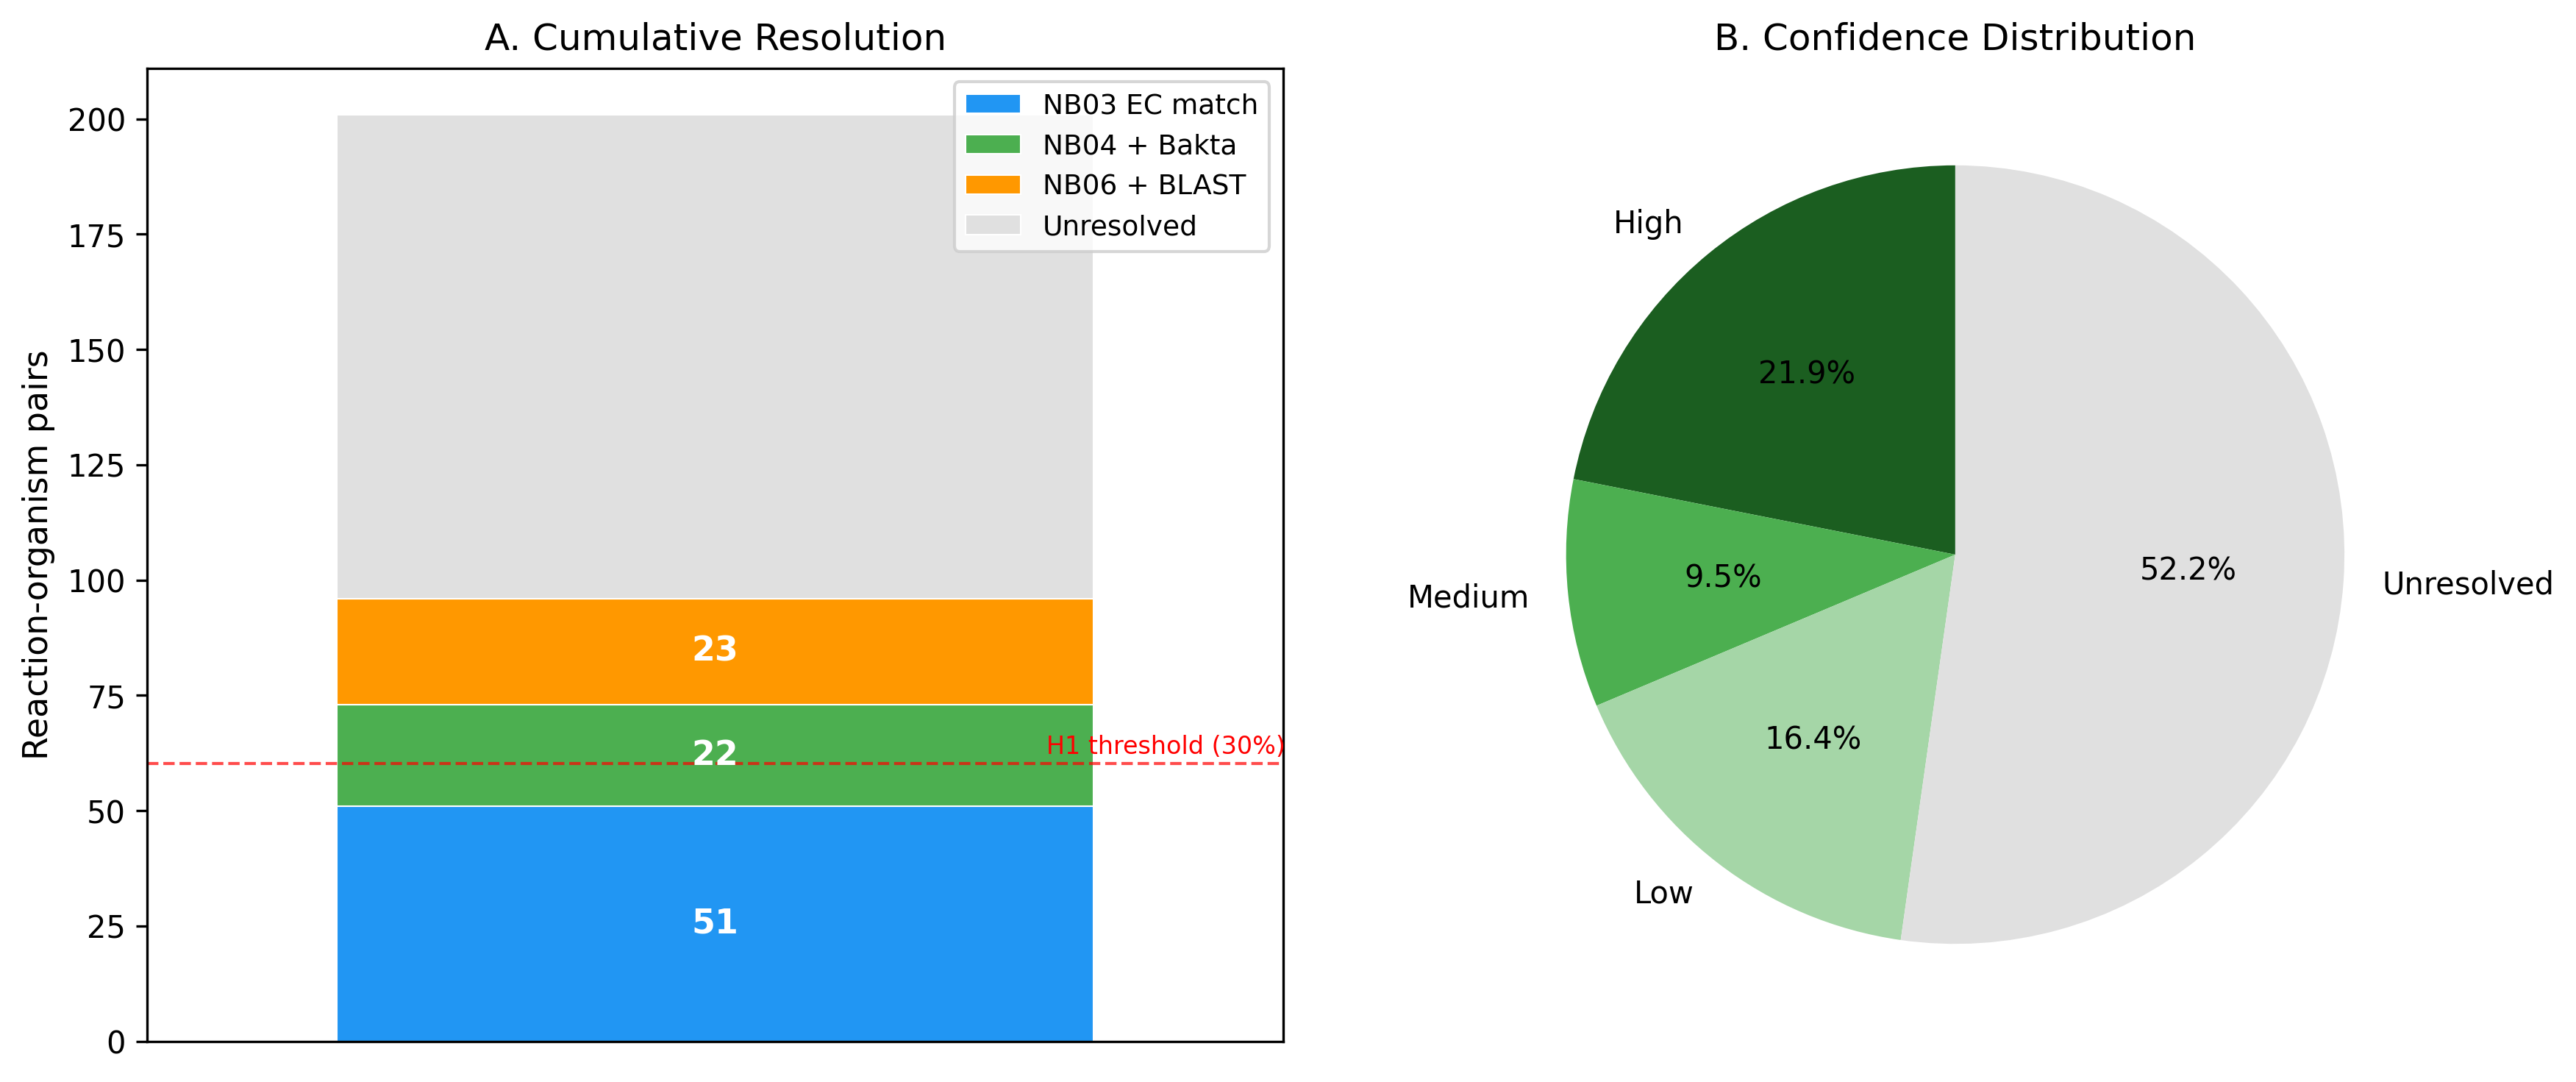 Cumulative resolution and confidence breakdown. From annotation_gap_discovery.
Annotation vocabulary also matters for fitness modules. These are gene sets found by independent component analysis (ICA), which decomposes fitness profiles into independent signals 1. Adding Pfam domains and lowering the overlap threshold to 2 raised module annotation from 92/1,116 (8.2%) to 890/1,116 (79.7%) 3. A held-out benchmark withheld 20% of KEGG-annotated genes and tested how well methods recovered their KEGG ortholog (KO) groups. Ortholog transfer reached 95.8% strict precision, against 29.1% for the domain-based method 10.
Labels, absences and categories are method-dependent. Several audits show the same failure mode:
- Zero hits are not absence. PaperBLAST returned near-zero hits for Caulobacter lipid A genes that NCBI found 11–18 times each. The report characterized this as an approximately 80% false-negative rate 5.
- Empty domain tables are not absence. In a precomputed Bakta Pfam table, 7 of 33 marker Pfams had zero clusters, including all four critical photosystem II Pfams 6. These cases ground homology-search-negative-evidence.
- A passing threshold does not certify a marker. The KO markers used for iron reduction were in fact TMAO (trimethylamine N-oxide) reductase and glycerol ABC (ATP-binding cassette) transporter genes. A corrected multi-heme cytochrome detector found 5/9 anchor_deep genomes positive (55.6%, against 1/9 originally). No corrected cohort comparison was significant (Fisher p ≥ 0.46), and the original shallow-enrichment narrative was withdrawn 11,12. This is the worked case in functional-marker-validation.
- Category schemas can flip conclusions. In an inflammatory-bowel-disease pathway test, regex (regular-expression name-matching) categories gave a degenerate FAIL. On the same data, a MetaCyc class hierarchy supported iron/heme acquisition (odds ratio, OR=8.1; false discovery rate, FDR 7e-6). The report sums this up as “Same data, opposite verdict” 13.
- Multi-label annotations may carry signal. Composite COG assignments such as LV (mobile plus defense) showed +0.34% enrichment in novel or singleton genes, with 76% consistency. The sources read this as signal rather than noise 14,3.
These cases are developed in ontology-and-category-schema-sensitivity and composite-functional-annotation.
From darkness to experiments. Prioritization frameworks turn this evidence into testable hypotheses.
- Functional dark matter ranking. 82 of the top 100 candidates had high-confidence hypotheses supported by at least 3 evidence types. 1 The report proposes targeted RB-TnSeq (random-barcode transposon sequencing) screens and CRISPRi (CRISPR-interference knockdown) designs, but these remain proposals. 1
- Truly dark ranking. This analysis ranked all 6,427 truly dark genes and selected 100 top candidates across 19 organisms. 15 It places 3,867 (60.2%) in a tier that has sequence identifiers only. 15
- Shared focus on Methanococcus. Methanococcus strains recur across the metal-fitness, truly-dark and Route B prioritization schemes. No report links the specific genes, so this is a newly testable convergence rather than a finding. 16,15,1
The prioritization logic is in experimental-prioritization-of-functional-dark-matter.
Tensions and Caveats
Open disputes between sources.
- Composite COG annotations. Confidence in the “not noise” reading exceeds the evidence. That evidence is a single LV enrichment without a separate validation test, plus an exploratory mixed-category KO signal 3,14,6. See conflicts/conflict—composite-functional-annotation—e8b22b58.
- Stress in dark-gene phenotypes. One project reports that stress conditions dominate among strong-phenotype dark genes. Another reports that truly dark genes are depleted in stress relative to annotation-lag genes, which gained non-hypothetical annotations after modern reannotation. Neither normalizes for condition coverage 1,15,5. See conflicts/conflict—experimental-prioritization-of-functional-dark-matter—6247b74c.
- Weight of guilt-by-association evidence. Module and neighborhood evidence covers many dark genes, but part of it is expected by chance, and module evidence predicts specific molecular functions poorly 1,3. See conflicts/conflict—experimental-prioritization-of-functional-dark-matter—9f5d14d3.
- Empty Bakta Pfam tables. Sources offer three unreconciled explanations: query format, a reduced profile set and a hypothetical-only search 17,3,18. Null rates also differ across annotation substrates, and no project establishes biological absence 6,11,19. See conflicts/conflict—homology-search-negative-evidence—11bde588 and conflicts/conflict—homology-search-negative-evidence—8853ea91.
- Schema coverage in the IBD reversal. The digest and the project report give regex and MetaCyc coverage figures with different denominators 3,13. See conflicts/conflict—ontology-and-category-schema-sensitivity—3d6cb564.
- Fitness values behind the ManX correction. Both sources say fitness contradicts a curated ManX annotation, but they give different per-substrate values 3,20. See conflicts/conflict—evidence-triangulation-for-functional-annotation—aeea25a2.
- Meaning of the “SR” label. One project’s “SR” signal has been read as sulfite reduction, while the other project calls it sulfate reduction 11,12. See conflicts/conflict—functional-marker-validation—f3deb934.
- Literature-free families. It is unresolved whether these families are unstudied or were missed by retrieval. The report notes that its conclusions are limited by the collection’s literature-retrieval process 2. See conflicts/conflict—research-attention-inequality—9d0916a3.
Load-bearing limitations.
- AlphaFold bridge coverage. Only 28.7% of gene clusters bridged to AlphaFold MSA depths, and the bridged subset is biased toward better-studied organisms. The report states the bridged fraction inconsistently, as 28.7% and 29.3%. 4
- Gapfilling counts. The breakdown of gapfilled reactions does not sum to the stated total of 219. 7
- PaperBLAST false-negative rates. The Caulobacter report gives ~50% and ~80% false-negative rates for differently described gene sets and does not reconcile them. 5
- Truly dark list completeness. The ranked truly dark list covers ~69% of the estimated truly dark population. This figure is extrapolated, not counted. 15
Where to Go Deeper
- evidence-triangulation-for-functional-annotation — read first for how combined evidence streams outperform single signals.
- structural-annotation-gap — MSA depth, pipeline coverage and literature as separate annotation layers.
- core-gene-annotation-paradox — why conserved core genes can still be dark.
- experimental-prioritization-of-functional-dark-matter — how dark genes are ranked for RB-TnSeq and CRISPRi follow-up.
- homology-search-negative-evidence — when a zero-hit search can and cannot support absence.
- functional-marker-validation — the iron-reduction marker correction as a worked example.
- ontology-and-category-schema-sensitivity — schema-driven verdict reversals.
- research-attention-inequality and composite-functional-annotation — literature concentration and multi-label annotations.
Key entities: bakta, eggnog, kescience-fitnessbrowser, kbase-ke-pangenome, independent-component-analysis, gapmind.
Key reports: Functional Dark Matter — Experimentally Prioritized Novel Genetic Systems, Truly Dark Genes — What Remains Unknown After Modern Annotation?, AlphaFold MSA Depth as a Lens on the Bacterial Annotation Gap, Annotation-Gap Discovery via Phenotype-Fitness-Pangenome-Gapfilling Integration, PaperBLAST Data Explorer — Literature Coverage Bias in Protein Sequence Space, Regulatory and proteomic architecture of Δfur-permitted lipid A loss in *Caulobacter crescentus*.