Raw report: paperblast_explorer Feeds into: cross-tenant-data-bridging, evidence-triangulation-for-functional-annotation, experimental-prioritization-of-functional-dark-matter, gene-function-acquisition-depth, homology-search-negative-evidence, provenance-aware-resource-discovery, research-attention-inequality, structural-annotation-gap
Overview
This analysis characterizes the KBase Data Lakehouse kescience_paperblast collection, which contains 12.4 million rows across 14 tables linking protein sequences and genes to literature, curated annotations, structural data, and snippets from PubMed Central full-text articles. It combines database inventory, organism- and gene-level coverage analysis, Lorenz inequality curves, and MMseqs2 sequence clustering to quantify research concentration and identify poorly studied protein families. 1
Key Findings
Literature is concentrated in a small number of organisms
Homo sapiens accounts for 46.7% of all gene-paper records in PaperBLAST. The top five organisms—H. sapiens, M. musculus, R. norvegicus, A. thaliana, and D. melanogaster—account for 72.8%. Of 20,723 organisms with any literature, the top 1,000 capture 94.2%, leaving the remaining 19,723 organisms with 5.8% of the literature. 1
Gene-level literature coverage is highly skewed
Of 841K genes with any text-mined paper link, 551K (65.6%) have exactly one paper. The median is 1 paper per gene and the mean is 3.8. The 50 most-referenced genes are all human; the leading examples are p53 with 9,988 papers, TNF with 6,002, and EGFR with 5,895. Only 6% of genes (50K) account for 57.7% of all gene-paper links. 1
Lorenz curves show extreme inequality
The organism-level Gini coefficient is 0.967, while the gene-level Gini coefficient is 0.669; these values indicate near-total concentration of organism literature and very high concentration of gene literature, respectively. 1
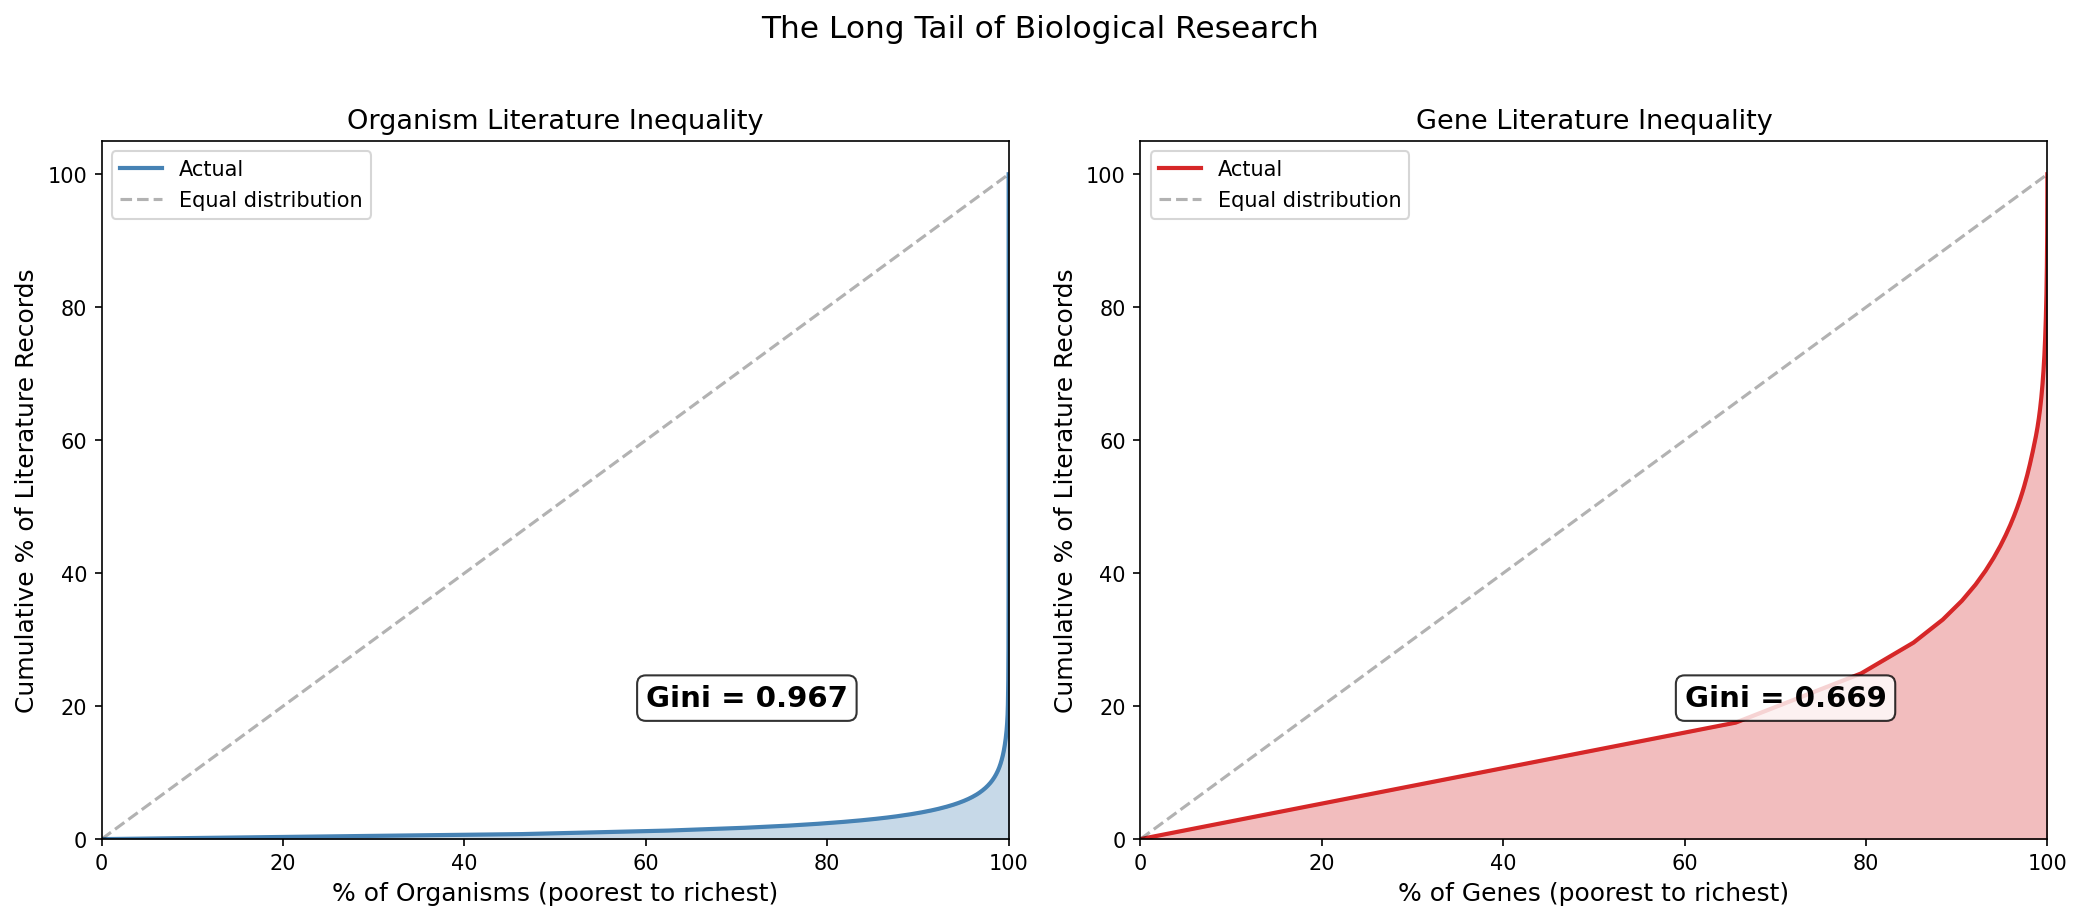 Lorenz inequality curves for organisms and genes. From paperblast_explorer.
Bacterial literature favors pathogens and model organisms
Among 15,312 bacterial organisms, the top 100 capture 44.3% of bacterial literature. The three leading bacteria are Mycobacterium tuberculosis H37Rv with 9,079 papers, Escherichia coli K-12 with 8,860, and Pseudomonas aeruginosa PAO1 with 5,928. The report finds environmental and non-pathogenic organisms dramatically underrepresented. The bacterial-literature analysis counts 15,312 bacterial organisms, whereas the report’s domain table lists 5,997 Bacteria organisms. The report does not explain why the populations or classifications differ, so the two counts are an unreconciled internal discrepancy. 1
Sequence clustering reduces the collection to protein families and superfamilies
Clustering 815,571 PaperBLAST protein sequences with MMseqs2 produced 628K clusters at 90% identity, 345K clusters at 50% identity, and 215K clusters at 30% identity. These correspond respectively to low strain-level redundancy, a protein-family scale, and a superfamily scale. The largest 50%-identity families include HSP70/BiP with 650 members, GAPDH with 609, enolase with 552, and GroEL with 443. 1
At 90% identity, 83.3% of clusters are singletons; at 50%, 67.5% are singletons; and at 30%, 62.8% are singletons. The largest 90%-identity cluster is actin with 212 members. 1
More than half of protein families are dark or dimly studied
At 50% identity, 9.2% of protein families (31,653) have zero papers across all members, and 46.1% (159,046) have exactly one paper. Only 4.3% (14,904) have 20 or more papers. In total, 5,218 multi-member families representing 14,534 sequences have no literature whatsoever. The report describes these as dark protein families. 1
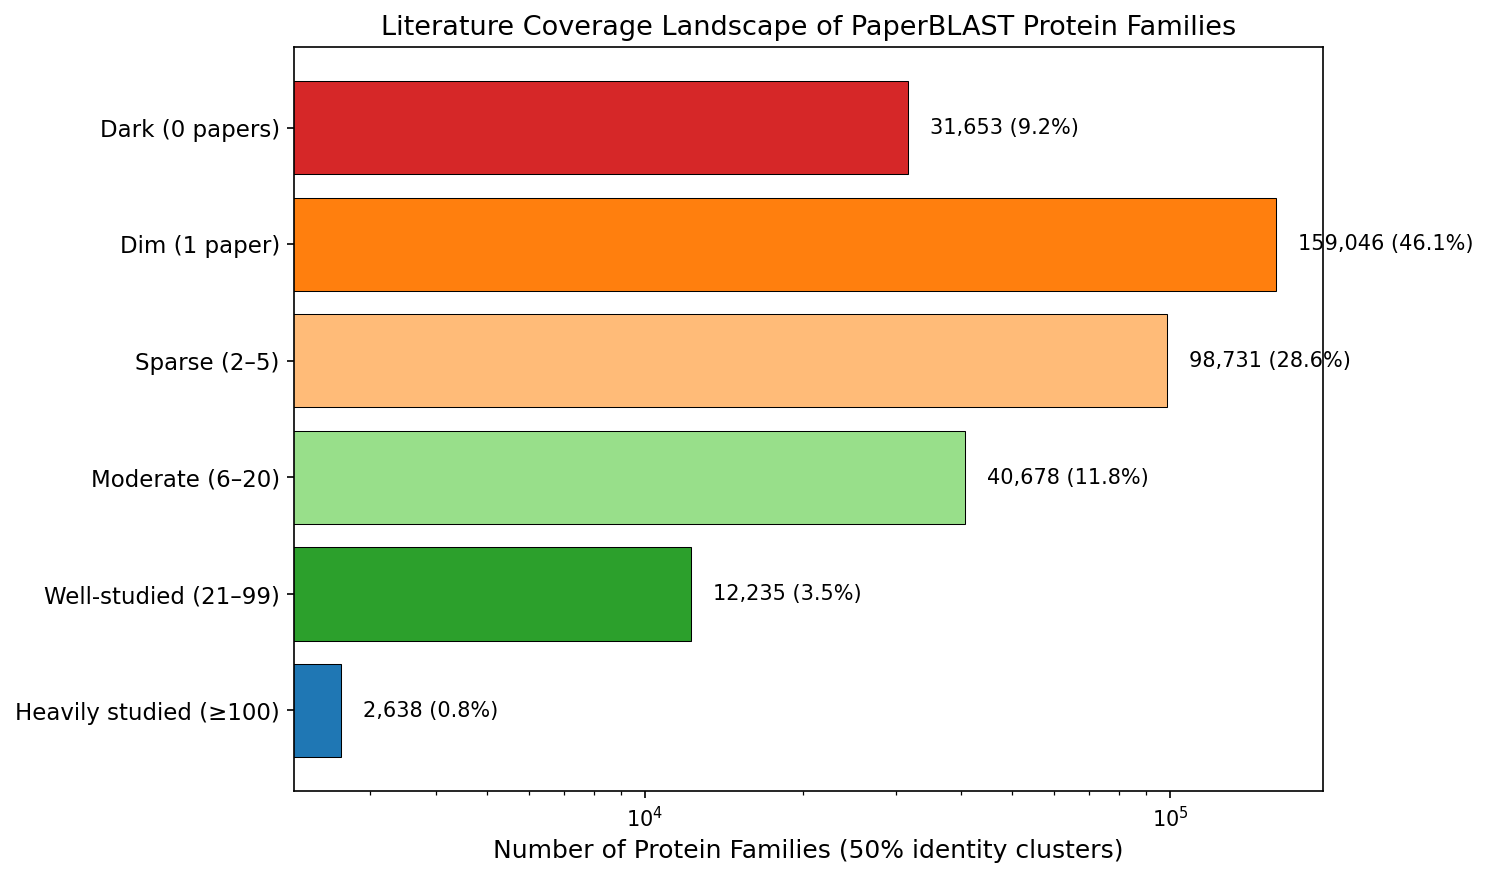 Literature coverage landscape of protein families. From paperblast_explorer.
Family size is positively associated with literature coverage, although the report states only the direction of this relationship and gives no effect size for it. Separately, 95.4% of multi-member 50%-identity clusters have at least one member with a paper, while the remaining 4.6%—5,218 families—have none. The dark families are dominated by REBASE methyltransferases and biolip structural entries, which the report characterizes as specialized proteins lacking published functional studies. 1
Database Scale and Coverage
The collection contains 12.4 million rows across 14 tables. Its core structure links genes to papers by text mining PubMed Central full-text articles, supplemented by curated annotations from 13 databases and by structural data from the PDB. Its largest listed tables are genepaper with 3,195,890 gene-to-paper links, site with 2,089,192 PDB binding, active, and modified-site records, snippet with 1,951,949 text excerpts, generif with 1,358,798 GeneRIF functional summaries, gene with 1,135,366 gene/protein records, uniq with 815,571 unique protein sequences, curatedpaper with 599,587 curated gene-paper links, and curatedgene with 255,096 curated annotations. 1
The database covers papers from 1951 to 2026. Publications peak around 2020–2021, 30.6% of records are from 2020 onwards, the 2025 data includes 125,438 records from 22,271 papers, and 1,425 records from 2026 are present, indicating an early-2026 snapshot. 1
The 1.1M genes span 27,718 organisms across all domains of life. Bacteria account for 5,997 organisms and 397,544 genes (35.0% of genes); Unknown classifications account for 14,798 organisms and 397,511 genes (35.0%); Eukarya account for 822 organisms and 290,537 genes (25.6%); viruses account for 5,730 organisms and 27,199 genes (2.4%); and Archaea account for 371 organisms and 22,575 genes (2.0%). The table’s percentages are explicitly percentages of genes. The report’s prose says that Bacteria dominate by organism count (6,000) and that Eukarya dominate by gene count (291K). Both rankings conflict with its own domain table, where Unknown lists more organisms than Bacteria and Bacteria lists more genes than Eukarya. 1
The report describes 845K genes linked to 1.1M unique papers through 3.2M many-to-many associations; each gene averages 3.8 papers and each paper mentions 2.9 genes. This 845K linked-gene count differs from the 841K genes with any text-mined paper link that the report gives earlier, and the report does not reconcile the two. It also reports that 25.6% of genes in the gene table (290K) have no text-mined paper link and rely solely on curated or GeneRIF annotations. 1
SwissProt is the largest curated contributor, with 110,171 proteins and 181,916 unique papers, while biolip contributes 42,571 proteins and 23,768 papers, BRENDA 33,012 proteins and 43,760 papers, MetaCyc 12,700 proteins and 46,176 papers, and EcoCyc 4,198 proteins and 22,304 papers. Their reported papers-per-protein values are respectively 1.7, 0.6, 1.3, 3.6, and 5.3. The report states that PaperBLAST includes approximately 19% of the full SwissProt database, estimated there as approximately 570K reviewed entries as of 2024. 1
PaperBLAST includes site annotations for 132,179 PDB structures and 2.1M site records across binding (1.69M), functional (182K), modified (112K), and mutagenesis (104K) types. It contains 48,991 unique ligands; the most frequent listed ligands are zinc ions with 65K sites, chlorophyll A with 58K, calcium ions with 53K, and heme with 44K. 1
A cross-database linkage analysis identified 129,823 VIMSS cross-references connecting PaperBLAST to the Fitness Browser, providing a route from literature coverage to experimental fitness phenotypes. 1
Interpretation and Contribution
The report interprets the concentration of research on a small number of genes and organisms as consistent with a self-reinforcing “rich-get-richer” dynamic previously described for gene attention. It connects the protein-family results to the dark proteome and functional unknomics, extending the literature-coverage perspective to 5,218 multi-member protein families with zero coverage at 50% identity. 1
The rich-get-richer framing draws on Stoeger et al. (2018). The report cites them as showing that the most-studied human genes continue to attract the most new research, and that gene attention can be predicted from a small set of chemical, physical and biological properties, so the bias is systematic rather than random. This is external context, not a measurement from this analysis. 1
The dark-proteome comparison cites Perdigao et al. (2015), who estimated that approximately 40% of protein residues fall in dark regions with no structural or functional information. The report states that its finding that 55% of protein families at 50% identity have 0 or 1 papers extends this observation to the literature domain. The two figures have different denominators and definitions: one counts residues lacking structural or functional information, the other counts 50%-identity families with 0 or 1 papers. They are therefore not directly comparable. The report also cites Rocha et al. (2023), who coined the term “functional unknomics” for the systematic study of conserved genes of unknown function, as further external context. 1
PaperBLAST itself was created by Price & Arkin (2017; “PaperBLAST: Text Mining Papers for Information about Homologs,” mSystems 2:e00039-17; PMID: 28845461) to connect protein sequences to relevant literature. Their later Curated BLAST for Genomes (2019; mSystems 4:e00072-19; PMID: 31164459) and their interactive tools for functional annotation (2024) further developed the use of literature text mining for gene function discovery. The report also cites the 2018 KBase publication by Arkin, Cottingham, Henry et al. (Nat Biotechnol 36:566-569; PMID: 29979655). 1
The novel contribution is a collection-level and protein-family-level characterization of the KBase Data Lakehouse-hosted PaperBLAST resource, including Lorenz analyses, per-domain coverage, sequence clustering, and presentation-ready figures quantifying the research coverage gap. 1
Proposed Follow-up
The report proposes two analyses but reports no results from either. The first applies AlphaFold structure prediction and domain annotation to the 5,218 dark protein families to infer functions, which would remain explicitly putative. The second builds a gene–gene co-citation network from the genepaper data to identify gene clusters that are functionally related but studied to different degrees. 1
Generated Data and Figures
The generated data files list 840,982 genes in data/papers_per_gene.csv. They give exact cluster counts of 628,441 at 90% identity, 344,981 at 50% identity (also the row count of data/cluster_literature_50pct.csv) and 214,534 at 30% identity. These refine the rounded 841K, 628K, 345K and 215K counts in the report prose. 1
year_distribution.png: publication-year distribution (1990–2026). 1domain_distribution.png: organisms and genes by domain of life. 1papers_per_gene.png: papers-per-gene histogram (log scale). 1organism_coverage_skew.png: cumulative organism coverage curve plus a top-20 bar chart. 1gene_coverage_skew.png: gene Lorenz curve plus papers-per-gene bins. 1lorenz_curves.png: side-by-side Lorenz inequality curves for organisms and genes. 1top20_bacteria.png: top 20 bacteria by paper count, with cumulative percentage. 1cluster_size_distributions.png: MMseqs2 cluster-size histograms at 90%, 50% and 30% identity. 1cluster_cumulative_capture.png: cumulative sequence capture by cluster rank. 1cluster_vs_literature.png: cluster size versus literature coverage. 1sequence_space_reduction.png: sequence-space reduction bar chart. 1literature_coverage_landscape.png: breakdown of dark, dim, sparse and well-studied families. 1
Caveats
- Text mining is not equivalent to functional characterization: a gene mentioned in a paper may be tangential to the study, and the 65.6% of genes with one paper may include incidental mentions. 1
- PaperBLAST mines PubMed Central full-text articles, so papers behind paywalls are missed; this creates systematic bias against fields and journals with lower open-access rates. 1
- Domain classification is approximate. The report states that heuristic organism-to-domain mapping classified 35% of organisms as Unknown, but this conflicts with its domain table. There, Unknown holds 14,798 of 27,718 organisms, and 35.0% is the share of genes, not organisms, classified Unknown. The report proposes a formal taxonomy lookup to improve accuracy. 1
- Clustering identity thresholds are arbitrary: the 50% identity cutoff used for “protein family” is conventional and does not represent a universal biological boundary. 1
- SwissProt coverage is partial: only 19% of SwissProt is in PaperBLAST, likely because many entries lack matching PMC full-text; curated knowledge therefore exists for proteins that PaperBLAST cannot connect to. 1
- The analysis has no negative controls and cannot easily distinguish genuinely unstudied genes from genes whose literature was missed by text mining. 1
Slots Into
- gene-function-acquisition-depth — The organism-, gene-, and protein-family coverage distributions quantify how unevenly functional knowledge is acquired and identify dark protein families for follow-up. 1
- provenance-aware-resource-discovery — The collection inventory, table-level provenance, sequence-clustering outputs, and explicit PMC/open-access limitations characterize how resource construction shapes discoverability. 1
- cross-tenant-data-bridging — The 129,823 VIMSS cross-references provide a concrete bridge between PaperBLAST literature coverage and Fitness Browser phenotypes. 1
- research-attention-inequality — The Gini coefficients of 0.967 for organisms and 0.669 for genes, the 46.7% Homo sapiens share and the single-paper skew directly measure research-attention concentration. The PMC-only, text-mining and no-negative-control caveats bound how far these numbers can be read. 1
- structural-annotation-gap — MMseqs2 clustering at 90%, 50% and 30% identity maps the sequence space. At the 50% identity family threshold specifically, 5,218 multi-member families are dark, dominated by REBASE methyltransferases and biolip structural entries. The 50% family cutoff is conventional, not a biological boundary. 1
- experimental-prioritization-of-functional-dark-matter — The 129,823 VIMSS cross-references to the Fitness Browser offer a route to functionally important but understudied genes. 1
- evidence-triangulation-for-functional-annotation — The proposed AlphaFold plus domain-annotation inference for dark families would yield only putative functions. 1
- homology-search-negative-evidence — With no negative controls, the analysis cannot easily distinguish genuinely unstudied genes from genes whose literature text mining missed. 1