Raw report: webofmicrobes_explorer Feeds into: cross-cohort-microbiome-portability, cross-condition-metabolic-comparability, cross-tenant-data-bridging, data-landscape-ownership-and-coverage-bias, gene-essentiality, metabolic-model-gapfilling, multi-omics-integration, occurrence-versus-catabolic-activity, pangenome-integration, pangenome-openness-determinants, provenance-aware-resource-discovery, taxonomic-nomenclature-reconciliation
Overview
This project characterized a 2018 snapshot of the Web of Microbes (WoM) exometabolomics database in the KBase Data Lakehouse. It also assessed links from that snapshot to the Fitness Browser, ModelSEED, GapMind, and pangenome resources. WoM action codes distinguish metabolite amplification from de novo emergence. Cross-collection links support metabolite-to-gene analyses, but absent consumption data, ambiguous compound matching, and a small organism set limit them. Several counts in the report are internally inconsistent, and these are flagged below. 1
Key Findings
Action encoding distinguishes amplification from emergence
WoM encodes metabolite observations with a 4-action system whose meanings differ between control and organism entries. For the control, “The Environment,” D means detected in the starting medium (742 observations) and N means not detected (1,023). For organisms, I means increased (present in the medium and subsequently higher; 1,338), E means emerged (absent from the medium and newly detected, indicating de novo production; 1,155), and N means no significant change (7,509). N therefore has different meanings for the control and for organisms. The report states that E and I are mutually exclusive, with zero overlap across all 10,744 observations. The action counts displayed in the same table, however, do not total 10,744, so that denominator is unexplained. In the report’s reading, I represents amplification of existing metabolites and E represents novel biosynthetic output. 1
No organism has a “Decreased” (consumption) action in this 2018 snapshot. All 742 D observations belong exclusively to the control. Kosina et al. (2018) introduced WoM with the same data and describes “decrease” as a valid action. Consumption is therefore part of the WoM schema but absent from this specific export. The report suggests that consumption data may exist in the newer GNPS2 version, but this was not verified. 1
Fitness Browser strain overlap
WoM has two direct Fitness Browser strain matches and two further same-strain or genus-only matches:
- Pseudomonas sp. FW300-N2E3 matches
pseudo3_N2E3directly (5,854 genes, 211 experiments). - Pseudomonas sp. GW456-L13 matches
pseudo13_GW456_L13directly (5,243 genes, 106 experiments). - E. coli BW25113 matches
Keioas the same strain (4,610 genes, 168 experiments). - Synechococcus PCC7002 matches
SynE(PCC 7942) at genus level only (2,722 genes, 129 experiments). 1
The two direct Pseudomonas matches are ENIGMA groundwater isolates with rich Fitness Browser data. Keio is the same E. coli strain, but its WoM data are limited to 12 observations in ZMMG medium with a sulfur-metabolism focus only. 1
Metabolite production connects to fitness experiments
For pseudo3_N2E3, the report states that curated matching identified 19 metabolites that the organism produces (WoM) and that the Fitness Browser tests as carbon or nitrogen sources. The accompanying table lists these metabolites:
- alanine (
I; L-Alanine and D-Alanine, carbon/nitrogen) - arginine (
I; L-Arginine, nitrogen) - glycine (
I; Glycine, nitrogen) - lactate (
E; Sodium D-Lactate, carbon) - proline (
I; L-Proline, carbon) - phenylalanine (
I; L-Phenylalanine, carbon) - tryptophan (
I; L-Tryptophan, nitrogen) - valine (
E; L-Valine, carbon) - lysine (
E; L-Lysine, nitrogen) - threonine (
I; L-Threonine, nitrogen) - trehalose (
I; D-Trehalose dihydrate, carbon) - adenine (
I; Adenine hydrochloride, nitrogen) - adenosine (
I; Adenosine, nitrogen) - inosine (
I; Inosine, nitrogen) - thymine (
E; Thymine, nitrogen) - malate (
I; L-Malic acid, carbon) - nicotinamide (
I; Nicotinamide, no Fitness Browser carbon/nitrogen type specified) - carnitine (
E; Carnitine hydrochloride, no Fitness Browser carbon/nitrogen type specified) 1
This visible list has fewer rows than the stated 19 matches. Two of its rows also lack a carbon or nitrogen source type, so the displayed table does not fully support the stated match count. 1
The report states that, of the 19 matches, 5 are de novo products (E) and 14 are amplified metabolites (I). That split cannot be reconciled with the shorter visible table. The bridge enables questions such as which genes are fitness-important for lactate utilization in the Fitness Browser, given that Pseudomonas FW300-N2E3 produces lactate de novo (WoM action E). That analysis was proposed, not performed, in this project. 1
ModelSEED compound-link quality
Of 257 identified, non-unknown WoM compounds, 69 (26.8%) have definitive ModelSEED links through exact name matching. A further 107 compounds (41.6%) have formula-only matches, giving 176 compounds with any link (68.5%). The remaining 81 (31.5%) are unmatched. 1
Formula matching is inherently ambiguous. The 107 formula-matched WoM compounds map to 900 ModelSEED molecules, an average expansion of 1:8.4. For example, C5H11NO2 matches valine, norvaline, betaine, 5-aminopentanoate, and others. The report treats exact name matches as high-confidence 1:1 mappings. It treats formula-only matches as low-confidence candidate sets for manual curation, not definitive identifications. 1
ENIGMA metabolic novelty rates
The report states that the fraction of metabolite changes representing de novo production (E) rather than amplification (I) varies 2-fold across ENIGMA isolates in R2A medium. The reported counts and novelty rates are shown below. 1
| Isolate 1 | Increased (I) | Emerged (E) | Reported novelty rate |
|---|---|---|---|
| Pseudomonas GW456-L13 | 49 | 34 | 32.4% |
| Pseudomonas FW507-14TSA | 44 | 33 | 31.4% |
| Pseudomonas FW300-N2A2 | 26 | 32 | 30.5% |
| Acidovorax GW101-3E06 | 48 | 30 | 28.6% |
| Bacillus FW507-8R2A | 39 | 16 | 15.2% |
The displayed percentages do not equal E/(E+I) for the listed counts, so the denominator behind the reported rates is unclear. 1
The report’s figure figures/enigma_metabolite_heatmap.png is a heatmap of 10 ENIGMA isolate metabolite profiles in R2A medium. It shows Increased actions in blue and Emerged actions in red. 1
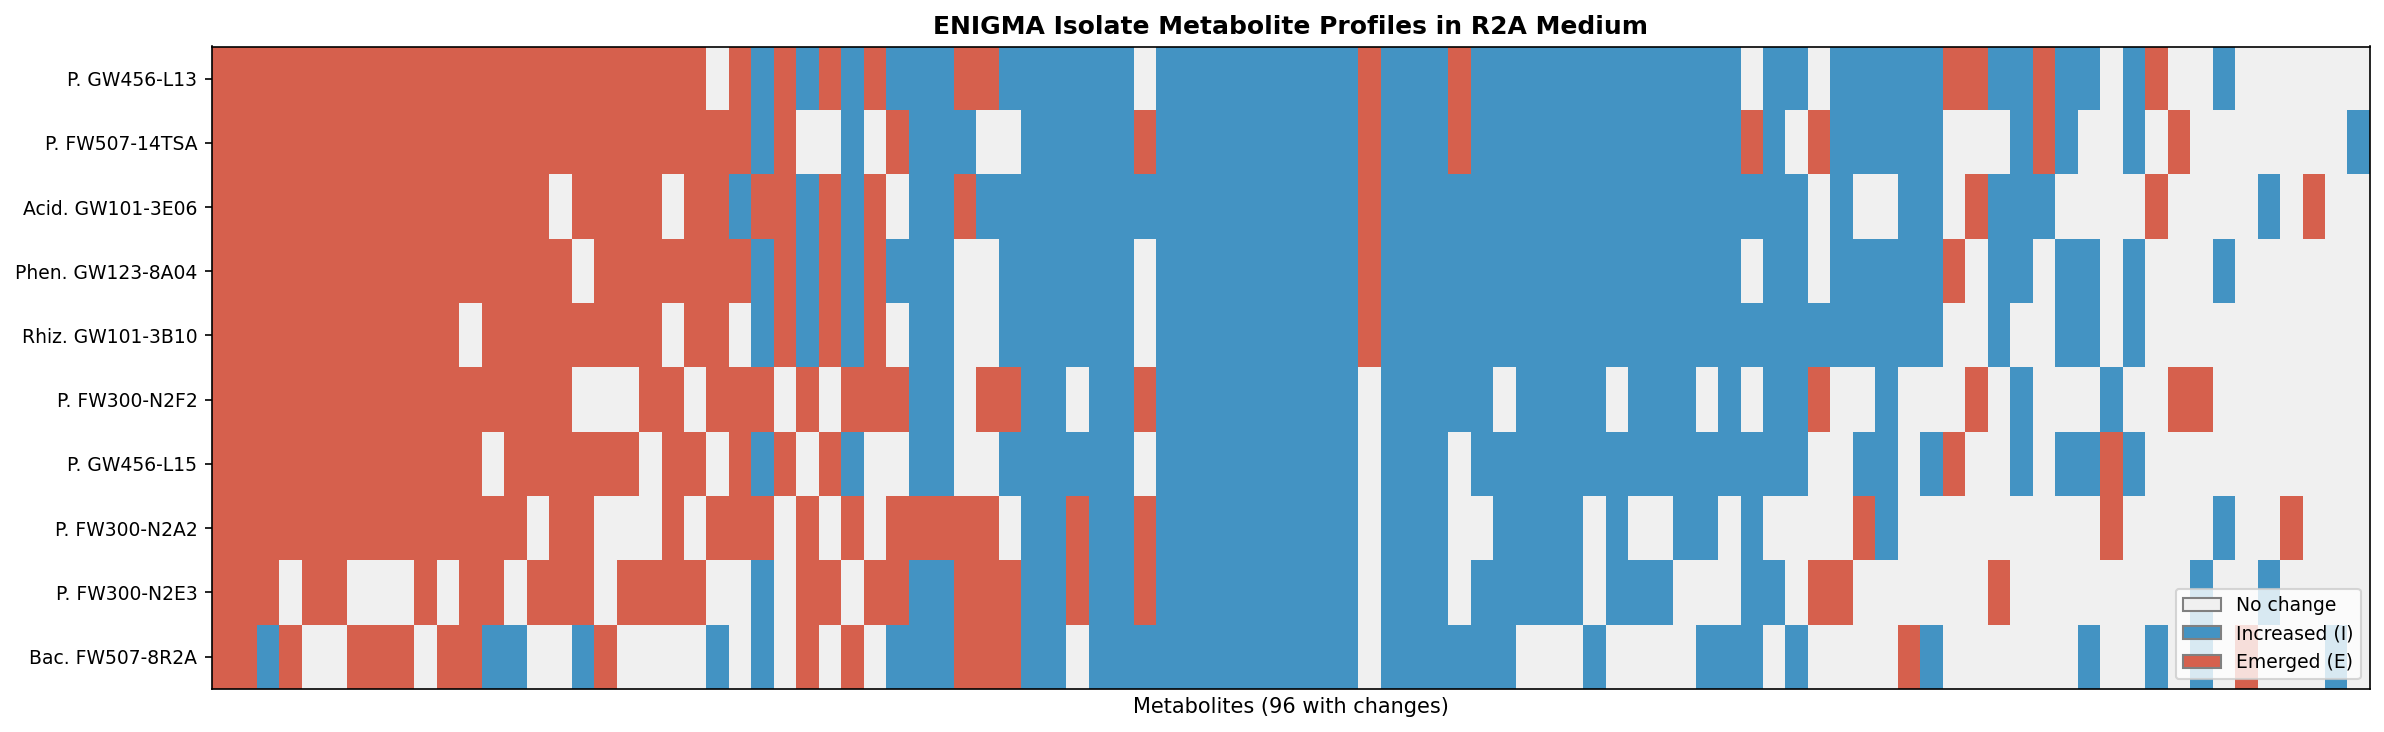 ENIGMA isolate metabolite profiles in R2A medium. From webofmicrobes_explorer.
GW456-L13 is reported to produce the most novel metabolites (32.4%) and FW507-8R2A the fewest (15.2%). The report proposes this “metabolic novelty rate” as a potential phenotype for cross-referencing with pangenome gene content. Its future-work section frames the test explicitly: do organisms with higher E/(E+I) ratios have more open pangenomes or more accessory genes? That association is untested. Stating the ratio explicitly also shows that the reported percentages have an unclear denominator. 1
Pangenome representation
All WoM genera have pangenome species clades. The report lists “Pangenome Species (top 5)” counts and total genomes for each taxon. 1
| Taxon 1 | Species clades (top 5) | Total genomes | |---|---|---| | Bacillus | 5 | 2,557 | | Rhizobium | 5 | 449 | | Pseudomonas fluorescens | 5 | 139 | | Synechococcus | 5 | 88 | | Phenylobacterium | 5 | 80 | | Acidovorax | 5 | 79 | | Zymomonas mobilis | 1 | 26 | | Escherichia coli | 1 | 2 |
The top-5 qualifier caps the displayed species-clade counts, so they are not exhaustive totals. 1
Pangenome context, including gene clusters, conservation, and functional annotations, is available at genus level for all WoM organism genera. This enables future analyses linking genome content to metabolite output. Species-level matching requires strain-to-genome mapping, which this project did not attempt, so no strain-level links are established. 1
Database scale and collection coverage
The 2018 WoM snapshot contains 37 organisms across 5 ENIGMA-funded projects:
- 6 biocrust isolates, with 5,604 observations in BG11 media (the largest data block)
- 10 ENIGMA groundwater isolates, with 1,050 observations in R2A medium
- 4 other isolates: E. coli, Zymomonas, Synechococcus, and Microcoleus
- 10 triculture time-series entries
- 2 native microbiome entries
- 4 theoretical auxotroph predictions
- 1 control 1
The database tracks 589 metabolites, of which 332 (56.4%) are unidentified and carry an Unk_ prefix. The report then states, “Of the 257 identified metabolites, 408 (69.3% of all 589) show at least one change.” This is internally inconsistent, because 408 exceeds the 257 identified metabolites, so the number of changed metabolites and its denominator remain unresolved. The most metabolically active compounds are amino acids, including glutamine, proline, and phenylalanine, and nucleotides, including adenine, adenosine, and guanine. 1
Cross-collection integration assessment
The report judges its cross-collection integration hypothesis (H1) partially supported. It finds the links real and actionable but limited:
- Fitness Browser: strong for 3 organisms. The two Pseudomonas strains each have more than 5,000 genes and more than 100 experiments, and Fitness Browser conditions directly test metabolites that WoM detects as produced.
- ModelSEED: moderate. Of identified metabolites, 26.8% have definitive name-based links and 41.6% have ambiguous formula-only links.
- GapMind: blocked by a naming-convention mismatch. GapMind pathway names are internal identifiers that do not contain simple metabolite names, so a lookup table mapping pathways to substrate/product metabolites is needed.
- Pangenome: available at genus level for all WoM organisms, while species-level matching remains incomplete. 1
The analysis drew on four collections:
kescience_webofmicrobes(tablescompound,environment,organism,project,observation), for exometabolomics production/excretion profileskescience_fitnessbrowser(organism,gene,experiment), for organism overlap and condition matchingkbase_msd_biochemistry(molecule), for compound name/formula matchingkbase_ke_pangenome(pangenome,gapmind_pathways), for species clade counts and pathway predictions 1
The generated files have these row counts: data/wom_organisms.csv, 37; data/wom_compounds.csv, 589; data/wom_environments.csv, 10; data/wom_projects.csv, 5; data/fb_overlap.csv (direct strain matches), 2; data/modelseed_name_matches.csv, 75; and data/modelseed_formula_matches.csv, 900. The 75 exact-name match rows should not be conflated with the 69 distinct compounds that have definitive name-based links. 1
Caveats and Future Directions
The report identifies the absence of consumption data as the fundamental limitation. The snapshot records what organisms produce but not what they consume, which prevents testing whether consumed metabolites predict gene essentiality. The data are also small, with 37 organisms (20 experimental) across 5 projects from a single laboratory. The report says this is too few for statistical analyses across organism groups. 1
The snapshot is frozen in 2018 and was accessed through the Wayback Machine, so it may not reflect the current state of WoM. In its literature context, the report cites de Raad et al. (2022). That study developed the Northen Lab Defined Medium (NLDM), which supports growth of 108/110 phylogenetically diverse soil bacteria, with all metabolites trackable via LC-MS/MS (liquid chromatography–tandem mass spectrometry). The report states that this dataset “likely contains consumption data” and “may be available” in the current GNPS2 version of WoM. It suggests that the GNPS2-hosted version or Northen laboratory datasets would be substantially richer, but these were not analyzed. 1
The report’s future-directions section makes a stronger claim than its literature context. It states that the NLDM study tested 110 soil bacteria with full consumption and production tracking. It also states that ingesting that dataset would resolve the no-consumption limitation and increase the organism count 3–5×. This projection is conditional: neither ingestion nor the increase occurred in this project. 1
GapMind pathway matching failed because pathway names did not contain simple metabolite names, so a dedicated pathway-to-metabolite mapping table is needed. WoM coverage of E. coli BW25113 is especially limited despite the richness of its Keio Fitness Browser data, with only 12 WoM observations focused on sulfur and cysteine. 1
The report proposes five next steps:
- Obtain the current WoM dataset from GNPS2 or the Northen laboratory.
- Build a GapMind pathway-to-metabolite lookup table.
- For
pseudo3_N2E3andpseudo13_GW456_L13, identify which genes are fitness-important on carbon sources that the same organism produces, to test whether metabolic output predicts gene essentiality. - Test whether higher
E/(E+I)ratios associate with more open pangenomes or more accessory genes. - Re-ingest WoM when consumption data become available. 1
These are future work, not demonstrated results. 1
Slots Into
- cross-tenant-data-bridging — WoM links metabolite observations to Fitness Browser, ModelSEED, GapMind, and pangenome collections. This demonstrates actionable cross-collection integration (H1 partially supported), along with its naming, matching, and coverage barriers.
- cross-condition-metabolic-comparability — The action encoding, the 19-match claim set against a shorter visible table, ambiguous formula matches, and novelty rates with an unclear denominator all show how metabolite-level comparisons depend on encoding and denominators.
- occurrence-versus-catabolic-activity — The snapshot records production but no organism consumption, so metabolite detection cannot stand in for uptake or catabolism.
- taxonomic-nomenclature-reconciliation — Fitness Browser matches range from direct strain to genus-only, and pangenome links stop at genus without strain-to-genome mapping.
- multi-omics-integration — The WoM–Fitness Browser metabolite bridge connects exometabolite production with gene-fitness experiments and provides a concrete metabolite-to-gene analysis path.
- metabolic-model-gapfilling — Exact and formula-only ModelSEED links quantify compound-annotation coverage and expose the ambiguity that limits reaction-level interpretation.
- gene-essentiality — The report proposes testing whether Fitness Browser gene importance relates to metabolites produced by the same organism. Missing consumption data blocks the stronger consumption-based prediction.
- pangenome-integration — Genus-level pangenome representation, with top-5 species-clade counts, exists for all WoM genera.
- pangenome-openness-determinants — The proposed test of metabolic novelty rate against pangenome openness remains untested.
- data-landscape-ownership-and-coverage-bias — The resource is small (37 organisms, 20 experimental), single-laboratory, and ENIGMA-funded, which limits between-group statistics.
- provenance-aware-resource-discovery — The archived 2018 Wayback Machine snapshot, the mismatch between schema and export, and the GNPS2/Northen laboratory alternatives document provenance and reproducibility constraints. 1