Status: complete (analysis + one synergy use case sample-validated against the live cluster).
Executive Summary
BERDL hosts 1,740 deduplicated tables across 119 databases, 17 tenants, and 10 funding agencies / programs, spanning 17 biological topics. Underneath those tables sits billion-row biological data. The atlas finds:
- Depth is at the billion-row scale. ~1.01 B KBase pangenome genes (293K genomes / 27.7K species pangenomes / 132.5M gene clusters); 475M UniRef100 + 189M UniRef90 + 60M UniRef50 protein clusters; 241M AlphaFold predicted structures; 261M MicrobeAtlas OTU-count rows; 75M metatranscriptomic abundance rows; 27.4M FitnessBrowser measurements; 40M PubMed records; plus reference layers for biochemistry, mass spec, growth phenotype, viral genomes, and environmental embeddings — all queryable from one Spark cluster.
- DOE dominates BERDL at ~78% of tables (DOE-BER 63%, DOE BRaVE 14%, DOE/NSF 0.6%, DOE-FE 0.4%); ARPA-H (PROTECT) contributes 4%; NSF (Planet Microbe) 3.5%; DOI (USGS) and the academic / multi / user namespaces fill the rest. DOE-BER is the only agency covering all 15 biological topics.
- 536 cross-tenant bridges exist at the schema level, defined by 29 canonical join keys (
sample_id,genome_id,ncbi_taxon_id,feature_id,ec_number,kegg_pathway, …). - 77% (51/66) of audited BERIL projects already span multiple tenants — the lakehouse architecture is delivering on cross-program synergy. Realized use is concentrated on the
kbase × kescienceaxis (36 projects). - Five high-leverage bridges had zero realized use at audit time:
kescience ↔ refdata(12 keys, including AlphaFold IDs),enigma ↔ phagefoundry(11),kbase ↔ refdata(11, includinggtdb_taxonomy),nmdc ↔ protect(10),nmdc ↔ refdata(9). Five concrete use cases derived from these bridges are documented (UC1–UC5). - UC1 (structural fitness atlas) has been sample-validated on the live cluster. The proposed join recipe required correction (FitnessBrowser exposes
(orgId, locusId), notprotein_id; the bridge to AlphaFold runs throughbesthitswissprot.sprotAccession). The corrected join produces a working dataset of 55,454 FitnessBrowser genes across 48 organisms with both fitness measurements AND an AlphaFold model. SwissProt-best-hit coverage of AlphaFold is 99.5%.
The atlas is built for two audiences: KBase users (“where to look for what”, with concrete join recipes per topic) and PIs / funders (“which agencies fund which biology, where coverage already exists, where investment unlocks new analyses”).
Key Findings
Finding 1: BERDL has billion-row depth across 10+ biological dimensions
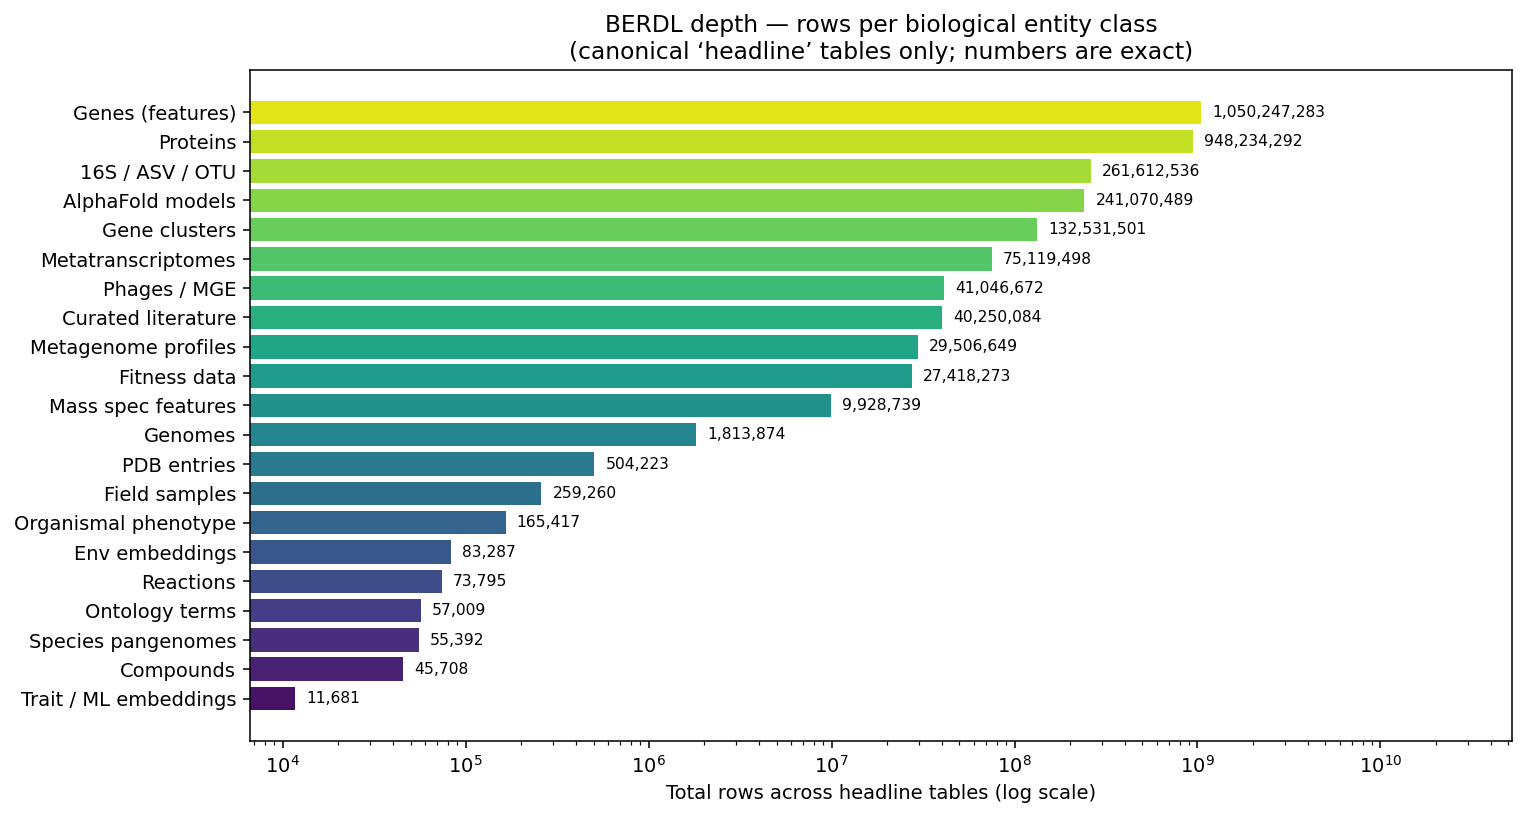
65 curated ‘headline’ tables hit on the live cluster show BERDL is simultaneously deep across genomes, genes, proteins, structures, phenotype/fitness, samples, community profiles, mass spec, viruses, biochemistry, ontology, environment, and literature. The single largest entity table is kbase_ke_pangenome.gene at 1,011,650,903 rows (~3.4K genes × 293K genomes).
(Notebook: 05_data_volume.ipynb)
Finding 2: Topic coverage is heavily skewed; DOE-BER is the only broad-coverage funder
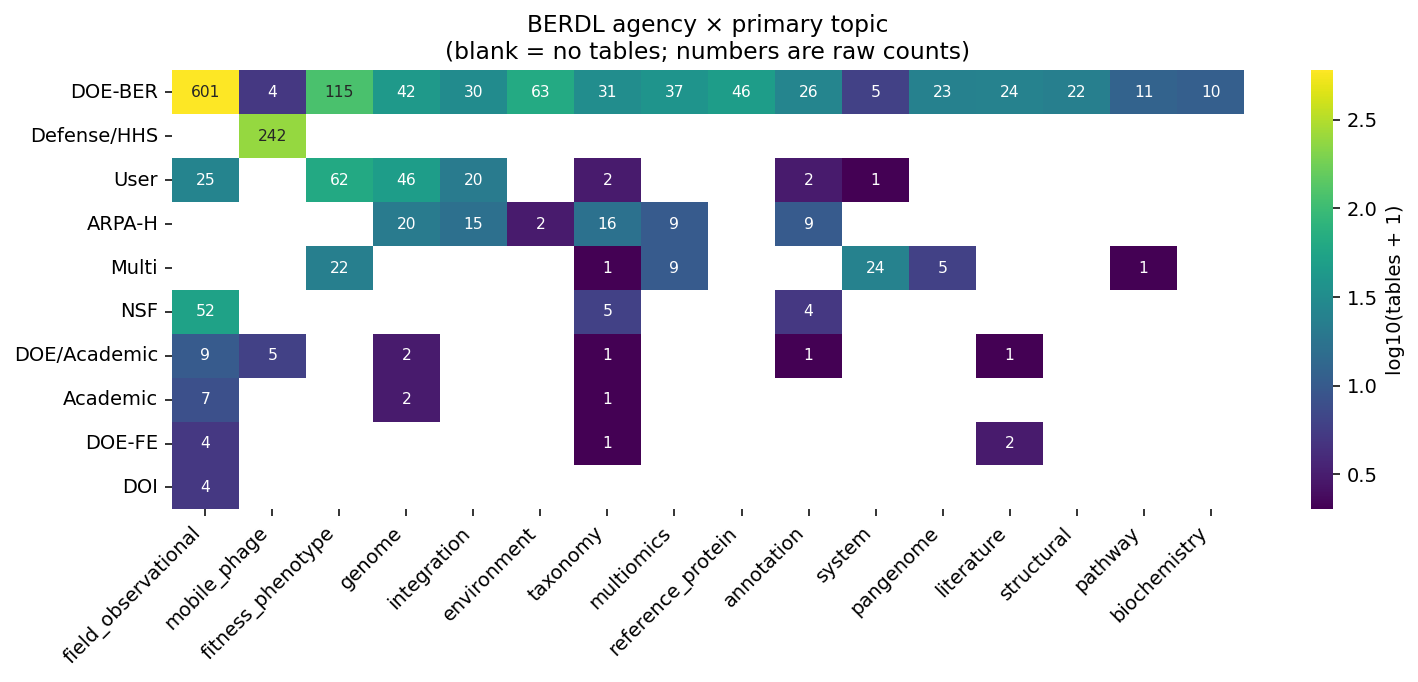
DOE-BER spans every topic (15 / 15); Defense / HHS = mono-topic (PhageFoundry, all mobile_phage); ARPA-H (PROTECT) spans 6 topics; NSF (Planet Microbe), DOE-FE (NETL), DOI (USGS) are narrow in topic but cover unique sample types. Topic concentration: 6 topics are >75 % single-owner (mobile_phage 96 % PhageFoundry, pangenome 79 % kbase, reference_protein 78 % refdata, etc.); 7 topics are cross-tenant with top tenant ≤ 55 % share (taxonomy spans 12 tenants — the broadest cross-tenant surface in BERDL).
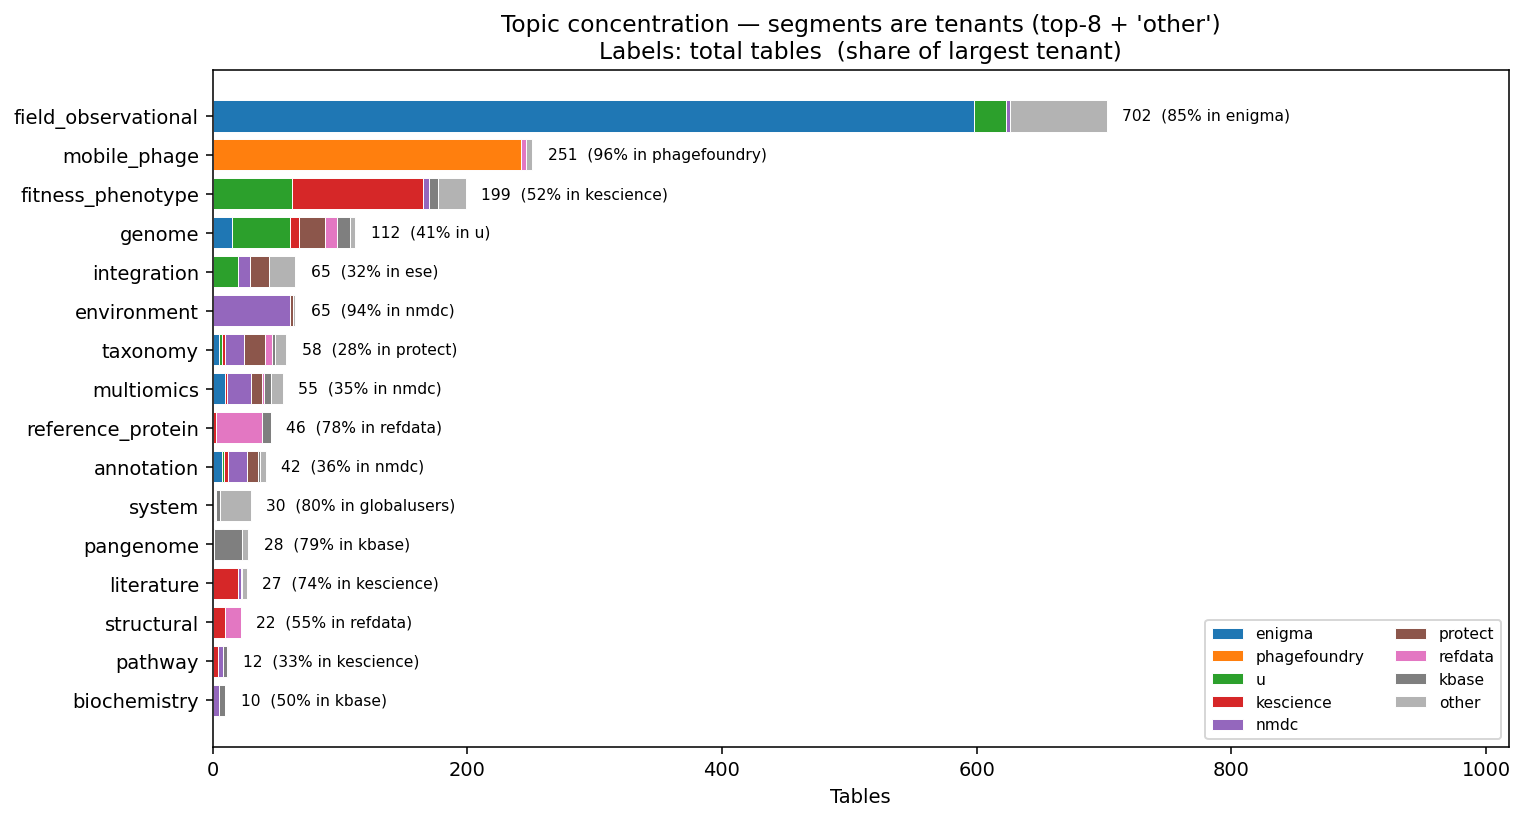
(Notebook: 01_topic_map.ipynb)
Finding 3: 536 cross-tenant bridges define the lakehouse join surface
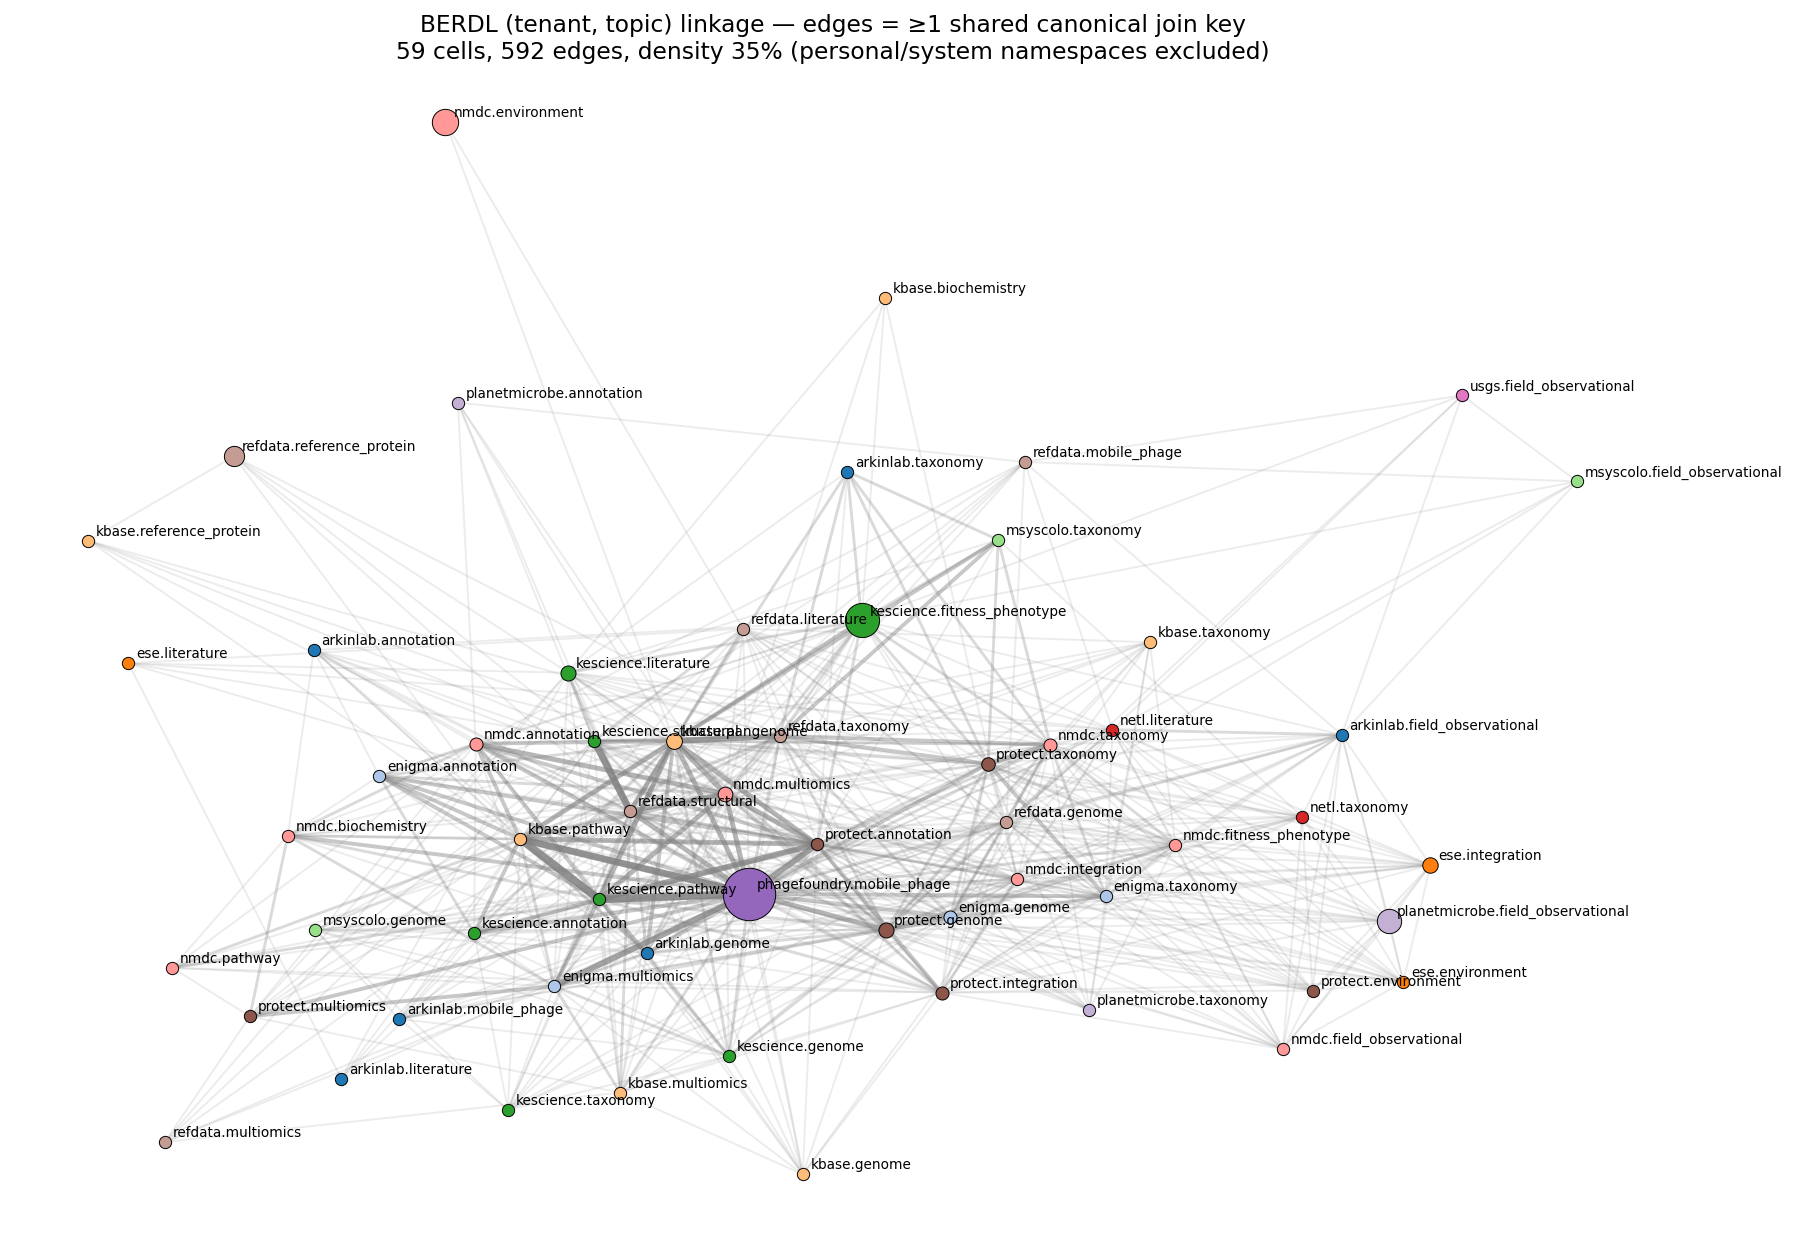
29 canonical join keys (genome / taxonomy / sample / annotation / pathway / biochemistry / protein / phage / literature / KBase workspace) were scanned across the catalog. Workhorses by tenant span: sample_id (10 tenants), genome_id (9), ncbi_taxon_id (9), feature_id (9), ec_number (8). 536 unordered cross-tenant bridges exist at the (tenant × topic) cell granularity. Top bridges share up to 7 keys (kbase.pathway ↔ kescience.pathway; kescience.pathway ↔ phagefoundry.mobile_phage; refdata.structural ↔ kescience.structural via alphafold_pdb + pfam + protein_id).
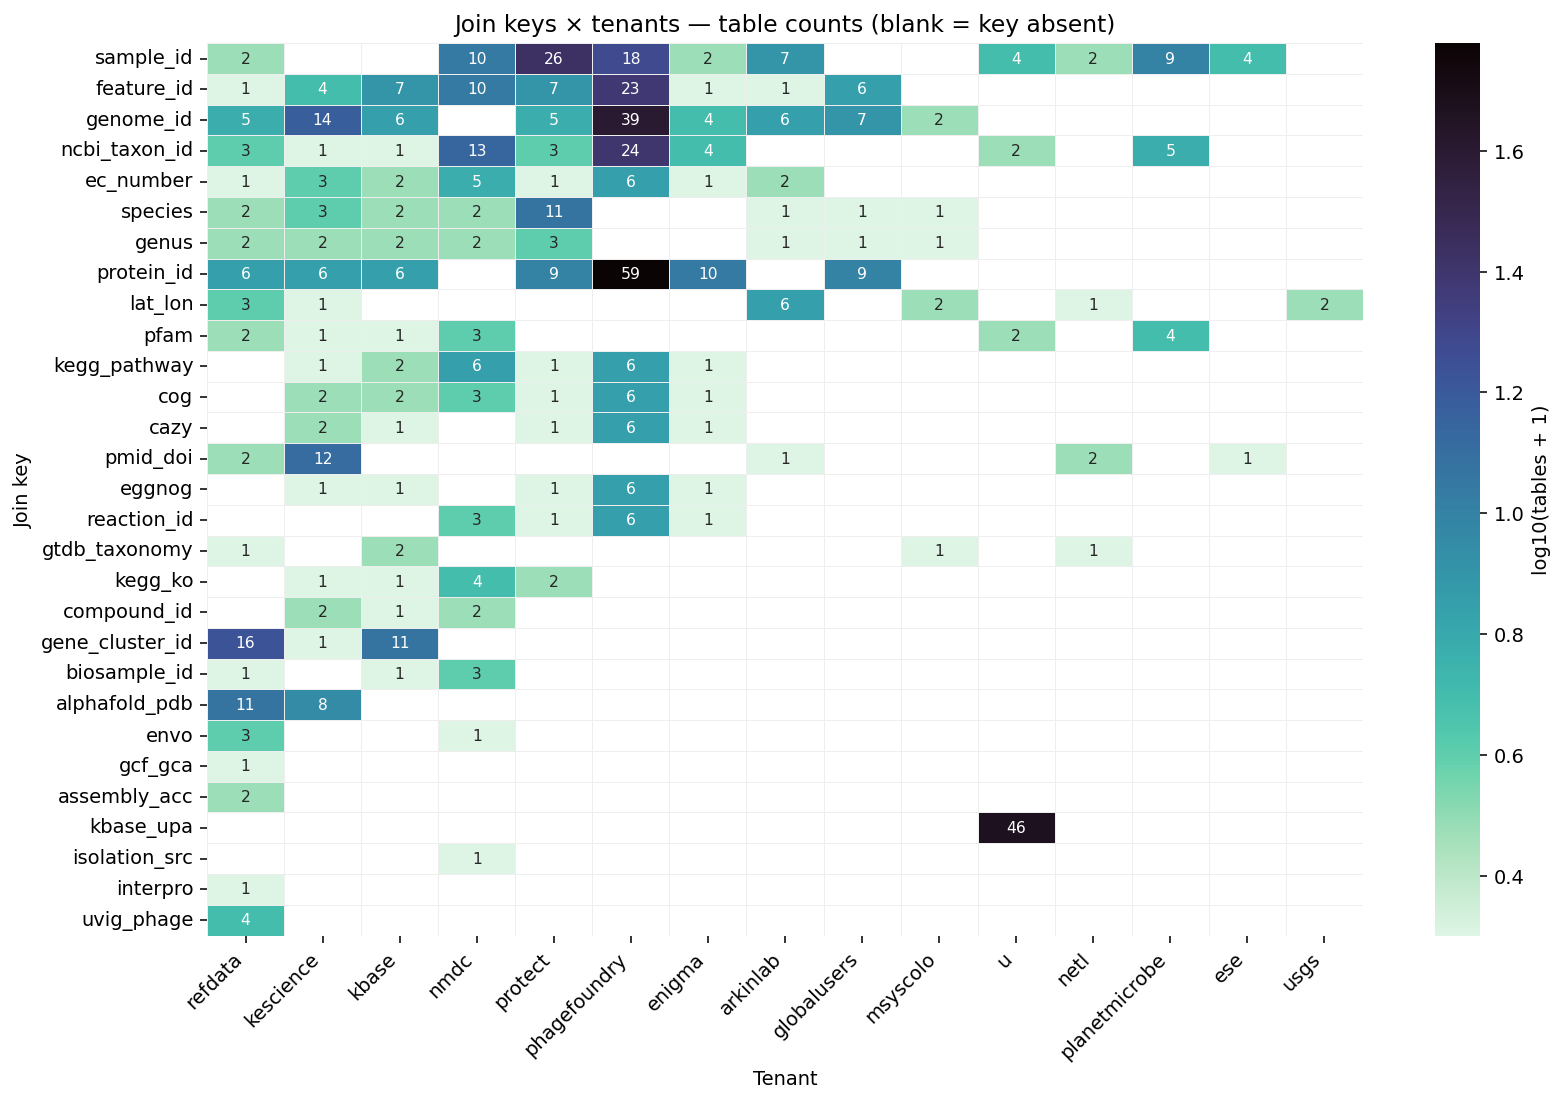
(Notebook: 02_linkage_atlas.ipynb)
Finding 4: 77% of BERIL projects are already cross-tenant; the kbase × kescience axis dominates
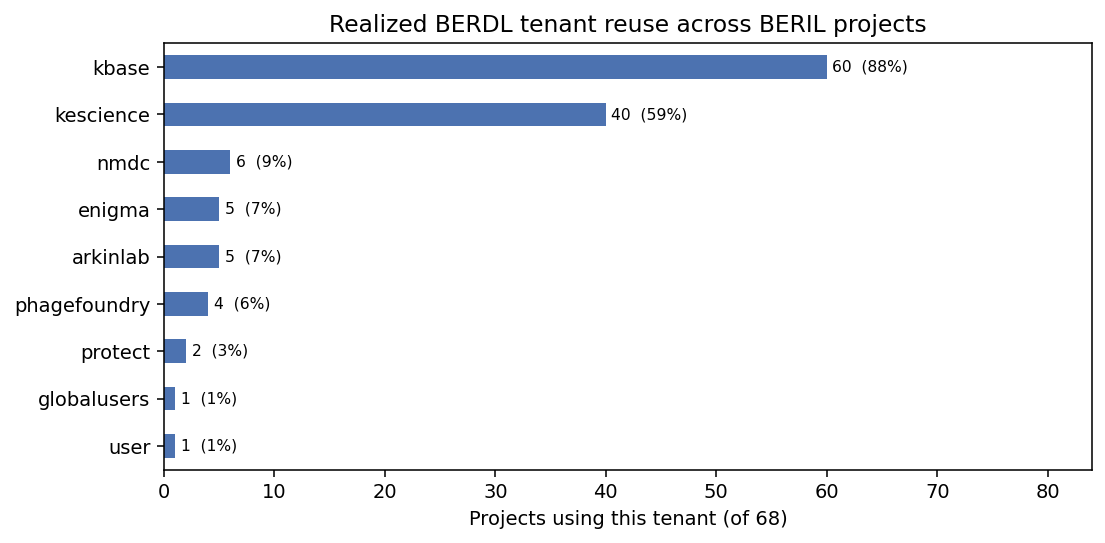
kbase appears in 53/66 projects (80%); kescience in 35/66 (53%); the kbase ↔ kescience realized bridge accounts for 36 cross-tenant projects on its own (mostly pangenome × fitness joins via genome_id and ncbi_taxon_id). Heavy-in-BERDL ≠ heavy-in-reuse: ENIGMA holds 36% of tables but appears in only 6 projects; PhageFoundry holds 14% / 5 projects; PROTECT holds 4% / 2 projects.
(Notebook: 03_realized_use_audit.ipynb)
Finding 5: Five high-leverage bridges remain untapped
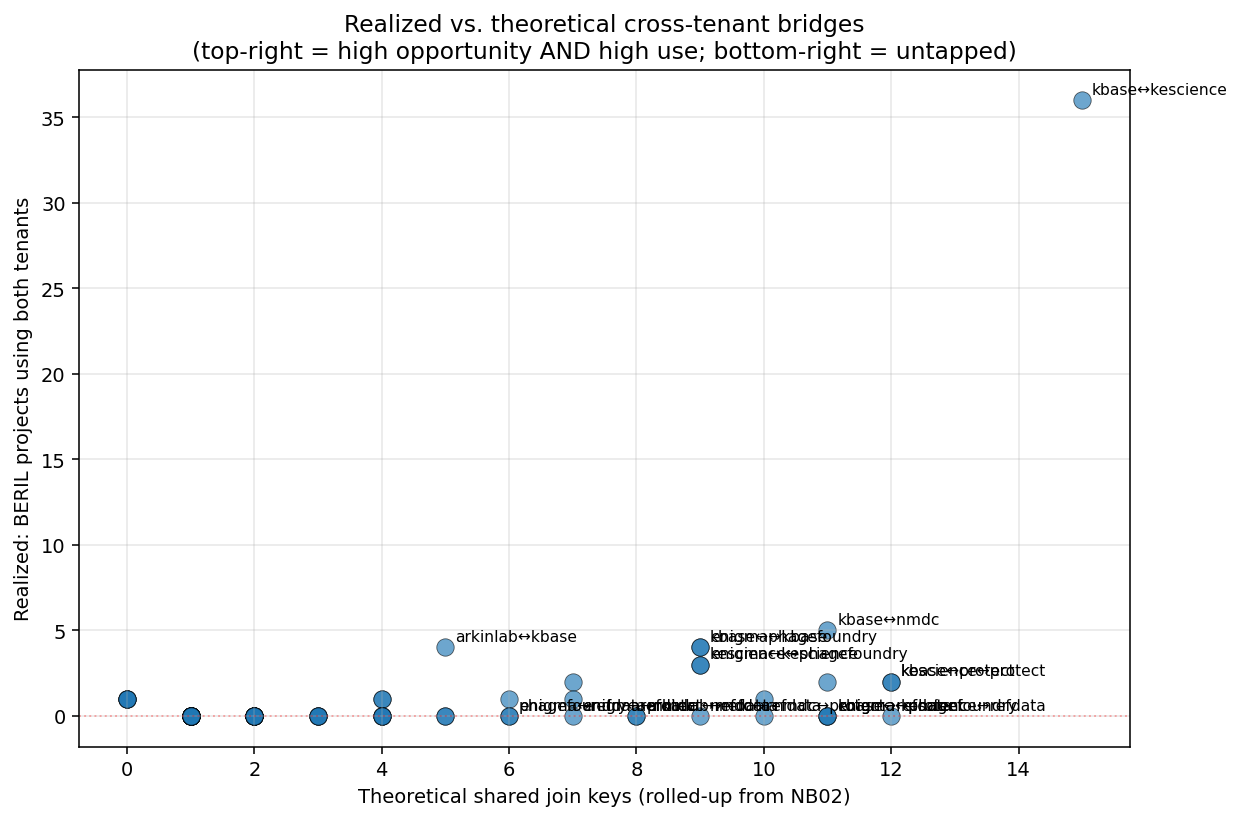
The bridges with the highest schema-level join surface that no BERIL project has yet exercised (at audit time):
| Rank | Bridge | Shared keys | Headline question |
|---|---|---|---|
| UC1 | kescience ↔ refdata | 12 | Do high-fitness-impact genes have structural signatures detectable in AlphaFold? |
| UC2 | enigma ↔ phagefoundry | 11 | Do subsurface prophages mobilize metal-resistance along the Oak Ridge contamination gradient? |
| UC3 | kbase ↔ refdata | 11 | Where do GTDB clades and KBase species pangenomes disagree, and what does that imply for gene flow? |
| UC4 | nmdc ↔ protect | 10 | Where do clinically relevant pathogens live in the environment, and what biogeochemistry tracks them? |
| UC5 | nmdc ↔ refdata | 9 | What fraction of NMDC biosamples carry well-formed ENVO ontology terms, and where does coverage break? |
(Notebook: 04_synthesis_and_use_cases.ipynb)
Finding 6: UC1 (structural fitness atlas) sample-validates against the live cluster
The proposed UC1 recipe pointed at protein_id as the bridge column. FitnessBrowser does not expose protein_id — it uses a composite (orgId, locusId) primary key. The correct path was discovered by SQL probing:
genefitness ──(orgId, locusId)── besthitswissprot ──sprotAccession = uniprot_accession── alphafold_entries| Coverage measurement | Live-cluster value |
|---|---|
| FitnessBrowser gene-fitness measurements | 27,410,721 |
| Genes with SwissProt best-hit | 79,180 |
| AlphaFold entries | 241,070,489 |
| SwissProt-best-hit coverage in AlphaFold | 99.5% (78,753 / 79,180) |
| Genes with BOTH fitness data AND an AlphaFold model | 55,454 (48 organisms, 22,303 distinct AF models) |
E. coli sample rows (thrA → AF-P00561-F1, thrB → AF-P00547-F1, thrC → AF-P00934-F1, talB → AF-Q3Z606-F1) confirm semantic validity. Fitness-class distribution within the joined cohort: 6,635 essential (min_fit ≤ −4) / 8,271 strong-defect / 10,950 moderate / 29,467 mild / 131 no defect, tested at an average of 121–187 conditions per gene. Strongly enriched for essentiality signal — ready for downstream structure-function analysis.
(Notebook: probed interactively from the on-cluster Spark Connect session; recipe + numbers documented in REPORT and memorialized as fitnessbrowser_alphafold_join.md agent memory.)
Results
Composite atlas view (NB04)
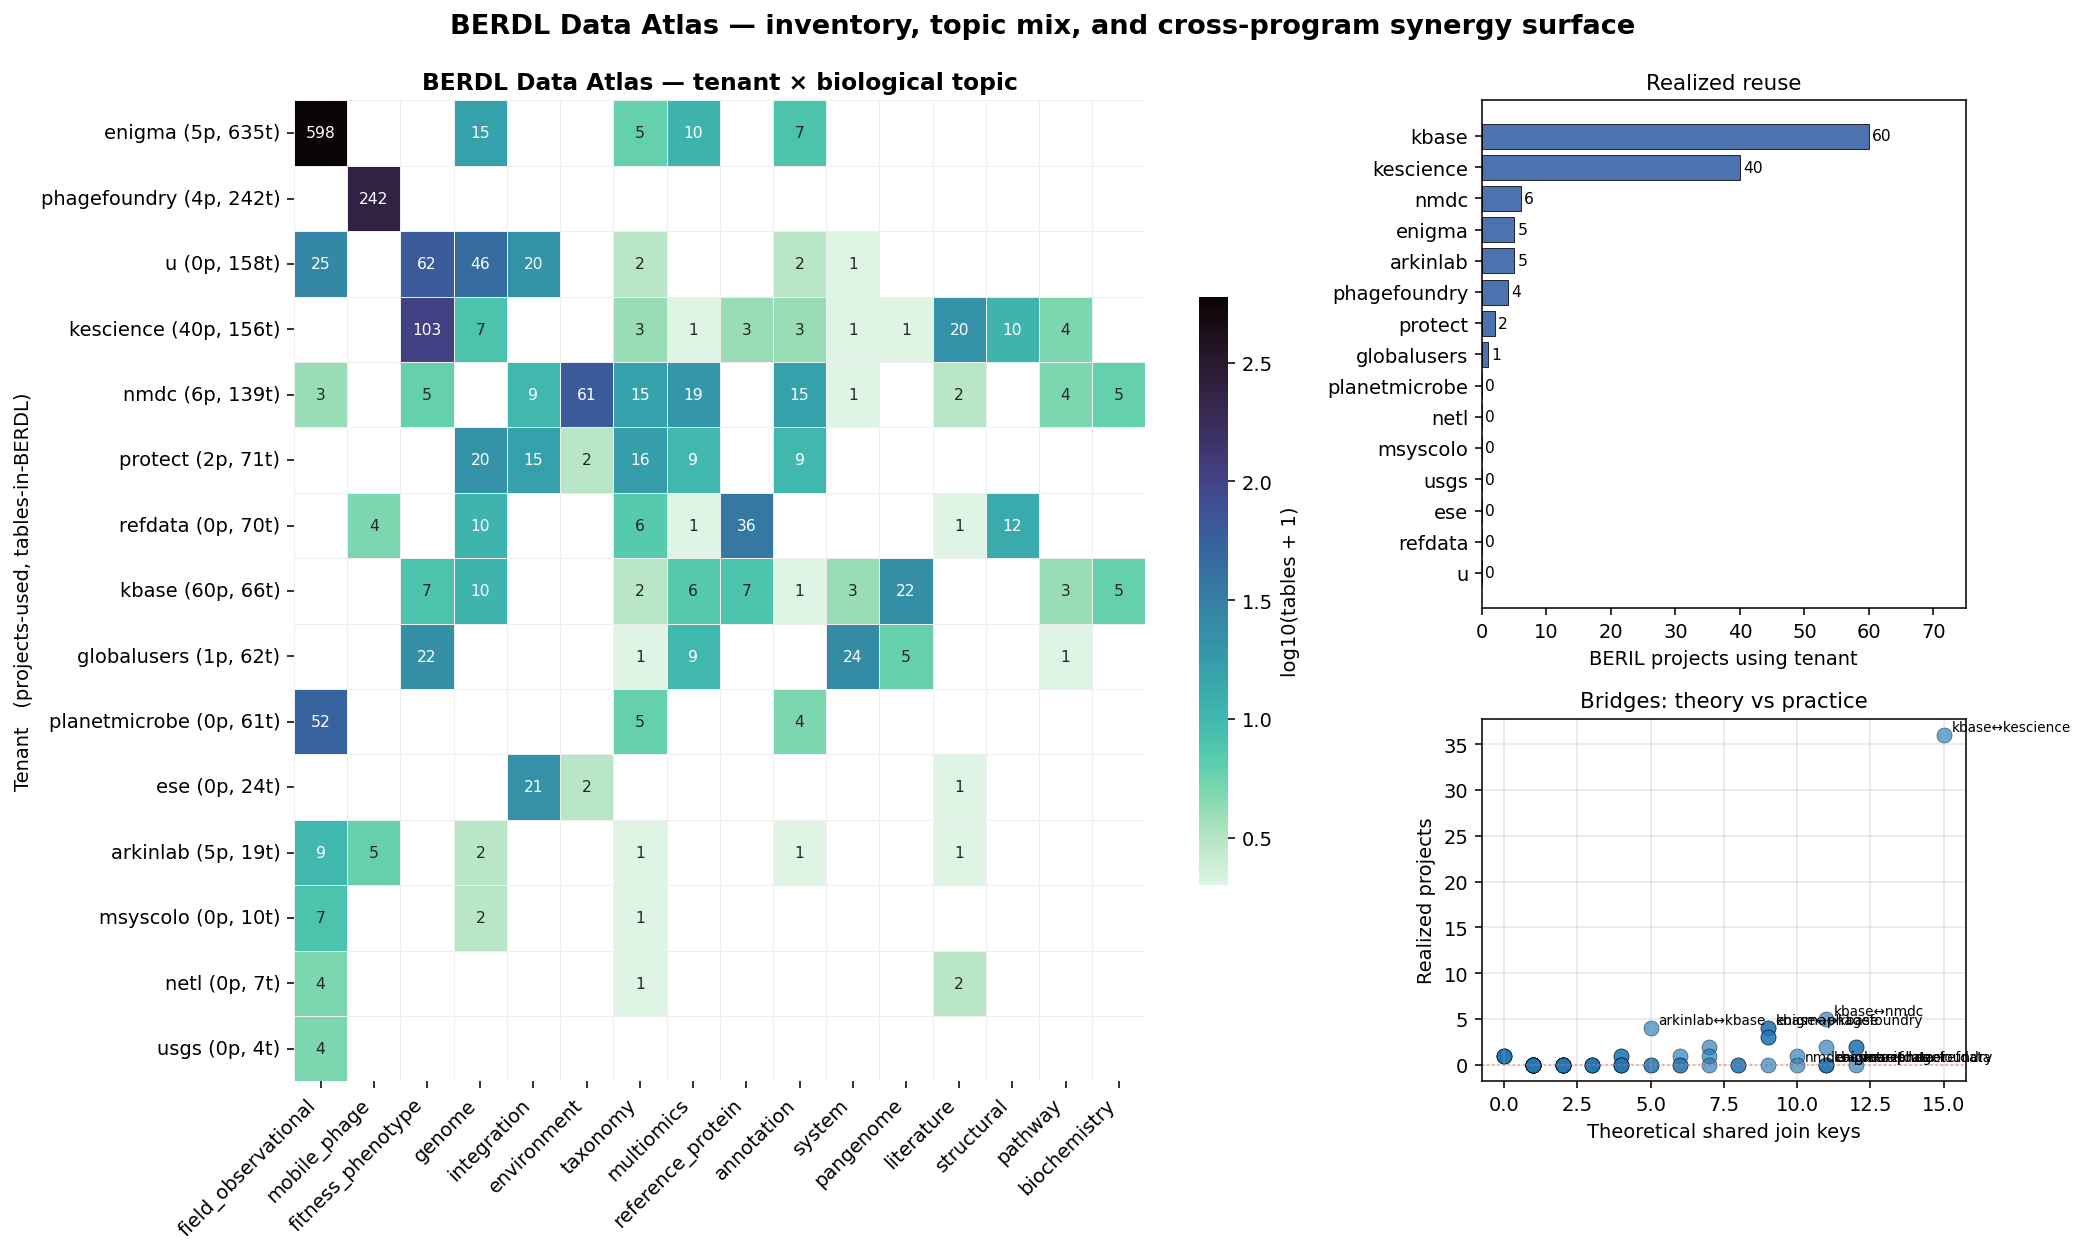
The composite figure ties the inventory, topic mix, and bridge structure onto a single sheet: tenant × topic heatmap (main panel, log-color, exact counts annotated); tenant-reuse bar (top right, from NB03); theory-vs-practice bridge scatter (bottom right, untapped bridges labelled top-left).
Per-entity volume — every headline table
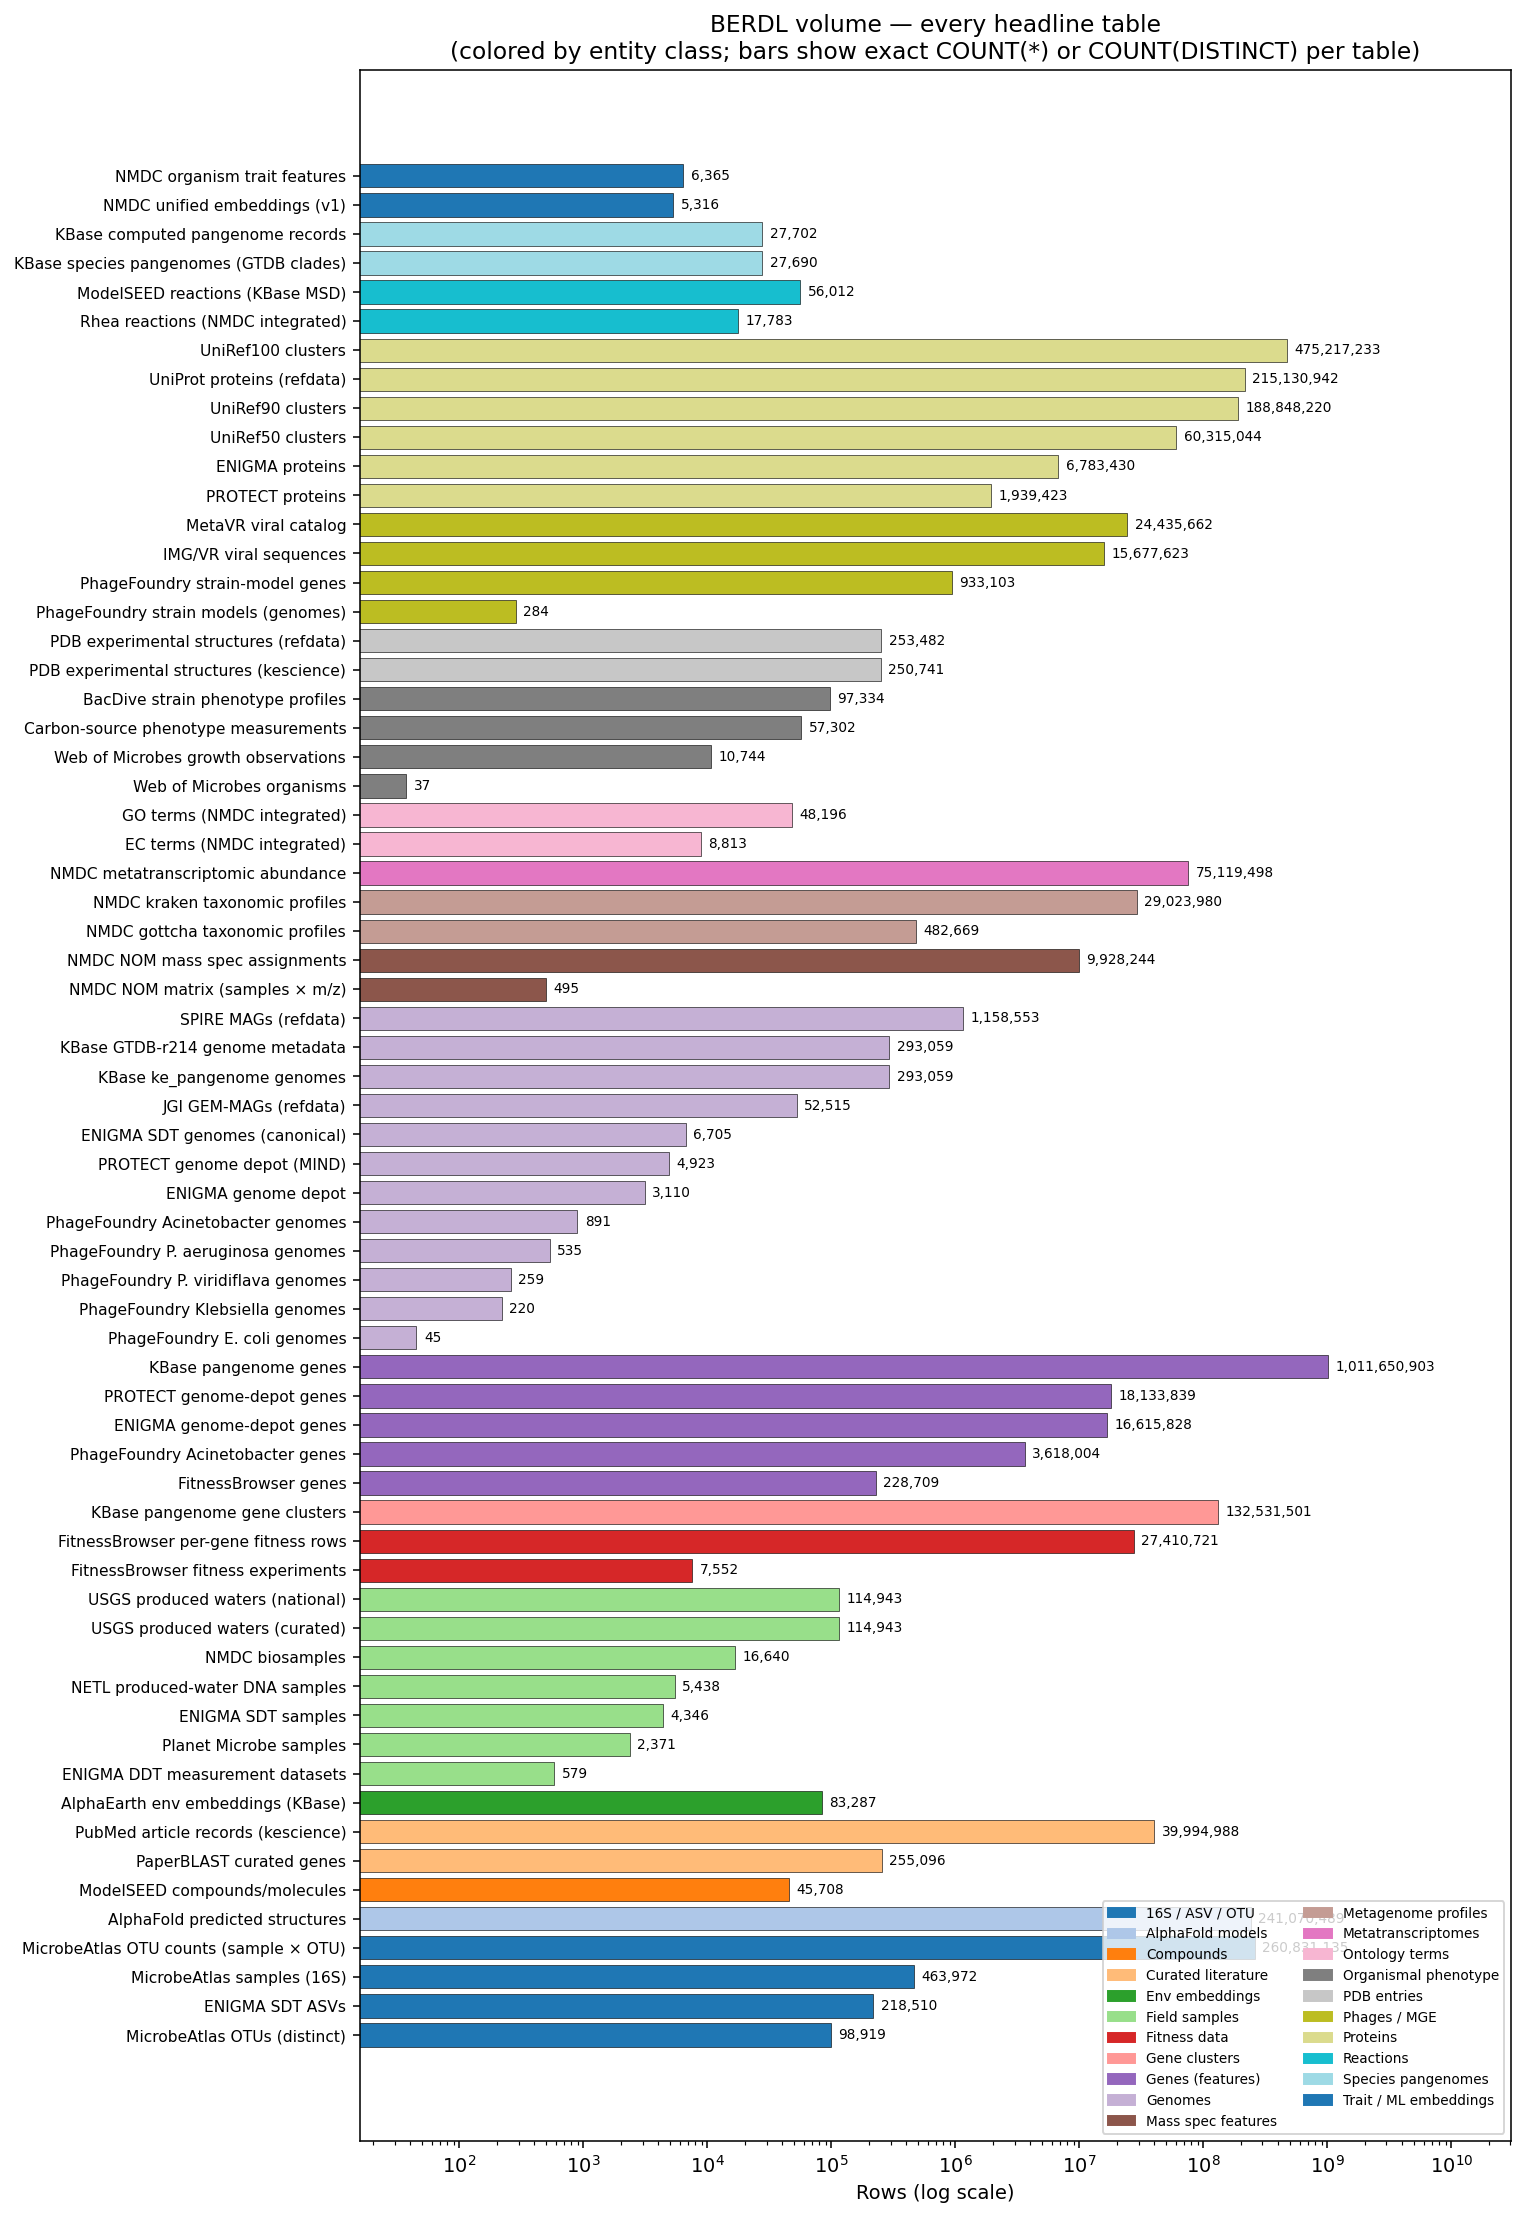
The full per-table breakdown drives the §Depth picture. Notable headline numbers:
Genomes, pangenomes, clusters. 293,059 KBase ke_pangenome genomes; 27,690 GTDB species clades / pangenomes; 132.5M gene clusters; 1,011,650,903 KBase pangenome genes. 1,158,553 SPIRE MAGs and 52,515 JGI GEM-MAGs in refdata. 3,110 ENIGMA depot genomes (6,705 ENIGMA SDT genomes), 4,923 PROTECT MIND genomes, ~1,950 PhageFoundry host genomes across 5 host species.
Proteins / structures. 215,130,942 UniProt proteins; 475,217,233 UniRef100 / 188,848,220 UniRef90 / 60,315,044 UniRef50 clusters (2026-01). 241,070,489 AlphaFold predicted structures. ~253K PDB experimental structures.
Phenotype / fitness / growth. 27,410,721 FitnessBrowser per-gene fitness measurements across 7,552 experiments and 228,709 genes. 97,334 BacDive strain phenotype profiles. 57,302 carbon-source phenotype measurements. 10,744 Web of Microbes growth observations across 37 organisms.
Field samples and environmental data. 463,972 MicrobeAtlas 16S samples (98,919 OTUs, 260,831,135 OTU-count rows). 114,943 USGS produced-water samples; 16,640 NMDC biosamples; 5,438 NETL produced-water DNA samples; 4,346 ENIGMA SDT samples + 579 ENIGMA DDT measurement ‘bricks’; 2,371 Planet Microbe samples; 218,510 ENIGMA SDT ASVs; 83,287 AlphaEarth environment embeddings indexed to KBase genomes.
Community multi-omics. 75,119,498 metatranscriptomic abundance rows (NMDC GOLD). 29,023,980 kraken + 482,669 gottcha taxonomic profile rows. 9,928,244 NOM mass spec assignments.
Phage / virus / mobile. 24,435,662 MetaVR + 15,677,623 IMG/VR viral sequence records (refdata). 933,103 PhageFoundry strain-modelling gene records.
Biochemistry, ontology, literature. 56,012 ModelSEED reactions + 45,708 compounds + 17,783 Rhea reactions. 48,196 GO terms + 8,813 EC terms (NMDC integrated). 255,096 PaperBLAST curated genes + 39,994,988 PubMed article records.
Topic distribution + tenant×topic context (NB00)
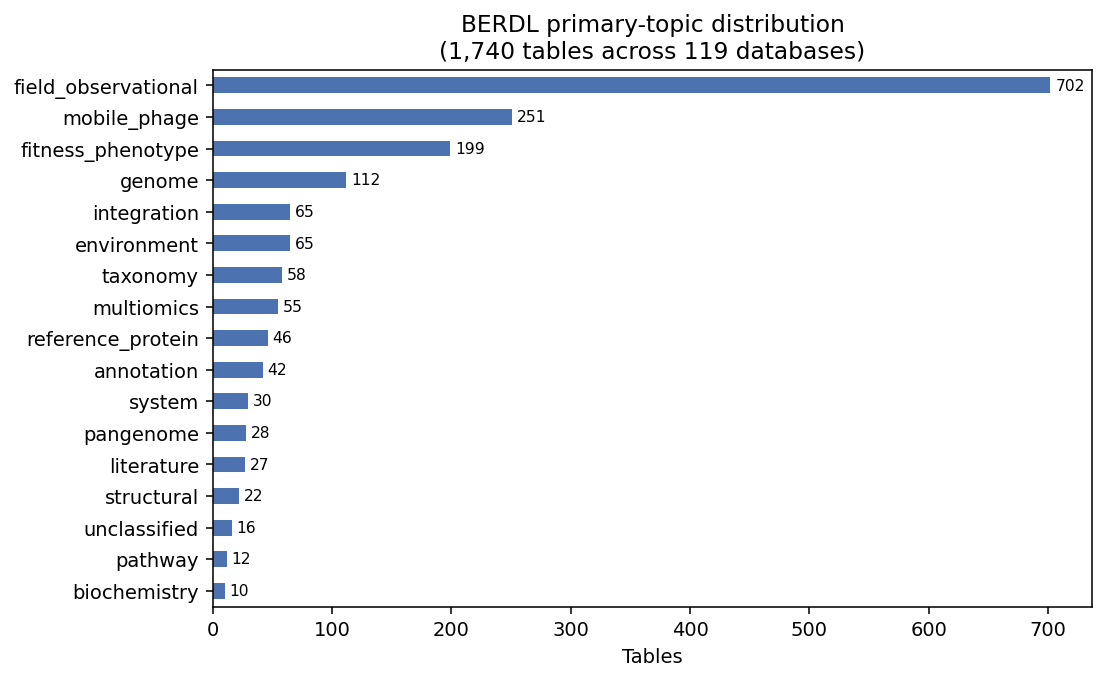
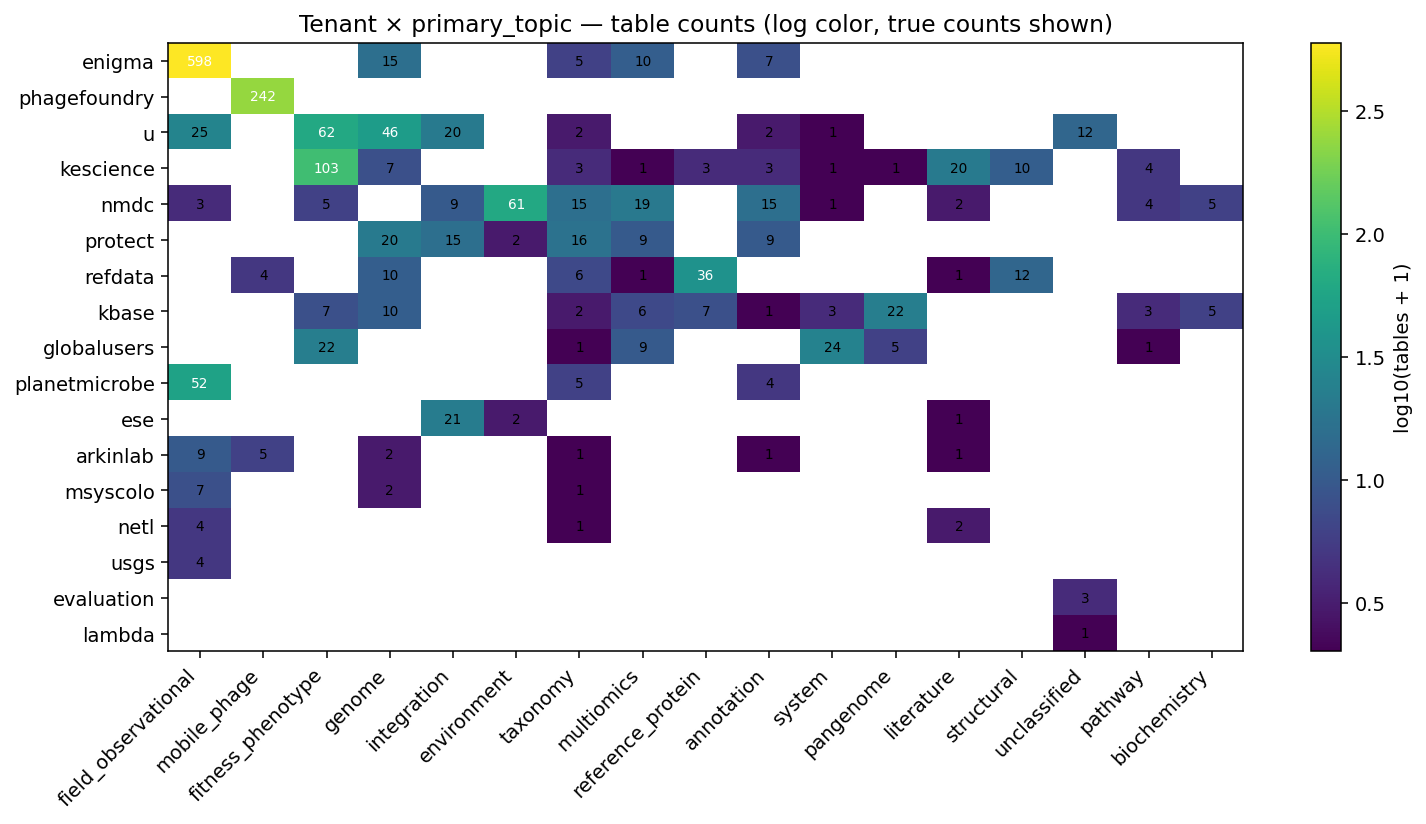
field_observational is 40% of tables (dominated by ENIGMA SDT/DDT structure); mobile_phage 14% (PhageFoundry); fitness_phenotype 11%; genome 6.4%; everything else <4%. Unclassified residual 0.9% (16 rows), all personal scratch / one-off survey data.
Synergy capacity per tenant (NB01)
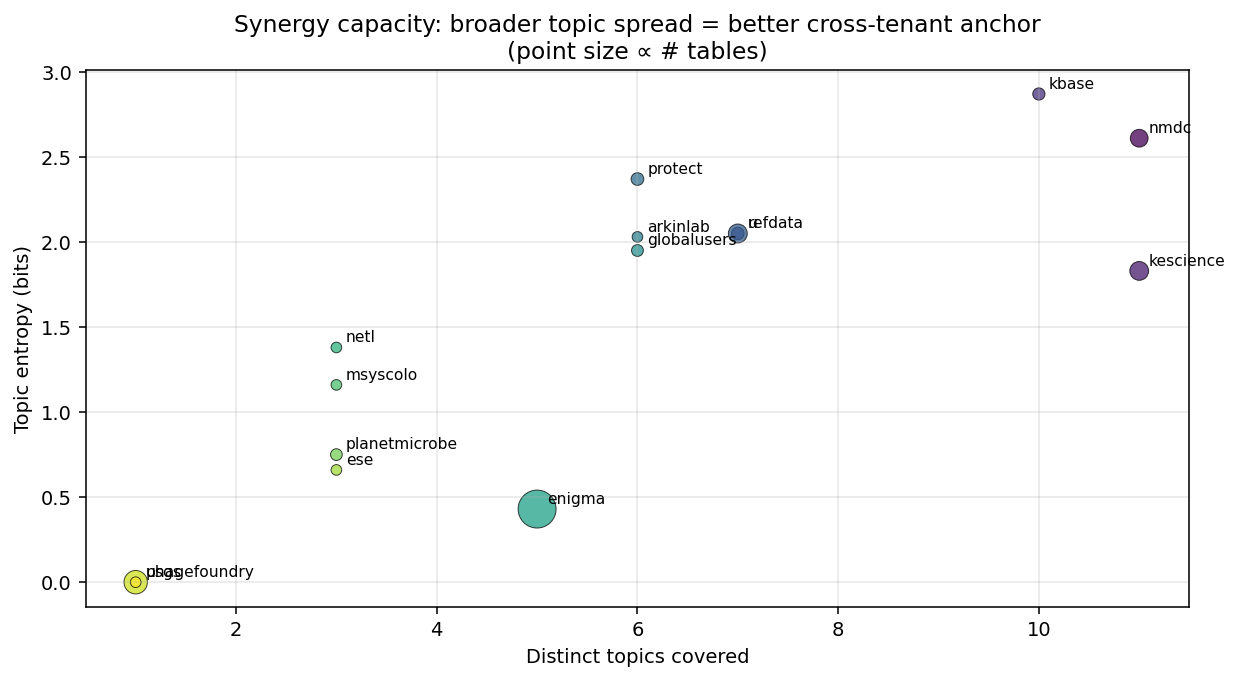
kbase (10 topics, entropy 2.87) is the most evenly cross-topic tenant — the biological reference hub. nmdc (11 topics, 2.61) is broadest-coverage. protect (6 topics, 2.37) punches above its size. kescience (11 topics, 1.83) is the knowledge-engine layer. enigma (5 topics, 0.43) is deep-but-narrow. phagefoundry and usgs are mono-topic.
Interpretation
What the atlas demonstrates about BERDL’s design
BERDL is simultaneously broad (17 tenants spanning 10 funding programs and 17 biological topics) and simultaneously deep (billion-row gene records, billion-row protein clusters, hundred-million-row community profile tables, tens-of-millions of fitness measurements). The 536 schema-level cross-tenant bridges plus the 77% realized cross-tenant adoption show that the lakehouse architecture is delivering on its cross-program-synergy promise.
The kbase × kescience axis dominates realized analyses because both tenants are intra-DOE-BER, well-documented, and cover the most cross-tenant topics in BERDL (genome × phenotype). The five untapped use cases (UC1–UC5) trace the next class of analyses: extending into refdata for structural / GTDB joins, into nmdc_arkin for multi-omics + environmental context, into PhageFoundry / PROTECT for cross-agency biology, and into ENIGMA for subsurface ecology.
Audience message — KBase users
A heuristic for choosing data sources by analysis type:
- Genome + pangenome work →
kbase_ke_pangenome(293K genomes / 27.7K species / 132.5M gene clusters); cross-references trivially viagenome_idandncbi_taxon_id. - Lab phenotype →
kescience_fitnessbrowser(gene-level fitness, hundreds of conditions); joins to ke_pangenome ongenome_id. - Curated phenotype →
kescience_bacdive(organismal traits) andkescience_webofmicrobes(carbon utilization); join viancbi_taxon_id. - Environmental abundance / multi-omics →
nmdc_arkin(kraken / gottcha taxonomy profiles, NOM mass spec, ML embeddings). Join onncbi_taxon_idfor taxa; onsample_idfor biogeochemistry. - Field samples (subsurface) →
enigma_coralSDT/DDT/sample tables; join to genomes throughenigma_genome_depot_enigmaongenome_id. - Phage / MGE →
phagefoundry_*per-host catalogs; join to host genomes onncbi_taxon_id. - Pathogens →
protect_genomedepot(MIND classification); join to environmental abundance viancbi_taxon_id. - Reference structures →
kescience_alphafold(241M models) +refdata_pdb(253K experimental). Join to fitness via the FitnessBrowser SwissProt best-hit pivot (UC1). - Reference proteins / families →
refdata_uniref{50,90,100}+refdata_uniprot. Cross-reference viaprotein_idorpfam_id. - Literature →
kescience_paperblast+kescience_pubmed. Join viapmid/doi.
Universal heuristic: if your analysis crosses topics (e.g. genome × phenotype × environment), it almost certainly crosses tenants. The canonical bridge is whichever of {genome_id, ncbi_taxon_id, sample_id, feature_id} both sides expose; data/cross_tenant_bridges.csv lists the exact key set per pair.
Audience message — PIs and funders
- DOE-BER is the broad backbone. 63% of BERDL tables, every topic covered, 80% of BERIL projects. The lakehouse concentrates DOE-BER’s biological reference (KBase, KE Science, NMDC, ENIGMA, refdata) into one queryable space, which is the single largest contributor to BERIL throughput.
- DOE BRaVE (PhageFoundry) and ARPA-H (PROTECT) are under-leveraged for cross-program work. Despite spanning the right topics, they appear in fewer than 8 projects each. The existing bridges (
ibd_phage_targeting,cf_formulation_design) demonstrate the pattern; scaling it is a coordination problem, not a technical one. - NSF (Planet Microbe), DOE-FE (NETL), DOI (USGS) are tiny in table count but unique in sample provenance (open ocean, produced waters). Their value is as external validation sets for any DOE-BER-anchored analysis. Investment in shared sample / ENVO ontology (UC5) is the highest-leverage scoping bet.
- Biggest single untapped opportunity: structure × phenotype (UC1,
kescience ↔ refdatavia the AlphaFold bridge). 99.5% join coverage, intra-DOE-BER, sample-validated. Ready to scope as a standalone project.
Literature context
This is a meta-atlas project — the references are canonical citations for the data systems being catalogued, not for biological hypotheses being tested.
The most-used realized bridge (kbase × kescience, 36 BERIL projects) builds on the FitnessBrowser pangenome cross-reference of Price et al. (2018) — published in Nature and now backed in BERDL by the cross-organism pangenome of the KBase KE pipeline (Arkin et al. 2018). UC1’s validated SwissProt-best-hit-to-AlphaFold path is the BERDL realization of the structure-function loop opened by Jumper et al. (2021).
Novel contribution
- The first comprehensive, machine-readable BERDL catalog (
table_topic_map.csv) with tenant / agency / program / biological-topic provenance. - The first cross-tenant linkage atlas (29 canonical keys → 536 schema-level bridges) showing exactly which biological IDs bridge which tenant/topic cells.
- The first realized-vs-theoretical bridge overlay surfacing the 51 cross-tenant BERIL projects and identifying which high-leverage bridges remain unused.
- The first per-entity-class depth inventory (65 headline tables ×
COUNT(*)/COUNT(DISTINCT)) showing BERDL’s billion-row biological mass in audience-readable units. - The first sample-validated synergy use case (UC1) with a corrected, executable join recipe and live-cluster coverage statistics.
Limitations
- Value-space validity of joins is established only for UC1. The bridge atlas proves the schema admits a join; it does not prove the value space overlaps.
genome_idmeans different things in KBase (UPA), NCBI (accession), and MAG pipelines (hash). UC2–UC5 require their own first sample-execution before publication. UC1 has been completed — see Finding 6. - Two tenant→agency mappings are not yet verified by program documentation.
evaluationandlambda(4 tables total) remain unmapped.phagefoundryandmsyscolowere originally inferred as “likely” Defense/HHS and NSF/USDA; user-confirmed corrections (DOE BRaVE and DOE/NSF) have been folded in. - Realized-use audit is README-based — data-source mentions buried in research plans or in notebook source may have been missed. True per-project tenant breadth is a lower bound.
- NB05 depth counts use
COUNT(*)(row totals) for most tables; only the canonical KBase genome count usesCOUNT(DISTINCT genome_id). A pangenome ‘gene’ row is one (genome, gene), so 1.01B genes ≈ 293K genomes × ~3.4K genes / genome. - Across-tenant deduplication is not performed. refdata and kbase may both house the same UniProt entries through different cluster indices; ENIGMA and the genome-depot tables share genome records with the ENIGMA SDT layer.
Data
Sources
The atlas surveys the entire BERDL lakehouse — every accessible tenant. The collections below are the headline data sources cited in the depth inventory and UC1 validation:
| Collection | Tables Used | Purpose |
|---|---|---|
kbase_ke_pangenome | genome, gtdb_species_clade, gtdb_metadata, gene, gene_cluster, pangenome, alphaearth_embeddings_all_years | KBase computed pangenomes — the canonical genome reference and the cross-program join anchor |
kescience_fitnessbrowser | genefitness, besthitswissprot, gene, experiment | Per-gene fitness across hundreds of conditions; SwissProt best-hits are the structural-bridge pivot used in UC1 |
kescience_alphafold | alphafold_entries | 241M AlphaFold predicted structures keyed by UniProt accession |
kescience_bacdive | strain | 97K curated strain phenotype profiles |
kescience_webofmicrobes | observation, organism | Curated growth observations |
kescience_paperblast | curatedgene | 255K curated gene-paper assignments |
kescience_pubmed | pubmed_article_wide | 40M PubMed records |
kescience_pdb | pdb_entries | PDB experimental structures (kescience copy) |
refdata_uniprot | protein, entity | 215M UniProt protein records |
refdata_uniref50_2026_01, refdata_uniref90_2026_01, refdata_uniref100_2026_01 | cluster | UniRef protein clusters (3 redundancy levels, 2026-01 snapshot) |
refdata_pdb | pdb_entries, pdb_uniprot_mapping | PDB experimental structures + UniProt mapping |
refdata_jgi_gem_mags, refdata_spire, refdata_jgi_virus | genome_metadata, imgvr_sequence_info, metavr_main | Reference MAGs and viral sequence catalogs |
nmdc_metadata | biosample_set | NMDC biosample registry |
nmdc_arkin | kraken_gold, gottcha_gold, metatranscriptomics_gold, nom_gold, embeddings_v1, trait_features, rhea_reactions, go_terms, ec_terms | Integrated multi-omics, ML embeddings, ontology, and reactions |
enigma_coral | sdt_sample, sdt_genome, sdt_asv, ddt_ndarray | ENIGMA field samples, MAGs, ASVs, multidimensional measurement datasets |
enigma_genome_depot_enigma | browser_genome, browser_gene, browser_protein | ENIGMA genome / gene / protein browser depot |
protect_genomedepot | browser_genome, browser_gene, browser_protein | PROTECT MIND pathogen genome depot |
phagefoundry_acinetobacter_genome_browser, phagefoundry_klebsiella_*, phagefoundry_paeruginosa_*, phagefoundry_pviridiflava_*, phagefoundry_ecoliphagesgenomedepot, phagefoundry_strain_modelling | browser_genome, browser_gene, strainmodelling_genome, strainmodelling_gene | DOE BRaVE Phage Foundry — host-specific genome browsers and strain models |
planetmicrobe_planetmicrobe | sample | NSF Planet Microbe samples |
netl_pw_dna | dna_metadata | DOE-FE NETL produced-water DNA samples |
usgs_produced_waters | usgspwdb_c, usgspwdb_n | DOI / USGS produced-water sample data |
arkinlab_microbeatlas | otu_counts_long, otu_metadata, sample_metadata | MicrobeAtlas 16S OTU profiles |
kbase_msd_biochemistry | reaction, molecule | ModelSEED biochemistry reference |
globalusers_carbon_source_phenotypes | phenotype_data_table | Carbon-source phenotype measurements (multi-tenant shared) |
Generated Data
| File | Rows | Description |
|---|---|---|
data/table_topic_map.csv | 1,740 | Canonical inventory: every (tenant, agency, program, database, table) with primary / secondary topic tags + column names |
data/tenant_to_agency.csv | 15 | Curated tenant → agency / program / primary-funder map (user-corrected for phagefoundry + msyscolo) |
data/join_keys.json | 29 keys | For each canonical key, the list of (tenant, topic, db, table) cells where it appears |
data/join_key_coverage.csv | 29 | Per-key coverage stats (tables, tenants, topics covered) |
data/cross_tenant_bridges.csv | 536 | Cross-tenant (tenant×topic) bridges with shared-key counts and key inventory |
data/realized_use.csv | 66 | Per-BERIL-project tenant + database usage, with cross_tenant flag and topic focus |
data/theoretical_vs_realized.csv | 72 | Tenant-pair overlay of theoretical shared keys vs realized project count |
data/untapped_bridges.csv | 20 | Highest-leverage unrealized bridges (≥1 shared key, 0 realized projects) |
data/tenant_reuse_frequency.csv | 9 | Per-tenant BERIL project count + percent |
data/data_volume.csv | 65 | Per-entity-class depth inventory (COUNT(*) / COUNT(DISTINCT) per headline table) |
Supporting Evidence
Notebooks
| Notebook | Purpose |
|---|---|
00_inventory_audit.ipynb | Walks the BERDL Spark catalog, tags every table by tenant / agency / biological topic, dedupes dotted-namespace duplicates, audits the unclassified residual (0.9 %) |
01_topic_map.ipynb | Agency × topic heatmap, topic concentration (single-owner vs cross-tenant), per-tenant synergy capacity (distinct topics × entropy) |
02_linkage_atlas.ipynb | 29-key cross-tenant bridge atlas; (tenant, topic) linkage graph; bridge ranking by shared-key count |
03_realized_use_audit.ipynb | 66-BERIL-project README mining; tenant-reuse frequency; theoretical-vs-realized bridge overlay; untapped-bridge ranking |
04_synthesis_and_use_cases.ipynb | Composite atlas figure; five concrete synergy use cases (UC1–UC5) derived from top untapped bridges; audience summaries |
05_data_volume.ipynb | Per-entity-class depth inventory: 65 headline tables × COUNT(*) / COUNT(DISTINCT); per-class rollup + per-table breakdown figures; headline-numbers summary |
Figures
| Figure | Description |
|---|---|
nb00_topic_distribution.png | Primary-topic distribution across 1,740 tables |
nb00_tenant_topic_heatmap.png | Tenant × primary topic cross-tab (log color, exact counts) |
nb01_agency_topic_heatmap.png | Agency × biological topic coverage |
nb01_topic_concentration.png | Per-topic stacked bar of tenant share; top-tenant share annotated |
nb01_synergy_capacity.png | Per-tenant (distinct topics × topic entropy) scatter; point size ∝ tables |
nb02_key_tenant_heatmap.png | Join keys × tenants (log color, exact counts; blank = key absent) |
nb02_linkage_graph.png | (tenant, topic) network — edges = ≥1 shared join key, width ∝ key count |
nb03_tenant_frequency.png | BERIL project counts per tenant (realized reuse) |
nb03_theoretical_vs_realized.png | Per-tenant-pair scatter: shared keys vs realized projects (untapped bridges in bottom-right) |
nb04_atlas_composite.png | Composite atlas — tenant × topic heat, tenant reuse bar, theory-vs-practice scatter |
nb05_volume_by_entity_class.png | Per-entity-class data volume (log scale, exact counts) |
nb05_volume_per_table.png | Every headline table, log scale, colored by entity class |
Future Directions
- Validate UC2–UC5 against the live cluster. Each requires ~15–30 min of SQL probing to confirm value-space overlap and surface any join-recipe corrections. UC3 (kbase ↔ refdata, GTDB harmonization) is the next lowest-friction (intra-DOE-BER; both tenants well documented).
- Promote UC1 into its own project. The validated 55,454-gene cohort is the seed dataset. The known gap is that
kescience_alphafold.alphafold_entriesdoes not carry per-residue pLDDT or structural-feature data; either ingest those features or compute them from PDB files as a derived BERDL collection. - Verify the two remaining tenant→agency mappings (
evaluation,lambda) with program documentation; folded user-confirmed corrections forphagefoundry(DOE BRaVE) andmsyscolo(DOE/NSF) are already indata/tenant_to_agency.csv. - Refresh the inventory as the lakehouse grows.
build_inventory.pyanddata_volume.pyare designed to be re-run; both rebuild the canonical CSVs from the live cluster in ~95 s and ~60 s respectively. Recommend re-running at each major BERDL ingest milestone. - Surface the atlas to KBase users. The audience messages in NB04 §3 + the per-entity headline numbers in NB05 are the seeds of a one-page BERDL data-availability summary that could live on the KBase / BERIL UI.
- Address NMDC multi-omics underuse. Per agent memory, NMDC’s metabolomics (3.1M), proteomics (346K), and lipidomics (1.4M) layers are largely untapped despite being a primary cross-validation source. UC4 (
nmdc ↔ protect) and UC5 (nmdc ↔ refdata) both ride on this layer.
References
- Price, M.N., Wetmore, K.M., Waters, R.J., Callaghan, M., Ray, J., Liu, H., Kuehl, J.V., Melnyk, R.A., Lamson, J.S., Suh, Y., et al. (2018). “Mutant phenotypes for thousands of bacterial genes of unknown function.” Nature 557, 503–509. PMID: 29769710. (FitnessBrowser primary citation.)
- Jumper, J., Evans, R., Pritzel, A., Green, T., Figurnov, M., Ronneberger, O., Tunyasuvunakool, K., Bates, R., Žídek, A., Potapenko, A., et al. (2021). “Highly accurate protein structure prediction with AlphaFold.” Nature 596, 583–589. PMID: 34265844.
- Tunyasuvunakool, K., Adler, J., Wu, Z., Green, T., et al. (2021). “Highly accurate protein structure prediction for the human proteome.” Nature 596, 590–596. PMID: 34293799. (AlphaFold structural-coverage scale-up.)
- The UniProt Consortium (2023). “UniProt: the Universal Protein Knowledgebase in 2023.” Nucleic Acids Research 51, D523–D531. PMID: 36408920.
- Berman, H.M., Westbrook, J., Feng, Z., Gilliland, G., Bhat, T.N., Weissig, H., Shindyalov, I.N., and Bourne, P.E. (2000). “The Protein Data Bank.” Nucleic Acids Research 28, 235–242. PMID: 10592235.
- Arkin, A.P., Cottingham, R.W., Henry, C.S., Harris, N.L., Stevens, R.L., Maslov, S., Dehal, P., Ware, D., Perez, F., Canon, S., et al. (2018). “KBase: The United States Department of Energy Systems Biology Knowledgebase.” Nature Biotechnology 36, 566–569. PMID: 29979655.
- Eloe-Fadrosh, E.A., Ahmed, F., Anubhav, et al. (2022). “The National Microbiome Data Collaborative Data Portal: an integrated multi-omics microbiome data resource.” Nucleic Acids Research 50, D828–D836. PMID: 34850110.
- Söhngen, C., Bunk, B., Podstawka, A., Gleim, D., and Overmann, J. (2014). “BacDive — The Bacterial Diversity Metadatabase.” Nucleic Acids Research 42, D592–D599. PMID: 24214959.
- Cook, C.E., Bergman, M.T., Cochrane, G., Apweiler, R., and Birney, E. (2018). “The European Bioinformatics Institute in 2017: data coordination and integration.” Nucleic Acids Research 46, D21–D29. PMID: 29186510. (Includes Rhea reaction reference.)
- Camargo, A.P., Roux, S., Schulz, F., Babinski, M., Xu, Y., Hu, B., Chain, P.S.G., Nayfach, S., and Kyrpides, N.C. (2024). “IMG/VR v4: an expanded database of uncultivated virus genomes.” Nucleic Acids Research 52, D741–D747. PMID: 37855702.
- Schmidt, T.S.B., Fullam, A., Ferretti, P., Orakov, A., Maistrenko, O.M., Ruscheweyh, H.-J., et al. (2023). “SPIRE: a Searchable, Planetary-scale Index of Metagenomic data and Reference genome assemblies.” Nucleic Acids Research 52, D777–D783. PMID: 37994744. (SPIRE MAG catalog.)
- Hurwitz, B.L., Lamberti, J., Ponsero, A., Gradi, K., Schreiber, K., and Schriml, L. (2020). “Planet Microbe: a platform for marine microbiology to discover and analyze interconnected ‘omics and environmental data.” Nucleic Acids Research 49, D792–D802. PMID: 33010169.
Authors
- Adam Arkin (University of California, Berkeley, ORCID: 0000-0002-4999-2931)