The BacDive phenotype analysis disagrees with itself about how well genome-encoded metal-resistance gene content predicts metal tolerance on its own. Its narrative calls the count of metal-resistance gene clusters (n_metal_clusters) the “true predictor” 1, a framing the central digest repeats. 2 Its own cross-validation (CV, testing models on held-out data) table gives that feature a low standalone fit. 1 The answer determines whether genome-based screening can replace taxonomy or only add to it, and what composite tolerance scores can support mechanistically (composite-resistance-score-limitations).
Evidence Sides
Side 1: Gene count as the dominant, standalone predictor (narrative and digest)
The report’s narrative states that n_metal_clusters explains more variance than all phenotype features combined, and substantially more than taxonomy alone. 1 It attributes most of the full model’s improvement to gene count, as a gain in R² (coefficient of determination, the share of variance explained) of delta R² = +0.28 over taxonomy alone. 1 The central digest repeats the “true predictor” framing. 2 It reports:
- Phenotype features alone yield R²=0.16, with 7/10 significant after FDR (false discovery rate) correction for multiple testing. 2
- Phenotype features add no predictive value to a taxonomy model (delta R²=-0.009). 2
- The full model with genomic metal-resistance gene count reaches R²=0.63. 2
- Urease-positive bacteria show lower tolerance (d=-0.18, a Cohen’s d standardized effect size), attributed to Actinomycetes lineage composition. 2
Side 2: Gene count as a weak standalone predictor (the report’s CV table)
The same report’s 5-fold phylogenetic-blocked CV table (n = 3,994; blocking keeps related taxa together within folds) reports these R² values: 1
- Gene count only: 0.063 1
- Phenotype only: 0.163 1
- Taxonomy only: 0.354 1
- Taxonomy plus phenotype: 0.345 1
- Full model: 0.633 1
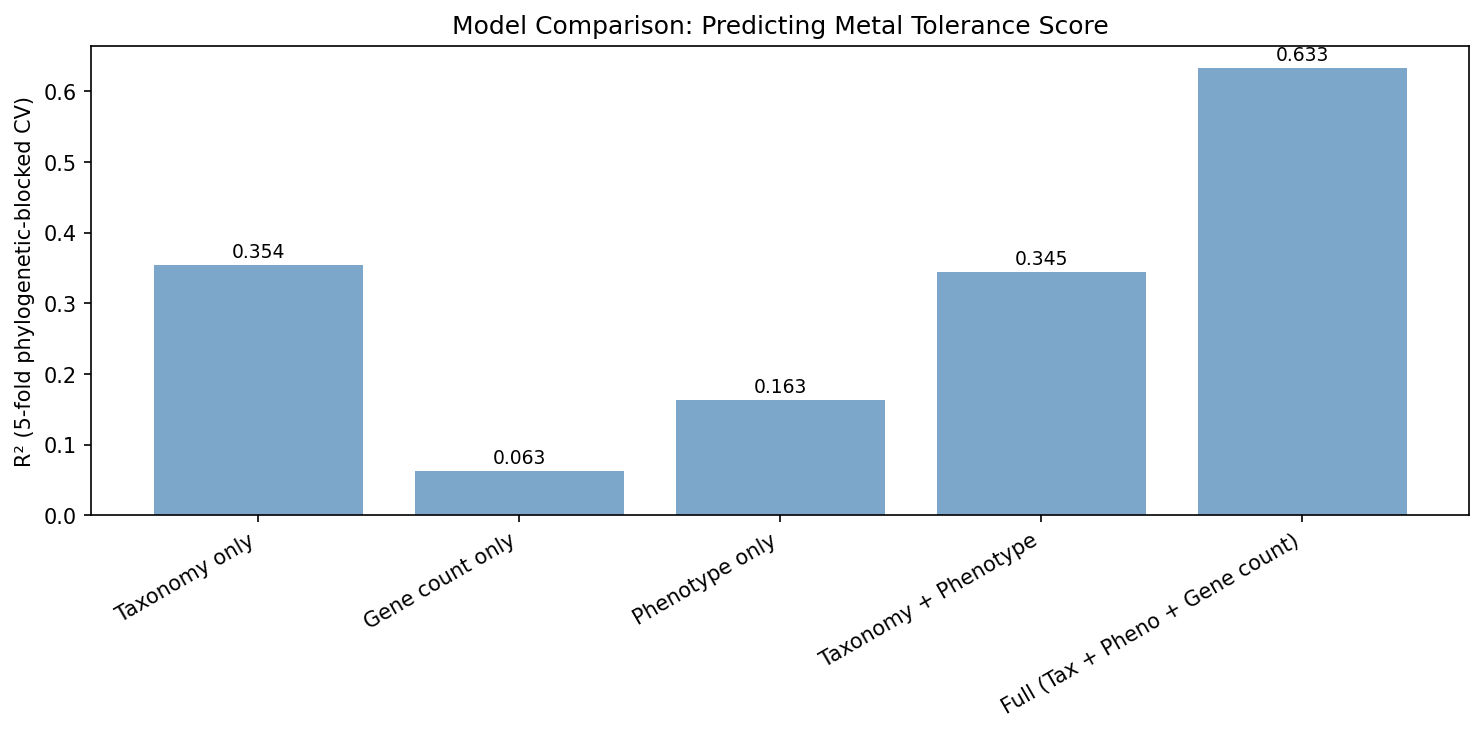 Model comparison. From bacdive_phenotype_metal_tolerance.
In this table, gene count alone fits worse than phenotype alone and worse than taxonomy alone, contradicting the narrative’s standalone claim. 1
Possible Reconciliations
- Hypothesis: conditional contribution. The tabled values are compatible with gene count contributing conditionally on taxonomy rather than acting as a strong standalone predictor. 1 Under this reading, the large full-model gain reflects gene count explaining variance left over within lineages.
- Hypothesis: different comparison bases. The narrative’s “more variance than phenotype features combined” may refer to an incremental contribution within the full model, not to the gene-count-only model. The narrative and table would then be answering different questions. This is untested.
- Hypothesis: digest compression. The digest may have carried forward the narrative framing without the table’s standalone values. If so, the tension sits in the report and propagated to the digest, rather than being independent corroboration.
None of these is established. The tension should not be settled by preferring either the narrative or the table. 1
Resolving Work
- Missing model: fit taxonomy plus gene count (no phenotypes) on the same n = 3,994 species under the same 5-fold phylogenetic-blocked CV 1, testing whether gene count’s gain depends on taxonomy.
- Partial contributions: partition variance into unique and shared R² for taxonomy, phenotype and gene count on the same folds, attributing full-model fit to each component or their overlap.
- Within-class tests: regress tolerance on
n_metal_clusterswithin individual taxonomic classes to test whether gene count predicts tolerance with lineage held fixed. - Narrative audit: identify the model comparison behind the narrative’s “more variance than all phenotype features combined” statement, and reconcile the digest’s “true predictor” wording with the CV table.