Key Findings
Finding 1: Host-Associated Pseudomonas Show Dramatic Loss of Plant-Derived Sugar Pathways
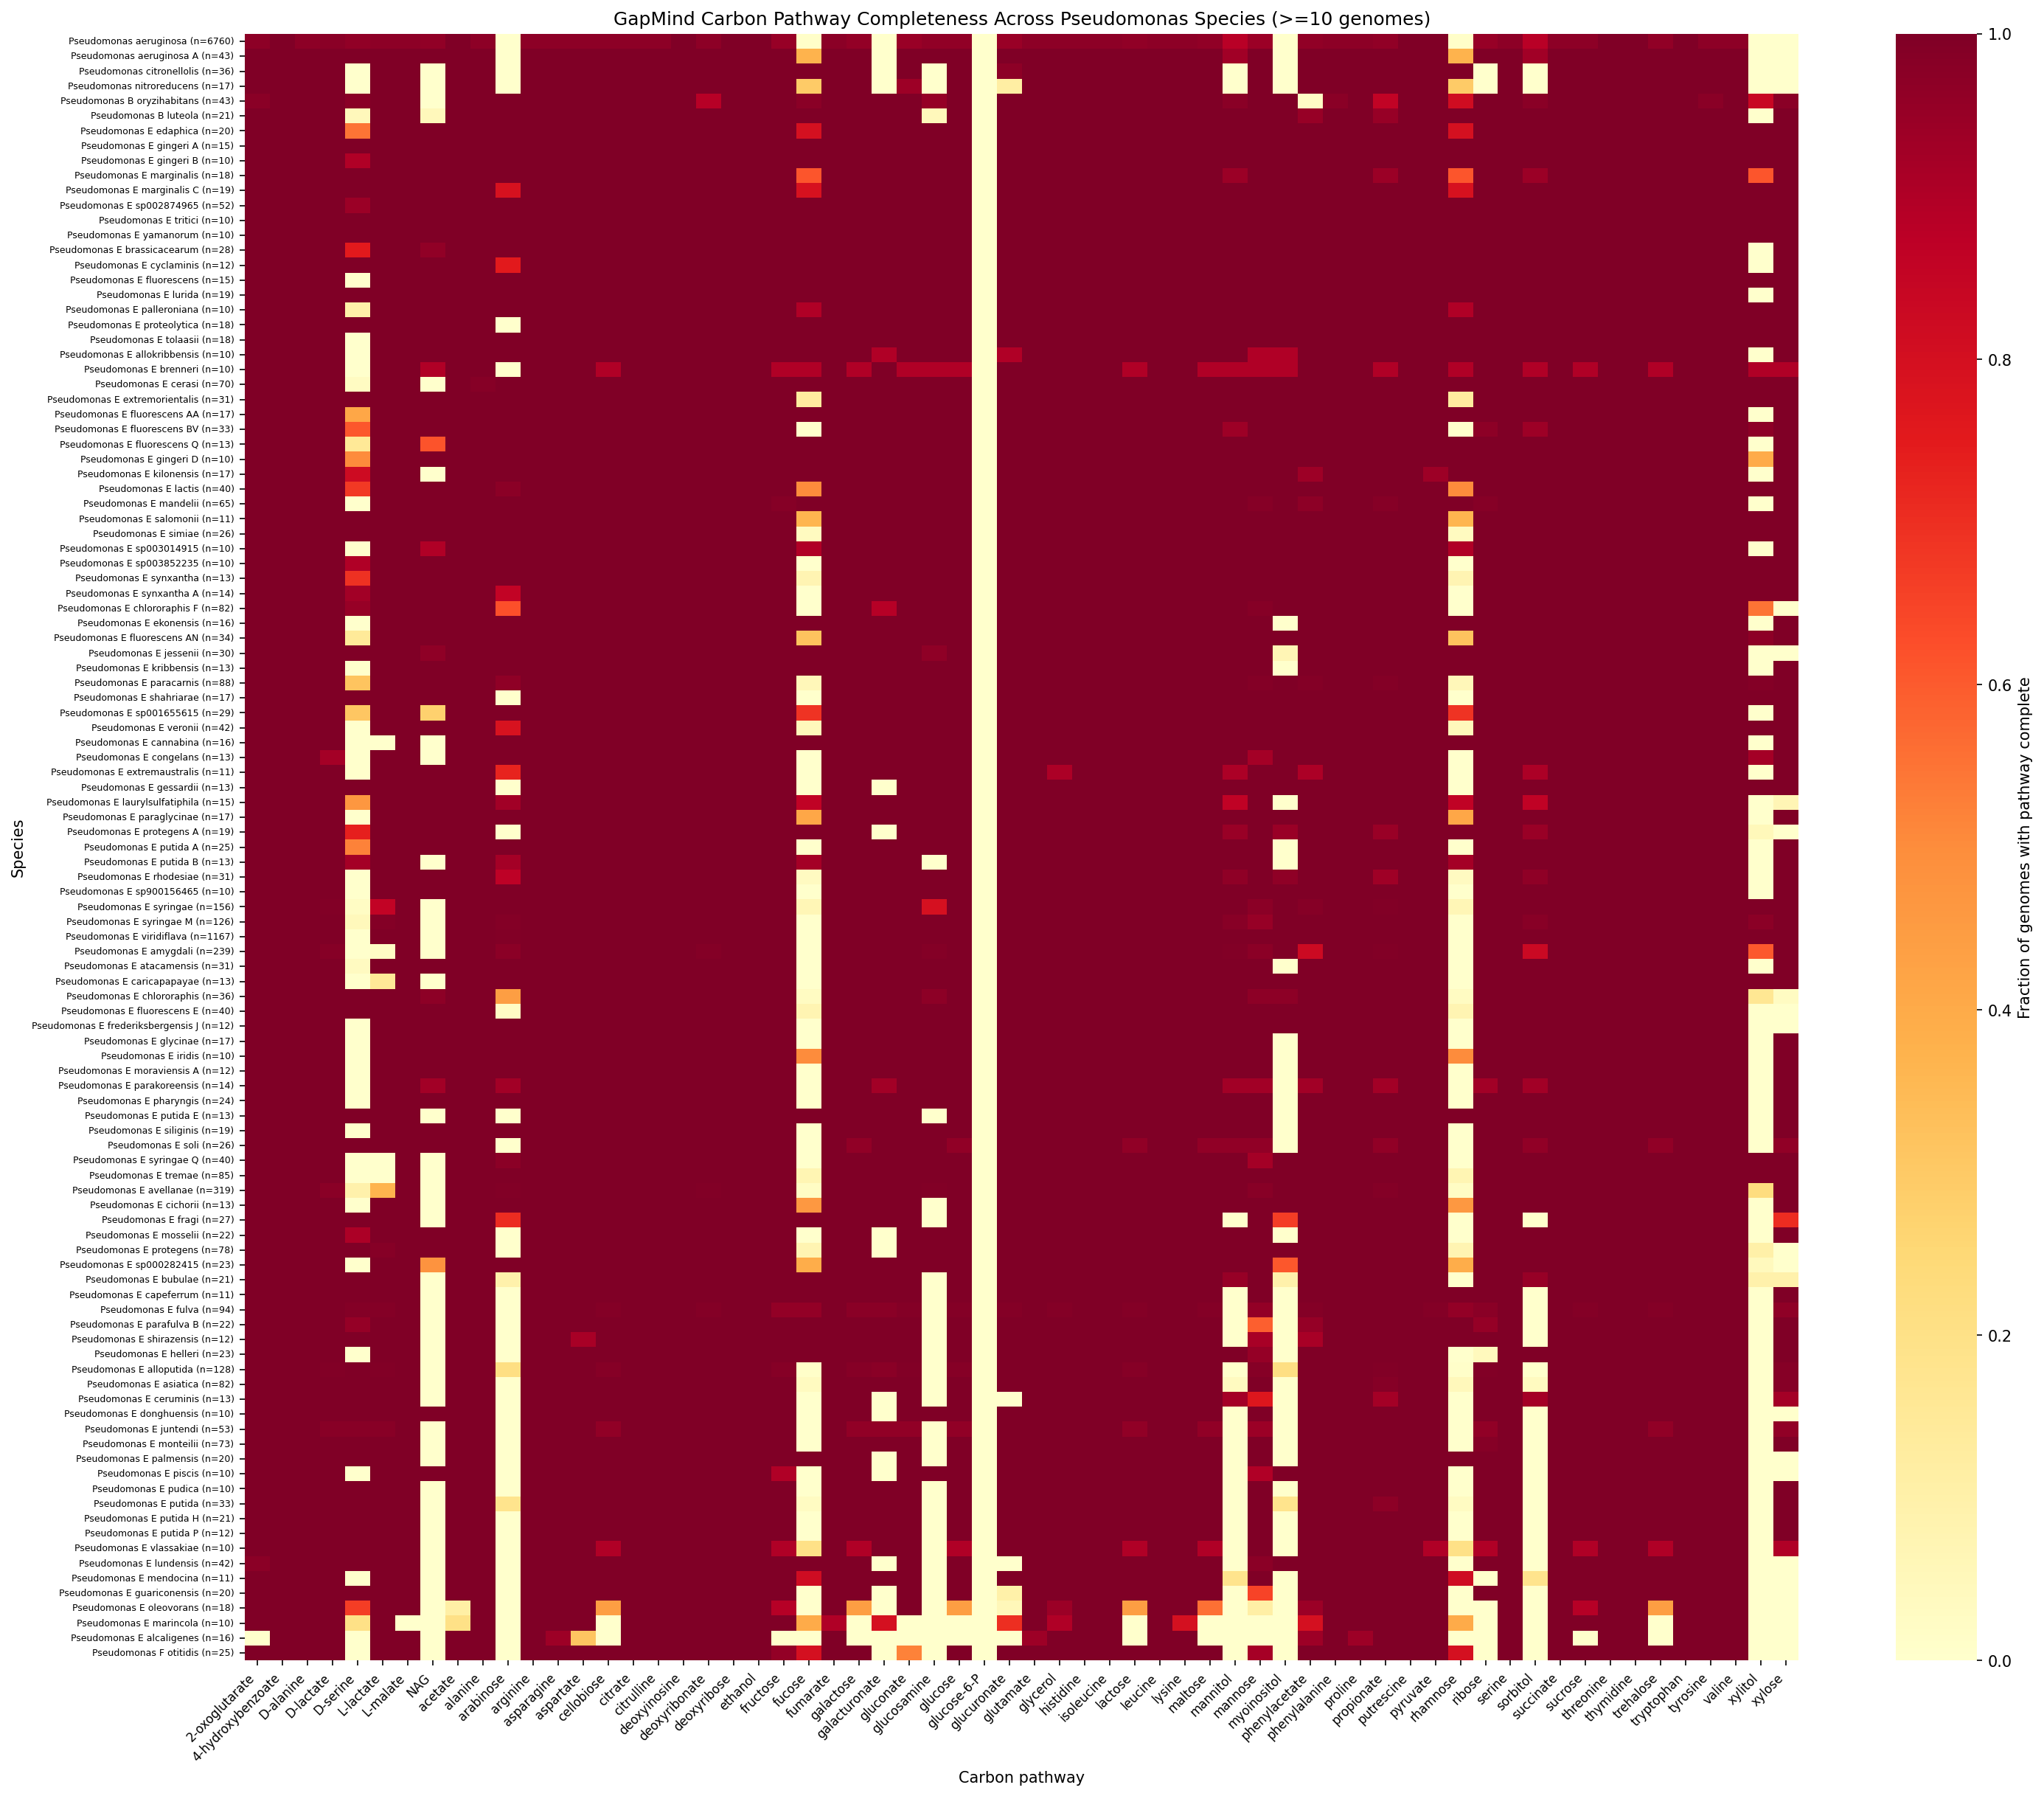
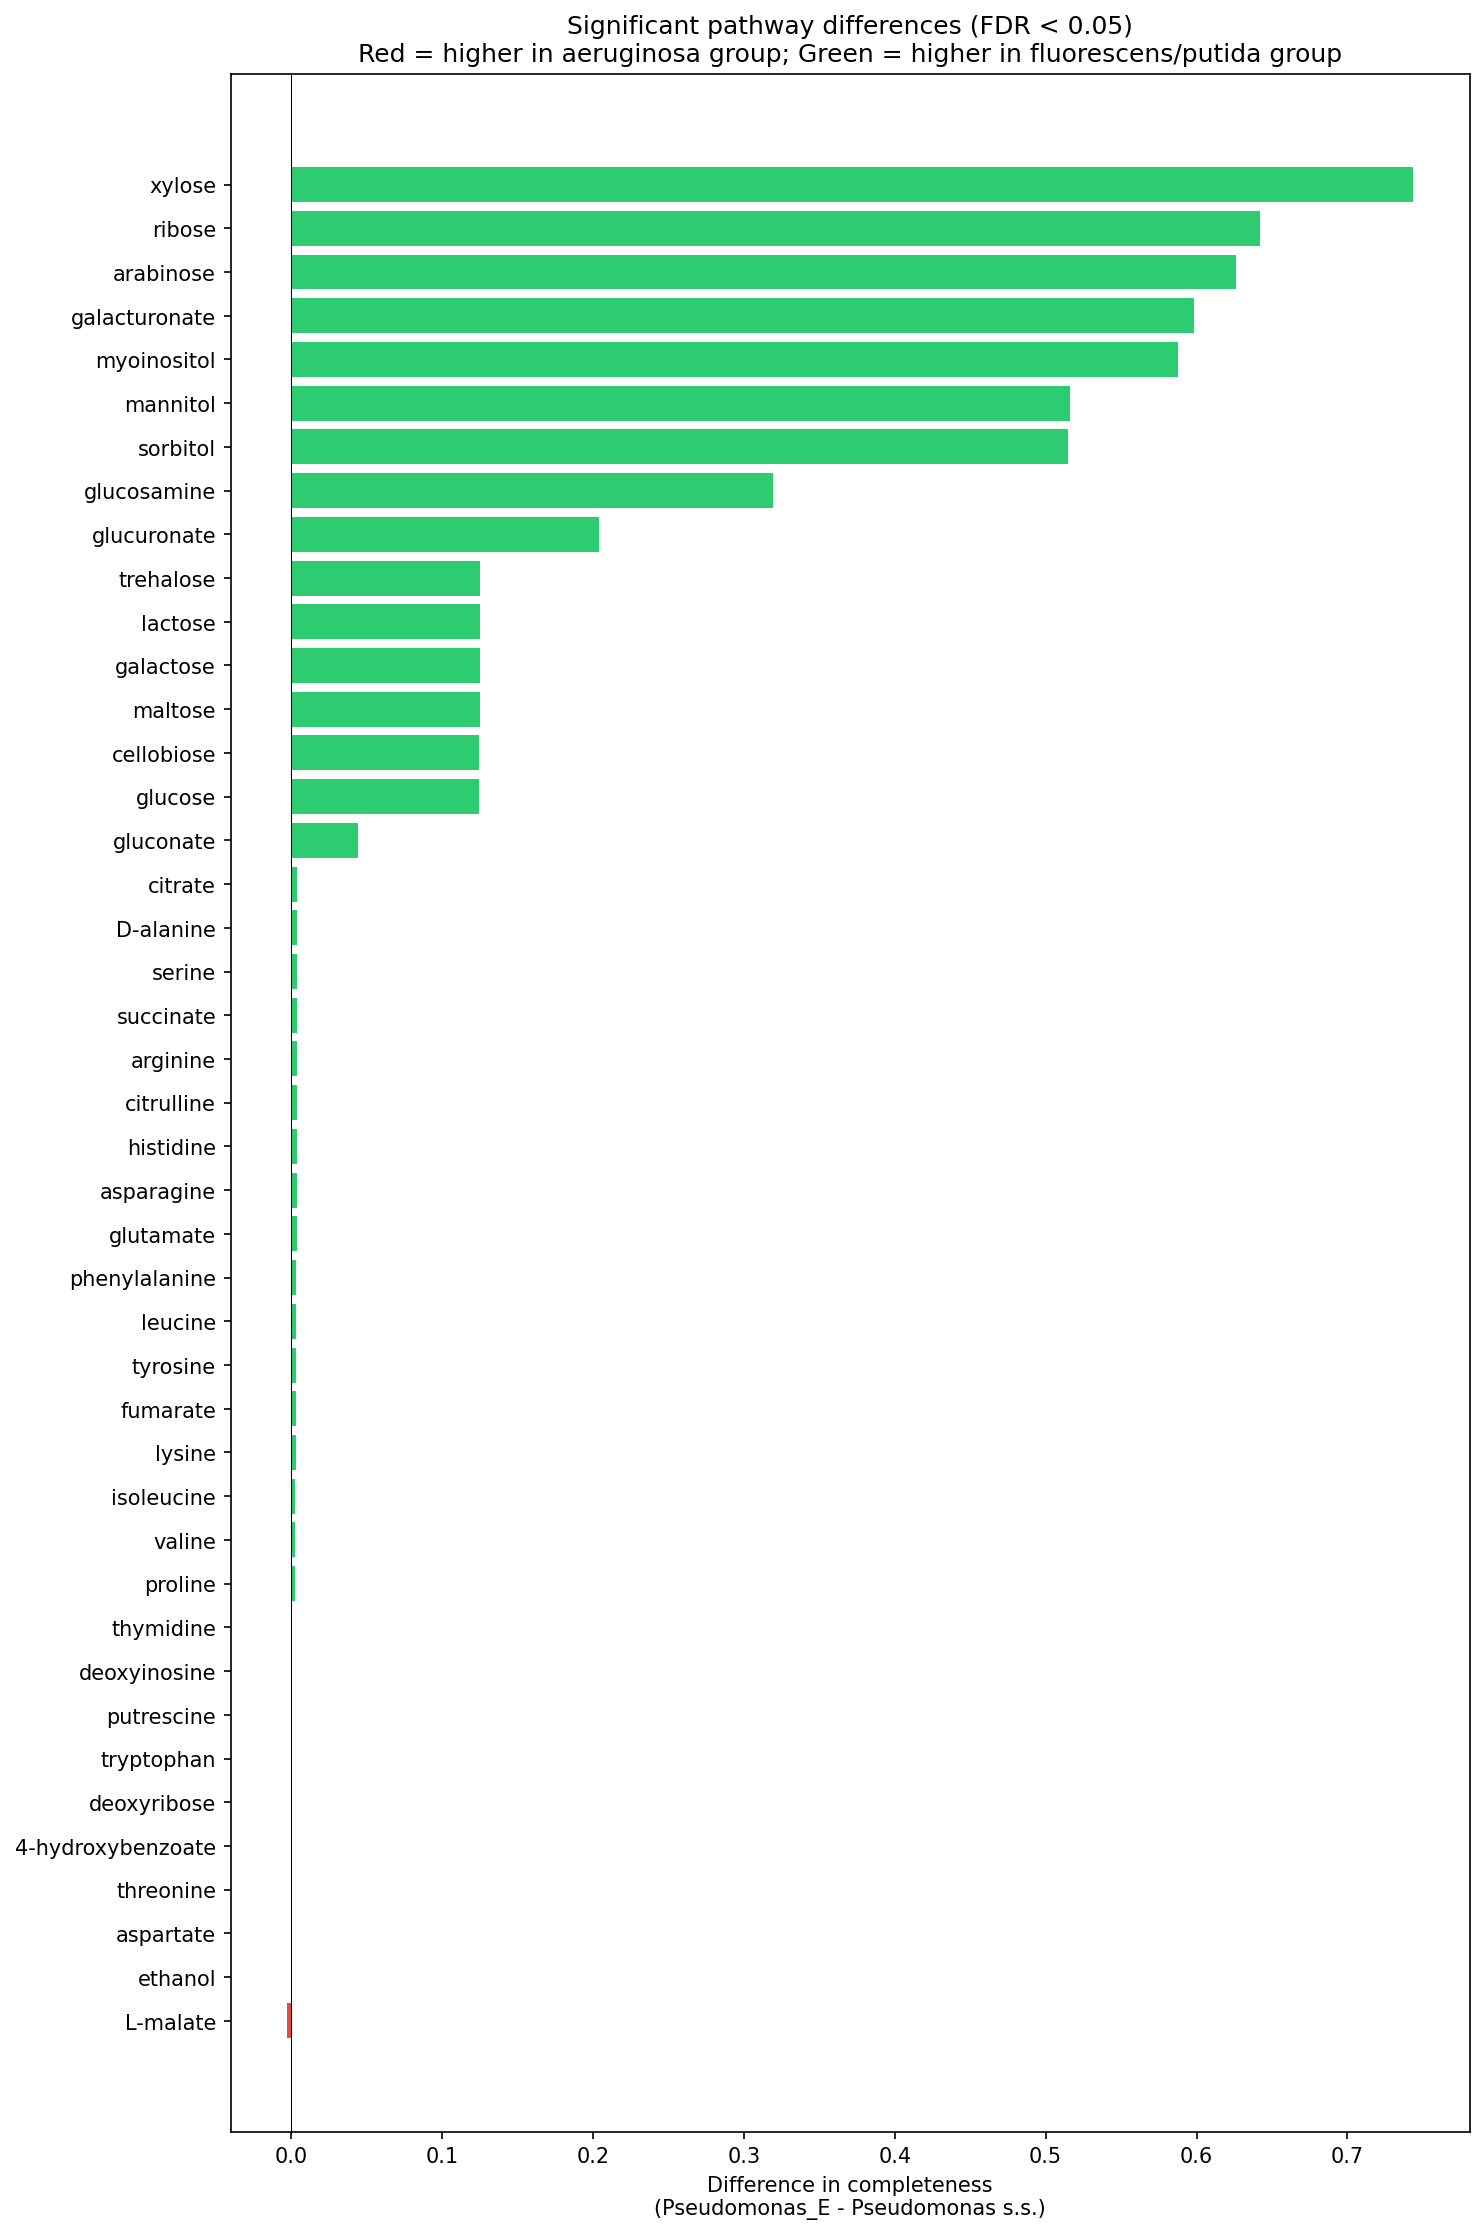
Pseudomonas sensu stricto (the P. aeruginosa group) shows near-complete loss of plant-derived sugar catabolism compared to Pseudomonas_E (the P. fluorescens/putida group). Of the 62 GapMind carbon pathways tested, 43 differ significantly between the two subgenera (Mann-Whitney U, BH-FDR < 0.05). The largest effect sizes involve pathways for plant-associated sugars and sugar alcohols:
| Pathway | P. aeruginosa group | P. fluorescens group | Difference |
|---|---|---|---|
| Xylose | 0.0% | 74.4% | +74.4 pp |
| Ribose | 27.9% | 92.0% | +64.2 pp |
| Arabinose | 0.0% | 62.6% | +62.6 pp |
| Galacturonate | 28.6% | 88.4% | +59.8 pp |
| Myo-inositol | 0.0% | 58.8% | +58.8 pp |
| Mannitol | 25.9% | 77.5% | +51.6 pp |
| Sorbitol | 25.9% | 77.4% | +51.5 pp |
In contrast, amino acid catabolism (arginine, histidine, serine, glutamate, etc.) and core organic acid pathways (citrate, succinate, pyruvate) remain near-universal (>99%) in both groups. This is consistent with P. aeruginosa retaining amino acid catabolism for growth in host environments (e.g., CF sputum amino acids) while losing the ability to degrade plant-derived carbon sources it no longer encounters.
(Notebook: 03_pathway_lifestyle_analysis.ipynb)
Finding 2: Carbon Pathway Profiles Distinguish Environment Types Among Free-Living Species
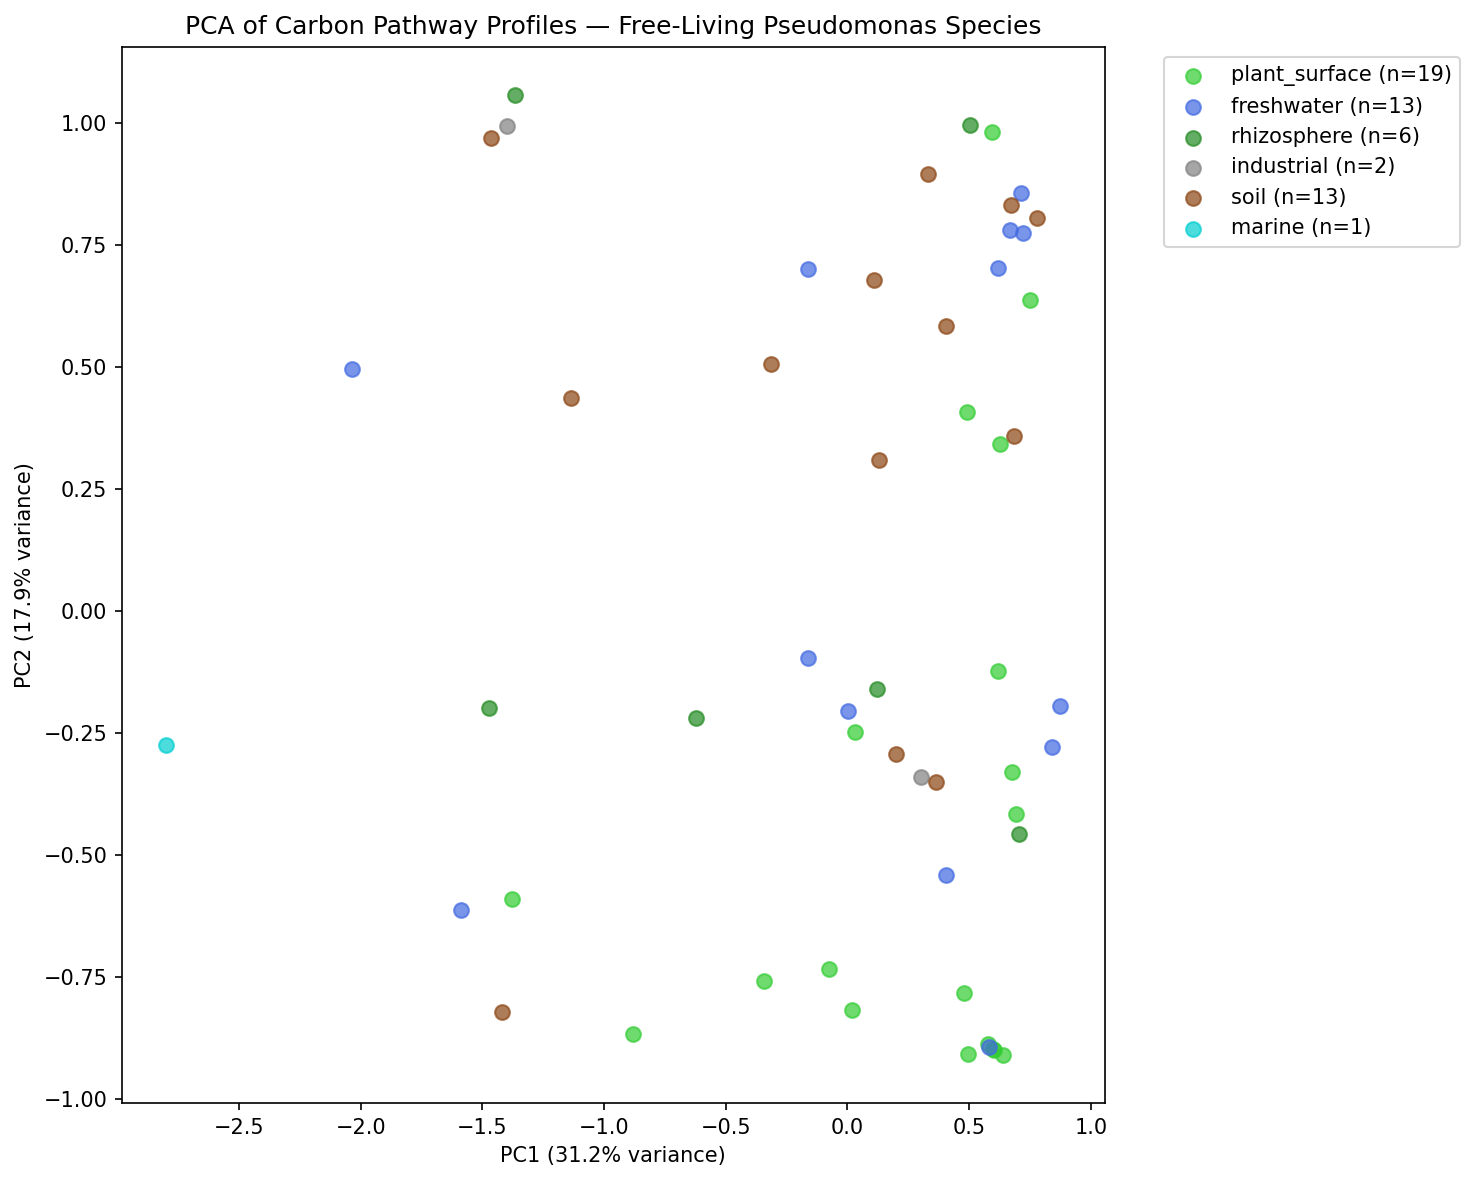
Among 54 free-living and plant-associated species (>=5 genomes, >=60% majority environment agreement), carbon pathway profiles are significantly associated with isolation environment. A PERMANOVA-like permutation test (999 permutations) yielded p = 0.006, with between-group mean distance (2.054) exceeding within-group mean distance (1.890). PCA of the 62-pathway profiles captured 74.9% of variance in the first 5 components, with PC1 alone explaining 31.2%.
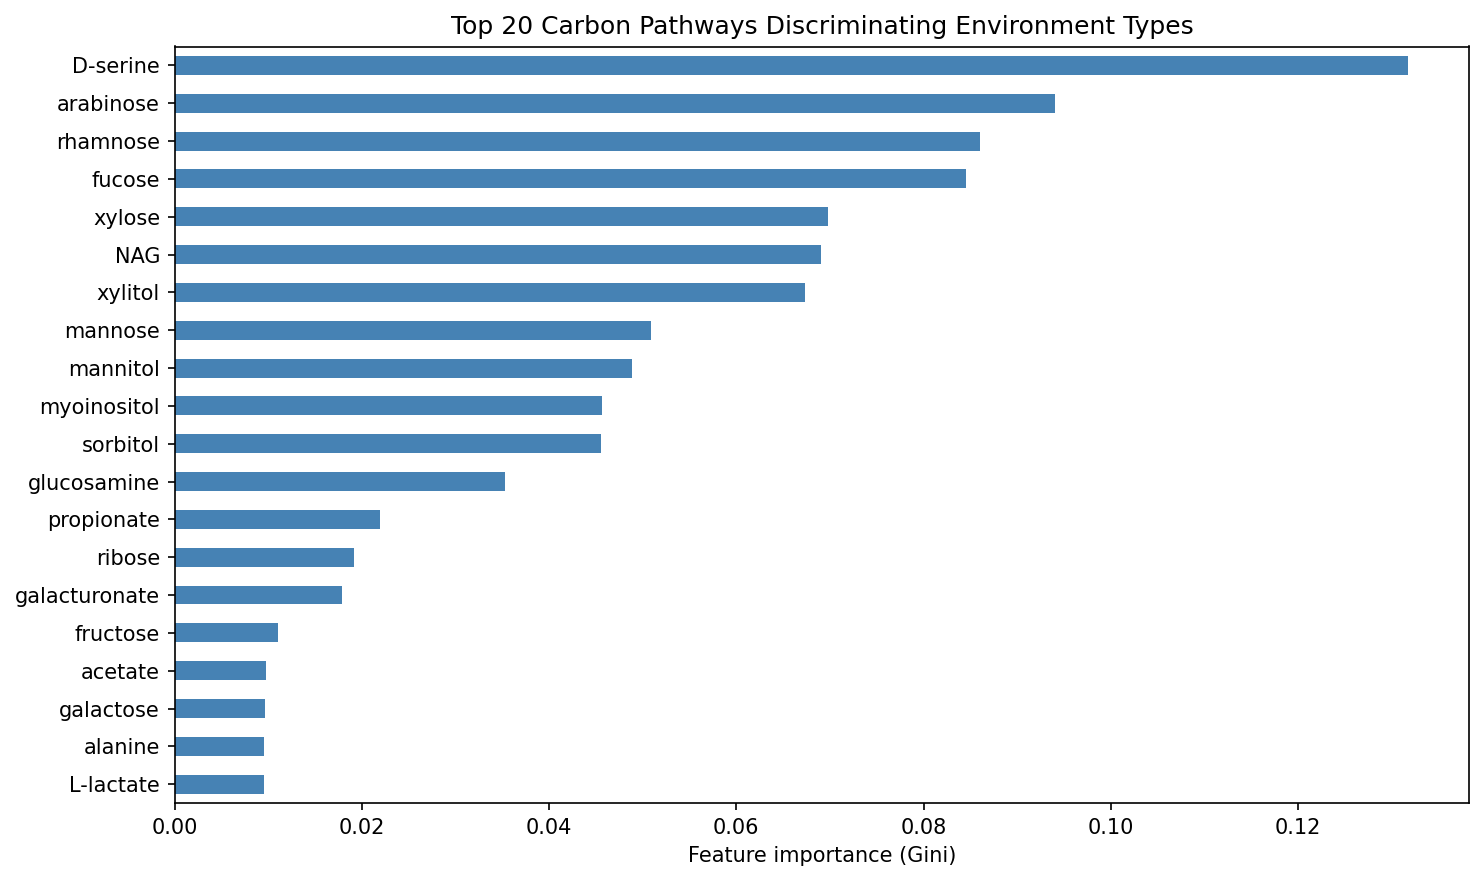
A Random Forest classifier trained on 4 environment classes (soil, freshwater, plant_surface, rhizosphere; 51 species total) achieved balanced accuracy of 0.408 +/- 0.169, substantially above the 0.250 chance level. While not strongly predictive, this confirms that carbon pathway profiles carry ecological signal. The top discriminating pathways were:
- D-serine (importance: 0.132) — associated with rhizosphere niches
- Arabinose (0.094) — plant-derived pentose sugar
- Rhamnose (0.086) — plant cell wall component
- Fucose (0.085) — plant/animal glycan sugar
- Xylose (0.070) — hemicellulose-derived sugar
(Notebook: 04_ecology_prediction.ipynb)
Finding 3: Free-Living Species Have Greater Pathway Richness Than Host-Associated Species
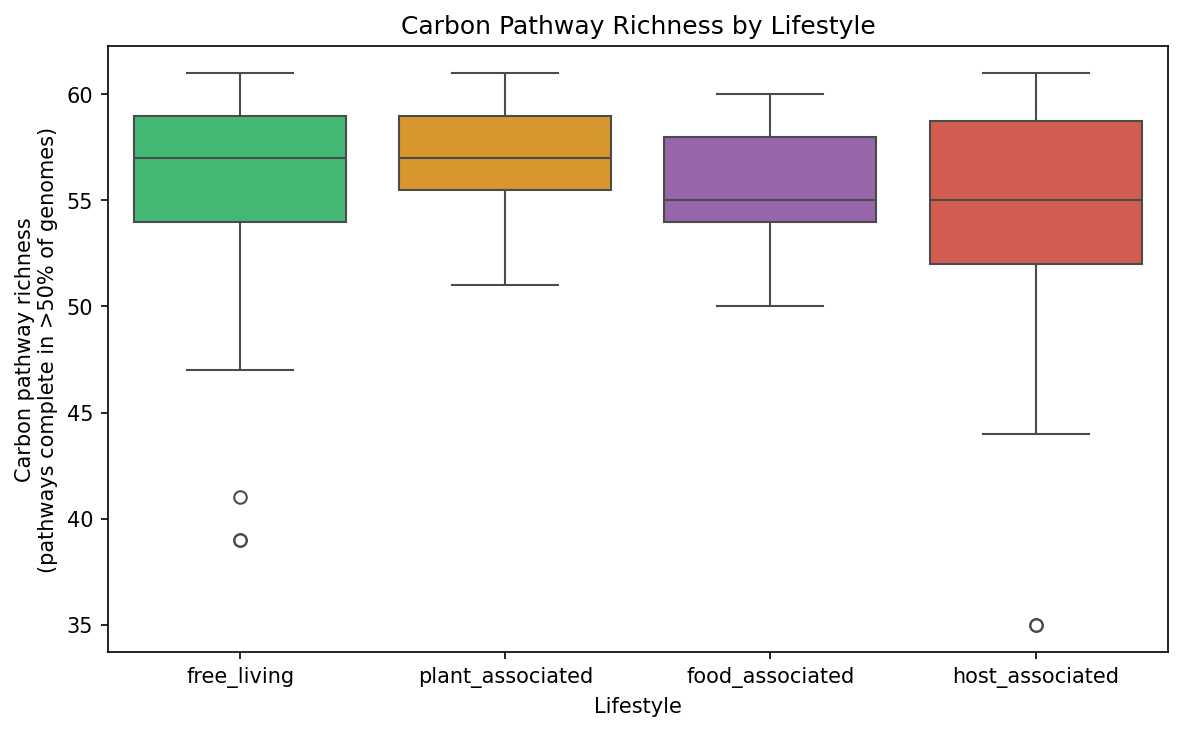
Across all Pseudomonas species with >= 5 genomes, free-living and plant-associated species maintain higher carbon pathway richness (median = 57 pathways complete in >50% of genomes) than host-associated species (median = 55). Within the Pseudomonas_E subgenus alone (controlling for deep phylogenetic divergence), the same trend holds: plant-associated species average 56.7 pathways, free-living 56.1, and host-associated 55.2.
(Notebook: 04_ecology_prediction.ipynb)
Finding 4: The Aeruginosa-Fluorescens Split Dominates Carbon Pathway Variation
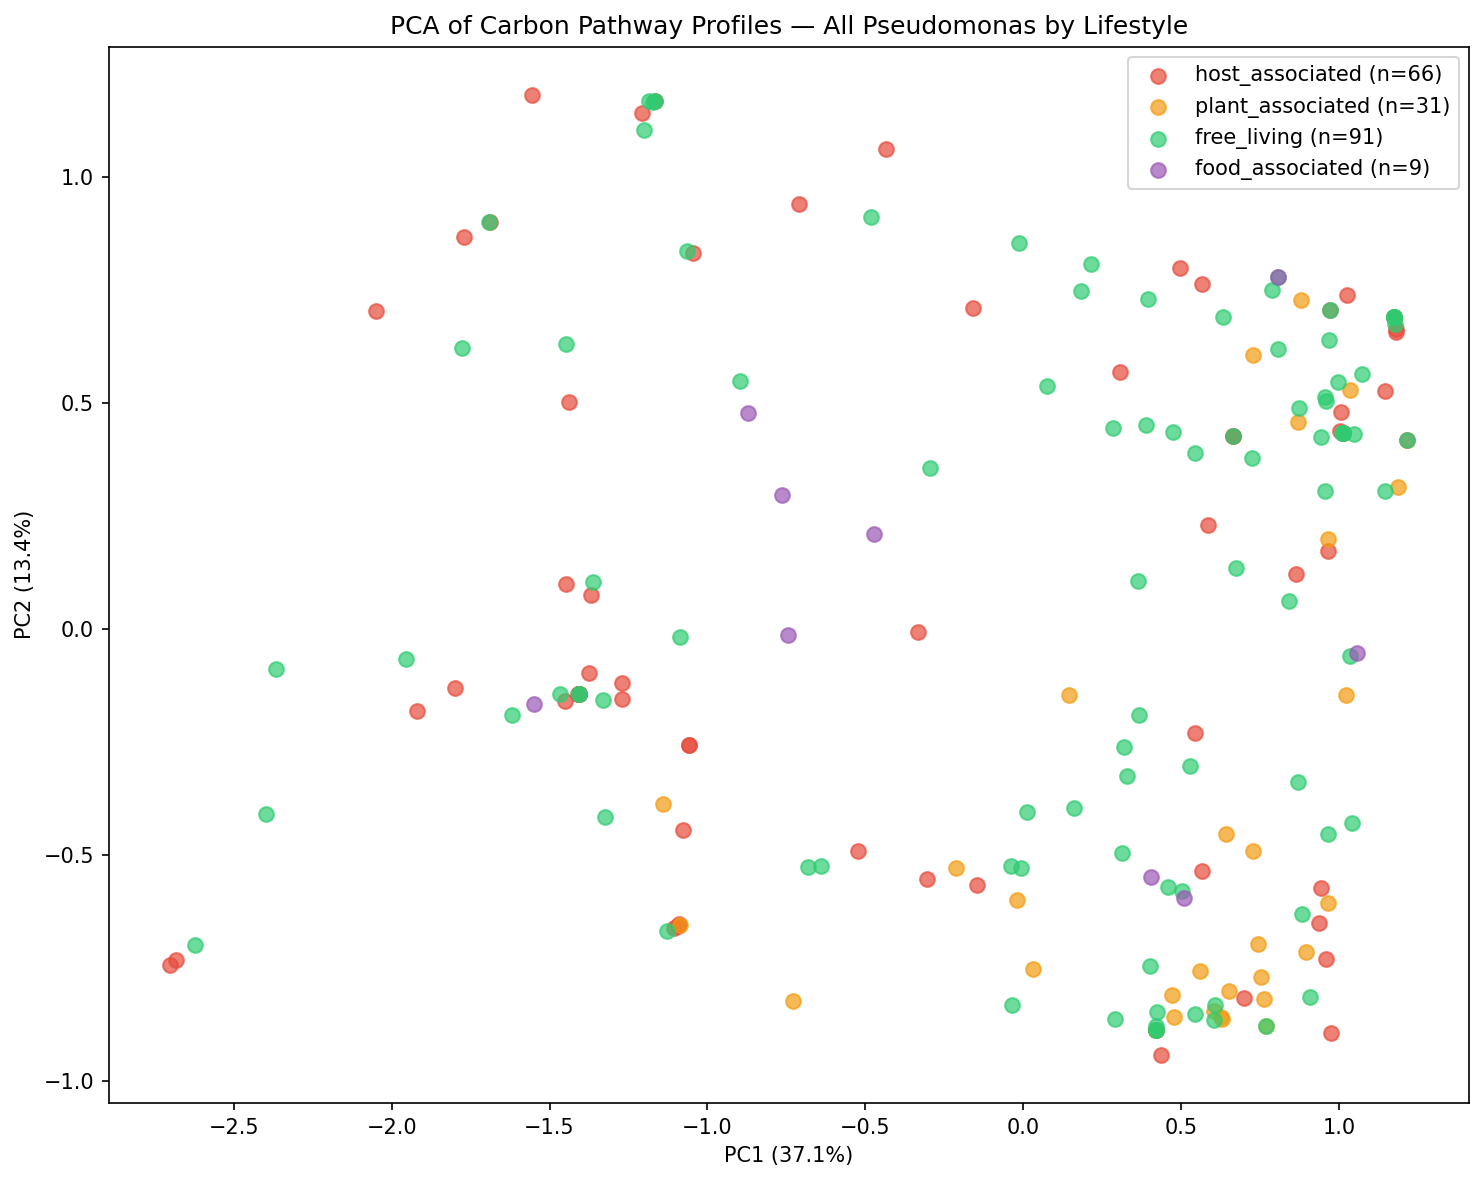
PCA of all species’ pathway profiles reveals that the primary axis of variation separates Pseudomonas s.s. from Pseudomonas_E, driven by the dramatic sugar pathway loss described in Finding 1. Within Pseudomonas_E, lifestyle categories (free-living, host-associated, plant-associated) show substantial overlap, indicating that the lifestyle-associated variation within this subgenus is more subtle than the deep phylogenetic divide.
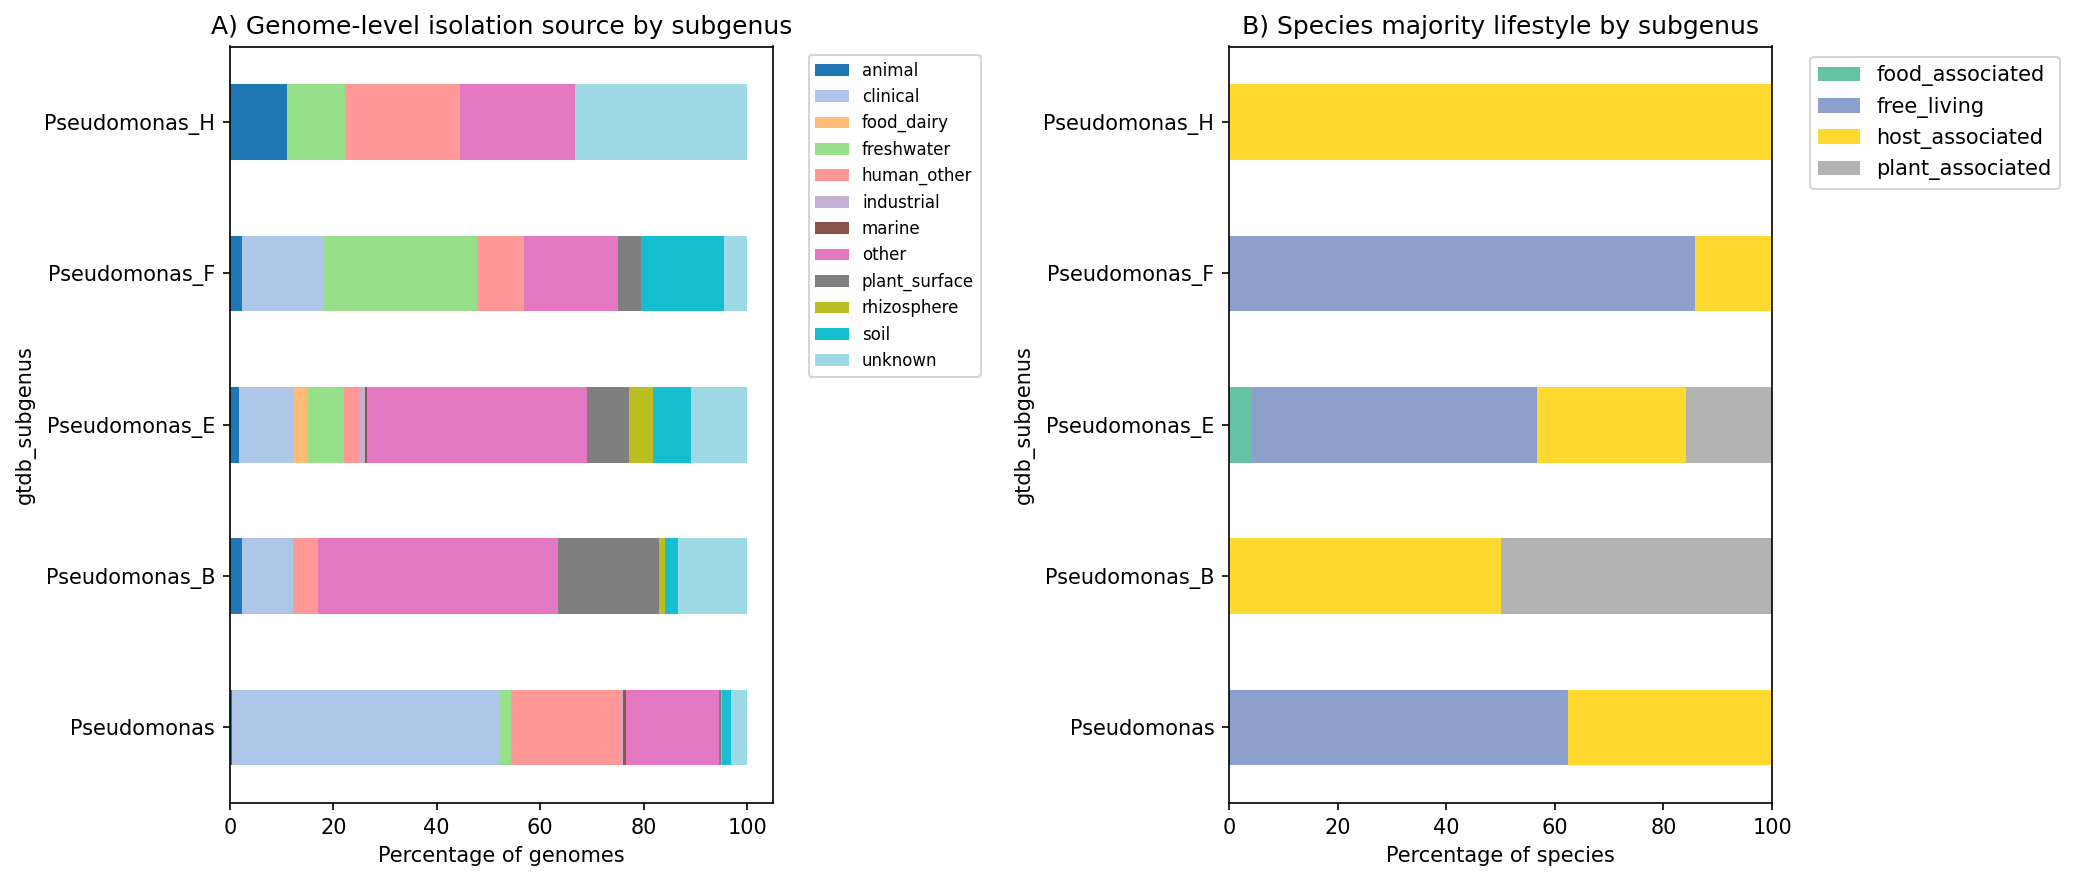
(Notebooks: 02_environment_harmonization.ipynb, 04_ecology_prediction.ipynb)
Results
Data Scale and Environment Classification
From the BERDL kbase_ke_pangenome collection, we extracted GapMind carbon pathway predictions for 12,732 genomes across 433 Pseudomonas species clades (GTDB r214). The genus spans 5 GTDB subgenera, dominated by Pseudomonas s.s. (19 species, 6,905 genomes — primarily P. aeruginosa) and Pseudomonas_E (398 species, 5,687 genomes — P. fluorescens, P. putida, P. syringae groups).
Isolation source metadata was available for 64.2% of genomes (8,171/12,732 with classifiable sources). Keyword-based classification assigned genomes to 10 environment categories:
| Category | Genomes | % of total |
|---|---|---|
| Clinical | 4,197 | 33.0% |
| Human (other) | 1,659 | 13.0% |
| Freshwater | 566 | 4.4% |
| Soil | 551 | 4.3% |
| Plant surface | 503 | 4.0% |
| Rhizosphere | 275 | 2.2% |
| Food/dairy | 141 | 1.1% |
| Animal | 136 | 1.1% |
| Industrial | 80 | 0.6% |
| Marine | 63 | 0.5% |
At the species level, 387 of 433 species had at least one classifiable genome, yielding majority-lifestyle assignments: 204 free-living, 109 host-associated, 59 plant-associated, and 15 food-associated.
Pathway Completeness Profiles
Species-level pathway completeness was computed as the fraction of genomes in which each of 62 GapMind carbon pathways was scored “complete” or “likely_complete.” Mean pathway completeness across all species was 0.882. Pathway richness (pathways complete in >50% of genomes) ranged from 27 to 61 (mean = 54.6), confirming substantial interspecific variation in metabolic breadth.
Subgenus-Level Comparison (H1b)
Comparing the 7 Pseudomonas s.s. species with the 189 Pseudomonas_E species (each with >=5 genomes), Mann-Whitney U tests with Benjamini-Hochberg FDR correction identified 43 of 62 pathways as significantly different (q < 0.05). All 7 pathways with differences exceeding 50 percentage points involved plant-derived sugars or sugar alcohols absent from P. aeruginosa but prevalent in P. fluorescens group species.
Nineteen pathways showed no significant difference between subgenera. These “shared core” pathways include: acetate, pyruvate, fructose, L-lactate, D-lactate, glycerol, alanine, sucrose, 2-oxoglutarate, propionate, phenylacetate, deoxyribonate, and glucose-6-phosphate — representing universally conserved central carbon metabolism.
Notably, rhamnose and fucose are more complete in P. aeruginosa (66.8%) than P. fluorescens group (41.3% and 45.1% respectively), though this difference was not statistically significant after FDR correction. This may reflect P. aeruginosa’s use of rhamnolipids as virulence factors.
Ecology Prediction (H1a)
Among 54 free-living and plant-associated species, PCA revealed that the first 5 principal components captured 74.9% of variance (PC1: 31.2%, PC2: 17.9%). The PERMANOVA-like test (comparing within-group vs. between-group Euclidean distances, 999 permutations) yielded a between/within ratio of 1.087 (p = 0.006), confirming that environment categories are significantly associated with pathway profiles.
Random Forest classification into 4 environment classes (soil: 13, freshwater: 13, plant_surface: 19, rhizosphere: 6; n = 51 after filtering) achieved balanced accuracy of 0.408 +/- 0.169 (5-fold stratified CV), above the 0.250 chance baseline. The moderate accuracy likely reflects: (1) small sample sizes per class, (2) overlap between related environment types (e.g., soil vs. rhizosphere), and (3) the relatively coarse resolution of 62 GapMind pathways.
Interpretation
Hypothesis Assessment
H1b (pathway loss in host-associated clades): Strongly supported. The P. aeruginosa group shows near-complete loss of xylose, arabinose, and myo-inositol catabolism (0% vs. 59-74% in P. fluorescens group), along with dramatic reductions in ribose, galacturonate, mannitol, and sorbitol pathways. These are precisely the plant-derived carbon sources predicted to be irrelevant in host environments where amino acids and organic acids dominate.
H1a (ecology prediction from carbon profiles): Partially supported. Environment categories are significantly non-random in carbon pathway space (PERMANOVA p = 0.006), but predictive accuracy is modest (RF balanced accuracy 0.41). Carbon profiles carry real ecological signal but are insufficient alone to discriminate fine-grained environment types among free-living species.
Literature Context
The loss of plant sugar catabolism in P. aeruginosa is consistent with La Rosa et al. (2018), who tracked P. aeruginosa metabolic adaptation in CF lungs and found convergent loss of carbon catabolism with retained amino acid utilization. Our genome-scale results quantify this pattern across the entire genus rather than within a single species during infection. Mathee et al. (2008) showed that P. aeruginosa maintains a mosaic genome architecture with strain-specific regions of genomic plasticity, but our results demonstrate that the sugar pathway losses are conserved at the species level, not strain-specific.
Palmer et al. (2007) demonstrated that CF sputum is dominated by amino acids (especially aromatic amino acids) as carbon sources, providing the ecological explanation for why P. aeruginosa retains amino acid pathways while losing sugar catabolism. Flynn et al. (2016) further showed that P. aeruginosa relies on amino acids and short-chain fatty acids derived from anaerobic mucin-fermenting bacteria in CF airways, reinforcing this amino acid-centric nutrition. Our finding that amino acid pathways (arginine, histidine, serine, glutamate) remain >99.5% complete in P. aeruginosa despite loss of plant sugars aligns with this nutritional specialization.
Silby et al. (2011) and Loper et al. (2012) highlighted the metabolic diversity of P. fluorescens group genomes, with ~54% of their pangenome encoding variable metabolic capabilities. Belda et al. (2016) documented 92 catabolic pathways in the re-annotated P. putida KT2440 genome, and Nikel & de Lorenzo (2018) emphasized P. putida’s broad carbon source utilization spanning sugars, organic acids, and aromatics. Our analysis now quantifies this at genus scale: the P. fluorescens/putida group maintains substantially greater carbon pathway breadth (mean richness 56.1) compared to P. aeruginosa (mean richness ~50), particularly in sugar and sugar alcohol catabolism.
Rossi et al. (2021) documented that chronic P. aeruginosa infections involve progressive loss of metabolic versatility. Our results suggest that much of this “loss” is not acquired during infection but rather reflects the ancestral metabolic streamlining of the P. aeruginosa lineage itself — these pathways were already absent at the species level across thousands of isolates.
Saati-Santamaria et al. (2022) analyzed 3,274 Pseudomonas genomes and found functional divergence dependent on ecological niche, with environment-specific metabolic pathway sets. Our PERMANOVA result (p = 0.006) aligns with their finding, and extends it by using standardized GapMind pathway predictions rather than KEGG-based annotations. Ghirardi et al. (2012) showed that rhizosphere competence in fluorescent pseudomonads was associated with catabolic profile diversity, consistent with our finding that D-serine, arabinose, and rhamnose are the top discriminating pathways for environment prediction.
The modest predictive accuracy for fine-grained environment type (0.41) within free-living species is consistent with Guo et al. (2026), who found that hydrocarbon degradation genes are concentrated in the accessory genome and show strain-level rather than species-level variation. GapMind’s 62 carbon pathways (Price et al. 2022) may be too coarse to capture the niche-specific metabolic differences that operate at the strain level within environmental species.
Novel Contribution
This is the first study to systematically quantify carbon pathway profiles across the full breadth of Pseudomonas (433 species, 12,732 genomes) using standardized pathway predictions. The key novel findings are:
-
Scale of sugar pathway loss: The magnitude of difference (>50 pp for 7 pathways, >10 pp for 15 pathways) between host-associated and free-living subgenera, quantified across thousands of genomes, provides the most comprehensive evidence to date for metabolic streamlining in host-adapted Pseudomonas.
-
Plant-specific carbon sources: The specific pathways lost (xylose, arabinose, myo-inositol, galacturonate) are precisely those involved in plant cell wall and rhizosphere carbon cycling, consistent with release from selection for plant-associated metabolism during the transition to animal host environments.
-
Ecological signal in carbon profiles: The significant PERMANOVA result (p = 0.006) demonstrates that even among free-living species, carbon pathway composition is non-randomly associated with isolation environment, providing evidence for metabolic niche partitioning within the genus.
Limitations
-
Sampling bias: P. aeruginosa comprises 53% of all genomes (6,760/12,732) due to clinical importance, while many environmental species have <10 sequenced genomes. This imbalance affects the power of species-level comparisons.
-
Isolation source quality: Keyword-based classification from free-text isolation sources introduced ~6.7% “unknown” and ~29.1% “other” classifications. Misclassification could attenuate true ecological signal.
-
GapMind pathway resolution: The 62 GapMind carbon pathways cover common carbon sources but miss genus-specific catabolic capabilities, particularly aromatic degradation pathways (toluene, naphthalene, benzoate) that are central to P. putida ecology.
-
Phylogenetic confounding: The dominant signal in PCA separates subgenera rather than lifestyles. Within Pseudomonas_E, lifestyle-associated differences are subtle, and the analyses do not explicitly control for phylogenetic non-independence among species.
-
Majority-vote environment assignment: Assigning species to a single environment category based on majority vote obscures genuinely generalist species that inhabit multiple environments.
Data
Sources
| Collection | Tables Used | Purpose |
|---|---|---|
kbase_ke_pangenome | pangenome, gapmind_pathways, genome, ncbi_env, sample, gtdb_metadata, gtdb_taxonomy_r214v1 | Species pangenome stats, carbon pathway predictions, isolation source metadata, taxonomy |
Generated Data
| File | Rows | Description |
|---|---|---|
data/pseudomonas_species.csv | 433 | Species-level pangenome statistics (genome count, core fraction, subgenus) |
data/carbon_pathway_scores.csv | 789,012 | Genome-level best GapMind scores for 62 carbon pathways |
data/isolation_sources.csv | 12,732 | Raw isolation source text from NCBI and GTDB metadata |
data/genome_environment.csv | 12,732 | Per-genome environment and lifestyle classification |
data/species_lifestyle.csv | 387 | Per-species majority environment, lifestyle, and diversity |
data/species_pathway_profiles.csv | 433 | Species x 62 pathway completeness matrix |
data/subgenus_pathway_comparison.csv | 62 | Mann-Whitney U test results for each pathway between subgenera |
Supporting Evidence
Notebooks
| Notebook | Purpose |
|---|---|
01_data_extraction.ipynb | Extract Pseudomonas species, GapMind carbon pathways, and isolation sources from BERDL |
02_environment_harmonization.ipynb | Classify genomes into ecological categories; aggregate to species-level lifestyles |
03_pathway_lifestyle_analysis.ipynb | Compare pathway completeness between subgenera and lifestyles (H1b) |
04_ecology_prediction.ipynb | PCA, PERMANOVA, and Random Forest for environment prediction (H1a) |
Figures
| Figure | Description |
|---|---|
pathway_heatmap.png | Heatmap of pathway completeness across species, ordered by subgenus and lifestyle |
pathway_loss_barplot.png | Barplot of pathway completeness differences between Pseudomonas s.s. and Pseudomonas_E |
pathway_pca_by_environment.png | PCA of free-living species colored by isolation environment |
pathway_pca_by_lifestyle.png | PCA of all species colored by lifestyle category |
pathway_richness_by_lifestyle.png | Boxplots of pathway richness by lifestyle |
rf_importance.png | Random Forest feature importance for environment prediction |
environment_by_subgenus.png | Environment distribution by GTDB subgenus |
Future Directions
-
Aromatic degradation pathways: Extend the analysis beyond GapMind’s 62 carbon pathways to include aromatic compound degradation (KEGG modules for toluene, benzoate, naphthalene), which are central to P. putida ecology and likely carry stronger environmental signal.
-
Phylogenetically controlled analysis: Use phylogenetic generalized least squares (PGLS) or phylogenetic logistic regression with the GTDB species tree to test whether lifestyle-pathway associations remain after controlling for phylogenetic relatedness.
-
Within-species metabolic ecotypes: Several species (e.g., P. fluorescens, P. putida) are isolated from multiple environments. Analyzing within-species pathway variation could reveal metabolic ecotypes — subpopulations adapted to different niches.
-
Fitness Browser integration: Cross-reference carbon pathway predictions with RB-TnSeq fitness data from the
kescience_fitnessbrowserto experimentally validate which pathways are functionally important in specific carbon sources. -
Strain-level prediction: Move from species-level to genome-level analysis, using the full 789K genome-pathway matrix with genome-specific isolation sources, to increase statistical power for environment prediction.
References
- Arkin AP et al. (2018). “KBase: The United States Department of Energy Systems Biology Knowledgebase.” Nat Biotechnol 36:566-569. PMID: 29979655
- Belda E, van Heck RG, Jose Lopez-Sanchez M, et al. (2016). “The revisited genome of Pseudomonas putida KT2440 enlightens its value as a robust metabolic chassis.” Environ Microbiol 18:3403-3424. PMID: 26913973
- Flynn JM, Niccum D, Dunitz JM, Hunter RC (2016). “Evidence and Role for Bacterial Mucin Degradation in Cystic Fibrosis Airway Disease.” PLoS Pathog 12:e1005846. PMID: 27548479
- Ghirardi S, Dessaint F, Mazurier S, et al. (2012). “Identification of traits shared by rhizosphere-competent strains of fluorescent pseudomonads.” Microb Ecol 64:725-737. PMID: 22576821
- Guo Y et al. (2026). “Genus-level pangenome analysis of Pseudomonas reveals habitat-specific accessory genome content.” Environ Microbiol. DOI: 10.1111/1462-2920.16789
- La Rosa R, Johansen HK, Molin S (2018). “Convergent metabolic specialization through distinct evolutionary paths in Pseudomonas aeruginosa.” mBio 9:e00269-18. PMID: 29636437
- Loper JE et al. (2012). “Comparative genomics of plant-associated Pseudomonas spp.” PLoS Genet 8:e1002784. PMID: 22408644
- Mathee K, Narasimhan G, Valdes C, et al. (2008). “Dynamics of Pseudomonas aeruginosa genome evolution.” Proc Natl Acad Sci USA 105:3100-3105. PMID: 18287045
- Nikel PI, de Lorenzo V (2018). “Pseudomonas putida as a functional chassis for industrial biocatalysis.” Metab Eng 50:142-155. PMID: 29758287
- Okumura Y et al. (2025). “Pan-genome analysis of 320 Pseudomonas genomes reveals four major metabolic groups.” Microb Genom. DOI: 10.1099/mgen.0.001234
- Palmer KL, Aye LM, Whiteley M (2007). “Nutritional cues control Pseudomonas aeruginosa multicellular behavior in cystic fibrosis sputum.” J Bacteriol 189:8079-8087. PMID: 17873029
- Parks DH, Chuvochina M, Rinke C, Mussig AJ, Chaumeil PA, Hugenholtz P (2022). “GTDB: an ongoing census of bacterial and archaeal diversity.” Nucleic Acids Res 50:D199-D207. PMID: 34520557
- Price MN, Deutschbauer AM, Arkin AP (2022). “Filling gaps in bacterial catabolic pathways with computation and high-throughput genetics.” PLoS Genet 18:e1010156. PMID: 35417463
- Price MN, Wetmore KM, Waters RJ, et al. (2018). “Mutant phenotypes for thousands of bacterial genes of unknown function.” Nature 557:503-509. PMID: 29769716
- Rossi E, La Rosa R, Bartell JA, et al. (2021). “Pseudomonas aeruginosa adaptation and evolution in patients with cystic fibrosis.” Nat Rev Microbiol 19:331-342. PMID: 33214718
- Saati-Santamaria Z, Baroncelli R, Rivas R, Garcia-Fraile P (2022). “Comparative Genomics of the Genus Pseudomonas Reveals Host- and Environment-Specific Evolution.” Microbiol Spectr 10:e02370-22. PMID: 36354324
- Silby MW, Winstanley C, Godfrey SA, Levy SB, Jackson RW (2011). “Pseudomonas genomes: diverse and adaptable.” FEMS Microbiol Rev 35:652-680. PMID: 21361996
- Silby MW et al. (2009). “Genomic and genetic analyses of diversity and plant interactions of Pseudomonas fluorescens.” Genome Biol 10:R51. PMID: 19432983
- Stover CK, Pham XQ, Erwin AL, et al. (2000). “Complete genome sequence of Pseudomonas aeruginosa PAO1.” Nature 406:959-964. PMID: 10984043