Raw report: amr_cofitness_networks Feeds into: antimicrobial-resistance-fitness-cost, cofitness-network-architecture, condition-specific-fitness, cross-species-fitness-transferability, fitness-matched-null-models, gene-essentiality, scale-dependent-mobile-element-associations
Overview
This report presents a pan-bacterial analysis of antimicrobial-resistance (AMR) gene cofitness support networks across 28 organisms using Fitness Browser fitness matrices, ICA (independent component analysis) fitness modules, AMR catalogs, and InterProScan functional annotations. It identifies organism-specific support-network structure, larger-than-average AMR-containing modules, and enrichment for flagellar motility and amino acid biosynthesis, while emphasizing that enrichment may reflect shared dispensability under laboratory conditions rather than direct co-regulation. 1
Key Findings
AMR genes occupy large, conserved modules
Of 801 AMR genes with fitness data, 192 (24%) were assigned to ICA fitness modules. AMR-containing modules had a median of 46 genes versus 27 genes in non-AMR modules, a significant difference by MWU (Mann–Whitney U) test (p = 1.7×10⁻⁸). There were 136 unique module families containing AMR genes, and 208/209 (99%) AMR gene-module assignments were in cross-organism conserved module families. Module size did not differ between efflux and enzymatic AMR mechanisms (both median 48, MWU p = 0.91). The report reads the conserved-family result as a sign of ancient regulatory relationships. That reading is the report’s own. The 99% figure has an explicit denominator of 208/209 AMR gene-module assignments, not the 136 module families. A report figure compares module sizes and AMR mechanism coverage (figures/amr_module_analysis.png). 1
Cofitness networks are extensive
The analysis included 28 organisms with AMR genes, fitness matrices, and ICA modules. Among 801 AMR genes with fitness data, 769 (96%) had at least one extra-operon cofitness partner at |r| > 0.3. The dataset contained 180,370 total cofitness partners, of which 179,375 were extra-operon; only 0.6% were excluded as near-operon pairs. Mean support-network sizes were 233 genes at |r| > 0.3, 110 at |r| > 0.4, and 71 at |r| > 0.5. 1
InterProScan annotations reveal functional enrichment
Using interproscan GO (Gene Ontology) annotations, the analysis detected significant enrichment in AMR cofitness neighborhoods. InterProScan provided 68% gene coverage, reported as 3.6× better than the old SEED annotations. Among GO terms enriched in at least 3 organisms at FDR (false discovery rate) < 0.05, the top signals were flagellum-dependent cell motility (GO:0071973; 5 organisms; mean OR 4.7), flagellum assembly (GO:0044780; 5 organisms; mean OR 5.3), bacterial-type flagellum (GO:0009288; 4 organisms; mean OR 4.9), flagellum-dependent swarming (GO:0071978; 4 organisms; mean OR 5.0), histidine biosynthesis (GO:0000105; 3 organisms; mean OR 5.3), and tryptophan biosynthesis (GO:0000162; 3 organisms; mean OR 5.3). A report figure shows GO-term enrichment in AMR support networks (figures/go_enrichment_interproscan.png). 1
The old SEED/KEGG annotation analysis found 0/280 significant enrichment tests at FDR < 0.05, whereas InterProScan GO found 35/3,193 significant tests. The report therefore treats annotation quality as critical for genome-wide cofitness functional analysis, while noting that the enrichment categories may be artifacts of shared dispensability under the experimental conditions. Separately, an old-SEED permutation analysis yielded 23 significant results among 250 tests, with membrane/cell wall as the top signal (24%, fold 1.12). This permutation result is distinct from the old-SEED 0/280 enrichment result. 1
By mechanism, efflux AMR genes showed the strongest enrichment for amino acid biosynthesis, including histidine biosynthesis in 6 organisms and tryptophan biosynthesis in 5 organisms. Metal-resistance genes showed stronger chemotaxis enrichment in 4 organisms, but no GO term was significantly mechanism-specific after FDR correction. The mechanism-specific GO analysis produced 212 significant results among 9,244 tests at FDR < 0.05. Its top signal was efflux-associated histidine biosynthesis in 6 organisms. This analysis tests for enrichment within mechanism-defined support networks, not for significant differences between mechanisms. 1
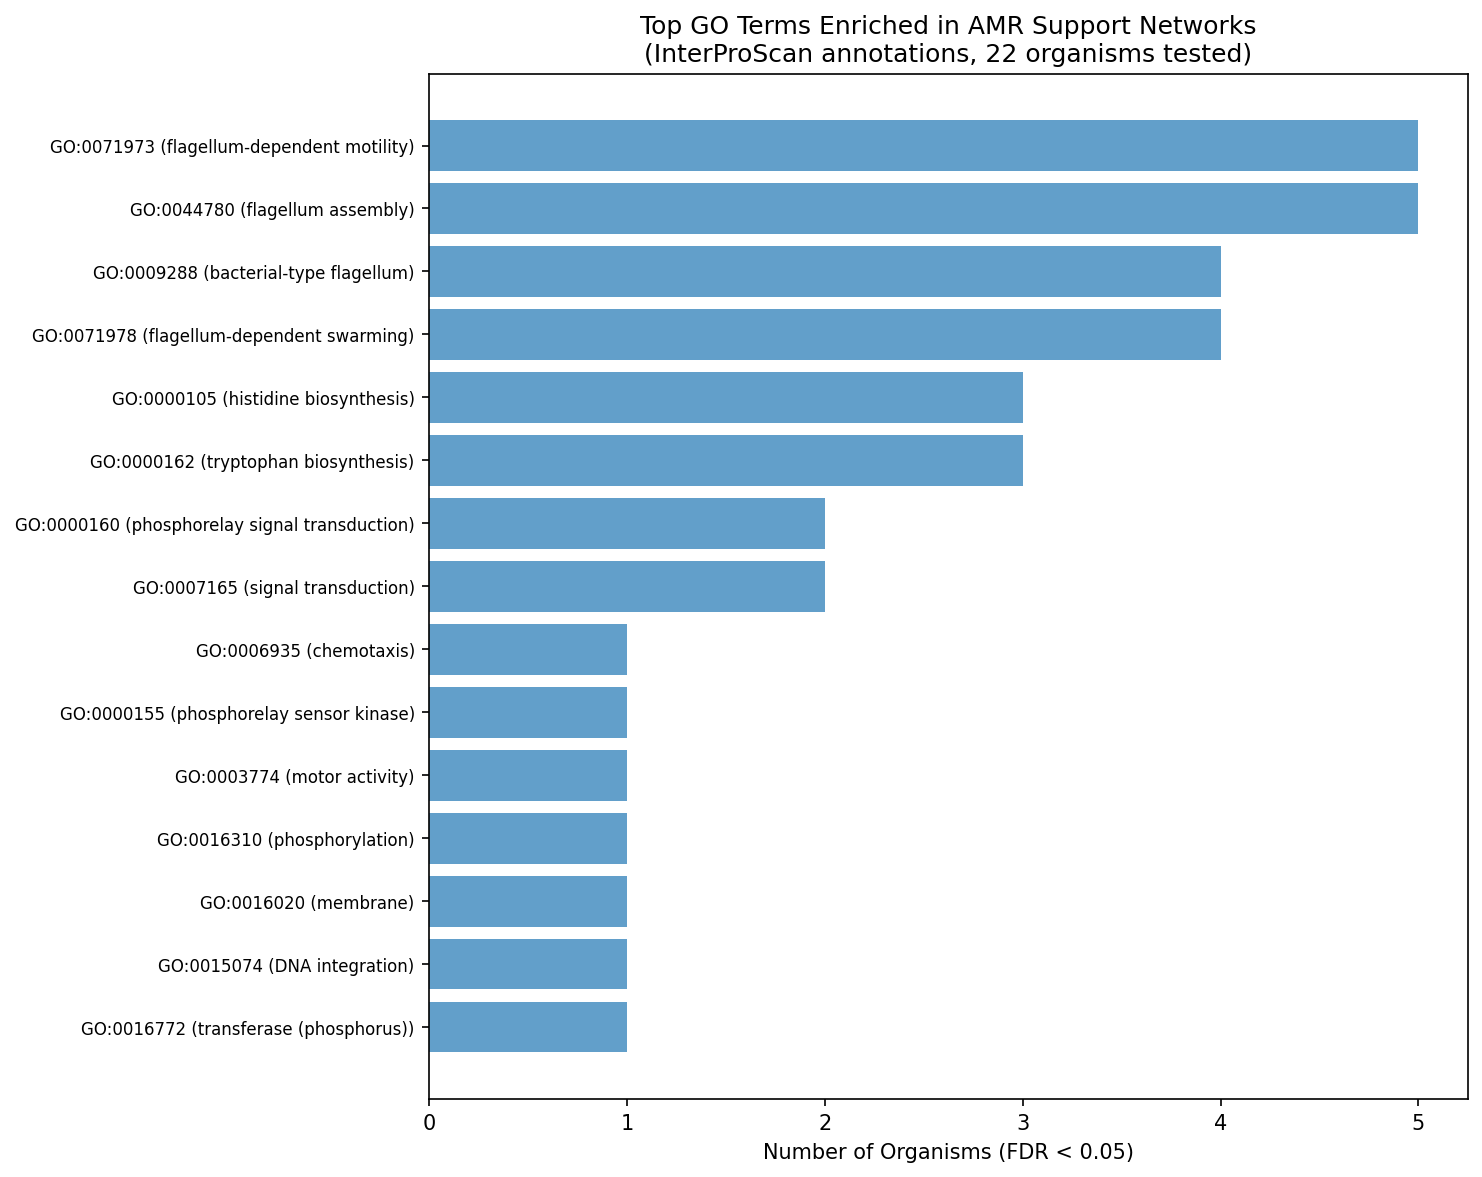 GO term enrichment in AMR support networks. From amr_cofitness_networks.
Support networks are more organism-specific than mechanism-specific
Different AMR mechanisms within the same organism shared more support partners than the same mechanism across organisms. The mean Jaccard similarity of GO terms was 0.375 for cross-mechanism comparisons within the same organism and 0.207 for within-mechanism comparisons across organisms; the difference was highly significant (MWU p = 4.3×10⁻¹³). The report interprets this as evidence that each organism’s regulatory, metabolic, and signaling architecture shapes AMR support networks more strongly than resistance-mechanism class. The report gives an example: an efflux pump in Pseudomonas shares more cofitness partners with a beta-lactamase in the same Pseudomonas than with an efflux pump in Shewanella. A report figure presents the Jaccard comparison (figures/jaccard_go_comparison.png). 1
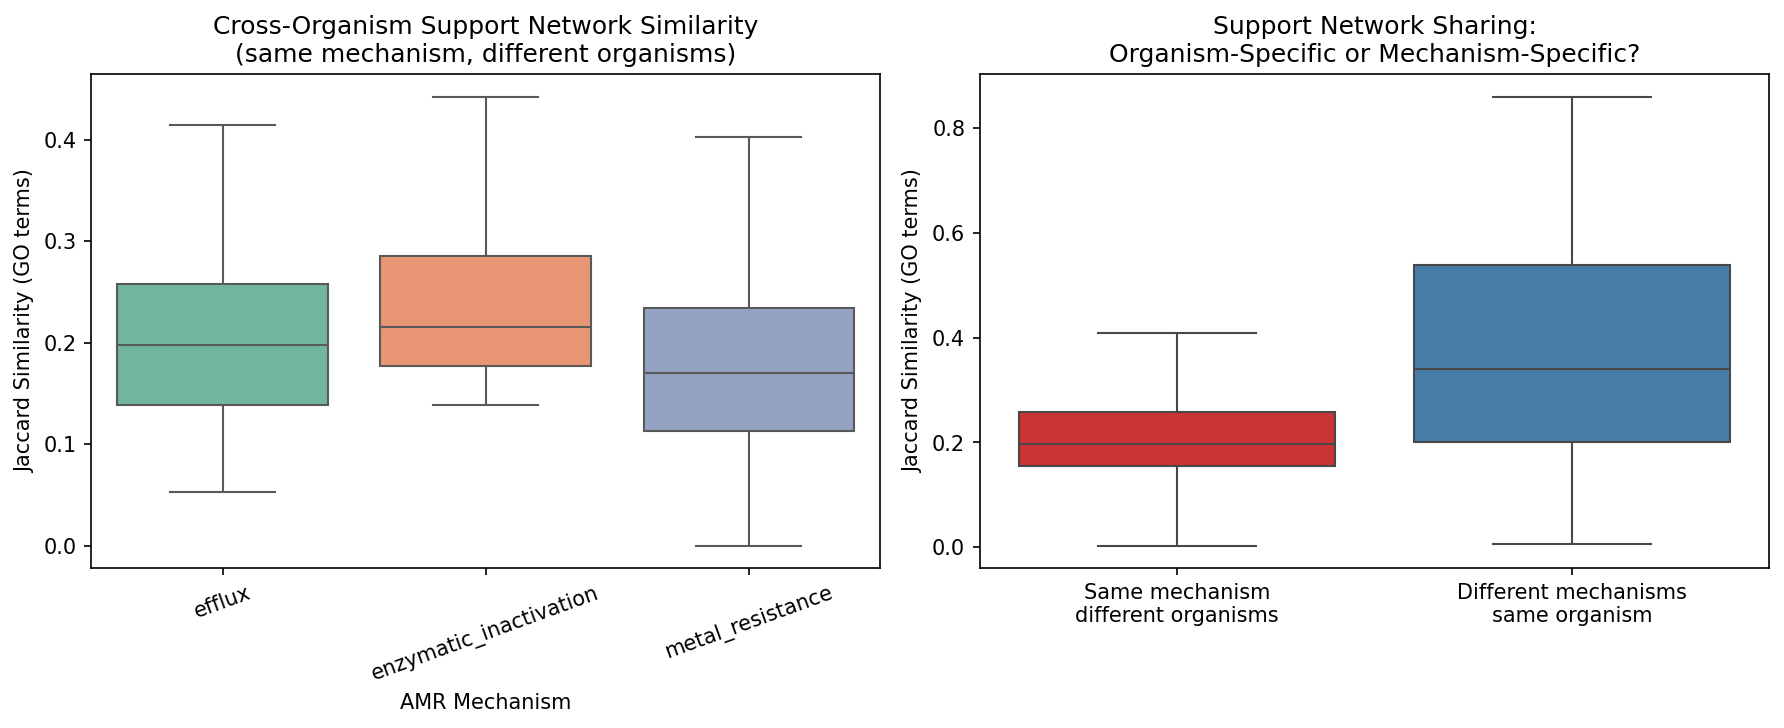 Jaccard comparison showing organism-specificity. From amr_cofitness_networks.
The conserved core across mechanisms included transmembrane transport in 87–100% of organisms, signal transduction in 87–100%, transcription regulation in 96–100%, and phosphorelay signaling in 91–100%. Flagellar motility occurred in 53–61% of organisms and amino acid biosynthesis in 30–73%. Histidine biosynthesis showed the only hint of mechanism specificity, with efflux at 68% versus metal resistance at 30% (p = 0.013 uncorrected; q = 0.18 after FDR), so it is not significant after correction. A report figure shows a GO-term conservation heatmap by AMR mechanism (figures/go_conservation_heatmap.png). 1
The annotation comparison strengthened the organism-specificity result: within-mechanism Jaccard similarity increased from 0.069 with old KEGG annotations to 0.207 with InterProScan GO, while cross-mechanism similarity increased from 0.249 to 0.375. The cross-mechanism-versus-within-mechanism comparison had p = 1.0 with old KEGG annotations and p = 4.3×10⁻¹³ with InterProScan GO. The report calls the within-mechanism increase 3× higher and the cross-mechanism increase 1.5× higher. The old KEGG analysis reported two FDR-significant mechanism-specific terms (lipoprotein and toluene tolerance), whereas InterProScan GO reported zero. The report’s comparison table gives coverage as 40–80% per organism (variable) for old annotations and 60% uniform across all genes for InterProScan GO. The 60% table value differs from the 68% gene-coverage statement elsewhere in the report, and the report does not reconcile the two. 1
Network size does not predict AMR fitness cost
Support-network size was not correlated with AMR gene fitness cost: Spearman rho = −0.006, p = 0.87, N = 769. Within mechanisms, correlations were rho = −0.049 for efflux, rho = +0.038 for enzymatic resistance, and rho = −0.031 for metal resistance; all p > 0.4. The report also states that the uniform resistance cost was +0.086 and was not explained by co-regulatory-neighborhood size. A report figure plots support-network size against AMR fitness cost (figures/network_size_vs_fitness.png). 1
Interpretation of the enrichment signal remains unresolved
The flagellar motility, chemotaxis, and amino acid biosynthesis enrichment supports two interpretations: genuine co-regulation through shared transcription factors or signaling cascades, or shared dispensability under Fitness Browser laboratory conditions. Fitness Browser experiments generally use shaken liquid culture, where flagella and chemotaxis may be unnecessary, and often use rich or defined media with amino acid supplements, where biosynthesis may be redundant; AMR genes are similarly dispensable without antibiotics. 1
Evidence favoring the shared-dispensability interpretation includes enrichment for categories expected to be dispensable in shaken-flask culture, absence of energy-metabolism enrichment in 0/25 organisms with a permutation-test fold of 0.91, and the fact that the reported permutation matched conservation class but not mean fitness level. A fitness-matched permutation drawing random non-AMR genes with the same mean-fitness distribution, including the −0.05 to +0.05 range proposed in the report, is identified as the key test. The report notes that, had the random genes been drawn with the same slightly-positive fitness distribution as AMR genes, the flagellar enrichment might disappear entirely. The decision rules are stated as follows. If random slightly-positive non-AMR genes also show flagellar enrichment in their cofitness neighborhoods, shared dispensability (Interpretation B) is correct. If AMR genes uniquely enrich for flagella even among genes with similar fitness, co-regulation (Interpretation A) is supported. The report calls this the single most important follow-up analysis. 1
Pearson correlation removes each gene’s mean fitness before correlating profiles, so uniformly slightly positive fitness values alone would produce zero correlation. However, dispensable genes can still share condition-responsive patterns, such as greater dispensability under nutrient-rich conditions and lower dispensability under starvation, without being directly co-regulated. 1
The organism-specificity result is described as robust to the dispensability confound because the comparison of Jaccard similarities concerns the relative organization of support networks: different mechanisms within one organism shared more partners (J = 0.375) than the same mechanism across organisms (J = 0.207, p = 4.3×10⁻¹³). The report relates this to the contrast between mechanism-dependent conservation and cost: metal resistance was 44% accessory versus 13% for efflux, while mechanism did not explain fitness cost. These conservation and cost figures come from the amr_fitness_cost project. The report’s own explanation is that the organism’s gene content and growth context set the cost, whereas the mechanism’s acquisition history sets conservation. 1
The ICA module-size result is also described as robust: AMR-containing modules had median size 46 versus 27 for non-AMR modules (p = 1.7×10⁻⁸), and ICA decomposition was interpreted as capturing condition-specific co-regulation rather than only shared mean fitness. 1
Literature context
The report credits Sagawa et al. (2017) with showing that cofitness recovers transcriptional regulatory relationships in 24 bacteria. It still leaves open whether its own AMR–motility signal reflects regulation or shared dispensability. It cites Martinez & Rojo (2011) as a review linking metabolism and intrinsic resistance, in which global metabolic regulators modulate antibiotic susceptibility; this framework would support the findings only if the co-regulation interpretation is correct. It cites Olivares Pacheco et al. (2017) as showing that efflux-pump costs in P. aeruginosa are metabolic, arising from proton-motive-force (PMF) drain and offset by metabolic rewiring. The report’s PMF-competition explanation for efflux–flagellar cofitness (both use PMF) remains a hypothesis confounded by shared dispensability. It cites Eckartt et al. (2024, Nature) as finding compensatory mutations that target the same functional pathway as the resistance mutation. The report calls its organism-specificity finding consistent with this, which is an interpretive link rather than a direct test. 1
The report credits Nichols et al. (2011, Cell) with showing that condition-dependent fitness profiles reveal gene function in E. coli. It accepts the general principle but adds a caveat from its own analysis: functional enrichment in cofitness neighborhoods can reflect shared experimental context (laboratory conditions) rather than biological co-regulation. 1
Caveats and Limitations
- The flagellar and biosynthesis enrichment may reflect shared “useless under laboratory conditions” status rather than mechanistic co-regulation. A permutation matched on mean fitness level, rather than only conservation class, is required to distinguish these explanations. 1
- Cofitness is not equivalent to co-regulation: high cofitness indicates shared fitness phenotypes, not direct transcriptional control. Missing fitness values were treated as zero in z-score space through
np.nan_to_num, which approximates but does not equal pairwise-complete Pearson correlation; the report considers the dense Fitness Browser matrices unlikely to substantially alter conclusions. 1 - GO-term granularity may obscure specific signals because broad categories such as transmembrane transport and membrane functions appear in nearly all support networks and genomes. 1
- At |r| > 0.3, the mean support network contains 233 genes and therefore includes many weak associations; confirmation at |r| > 0.4 is needed. 1
- The null result for the relationship between network size and fitness cost may reflect insufficient variance in fitness cost across genes. 1
- The 28 organisms are lab-adapted, phylogenetically biased, include many Pseudomonas organisms, and have limited ecological diversity. 1
- The operon-exclusion heuristic uses a 5-ORF exclusion zone based on matrix row index position as a proxy for genomic proximity. Row position may not reliably reflect chromosomal gene order. Genomic
begin,end, andstrandcolumns were loaded in the annotation data and could support a proper coordinate-based exclusion in future work. Only 0.6% of pairs were excluded by the current heuristic. 1 - The most important follow-up analyses are fitness-matched permutations; cofitness computed separately for antibiotic and standard-growth conditions; direct assessment of mean fitness for flagellar knockouts; Pfam-domain enrichment; and testing other conditionally dispensable gene classes such as phage-defense and secondary-metabolite genes. 1
Proposed Follow-up Analyses
The report marks a fitness-matched permutation as critical. It would draw random non-AMR genes matched on mean fitness level, not just conservation class. If random genes with fitness between −0.05 and +0.05 also show flagellar or biosynthesis enrichment in their cofitness neighborhoods, the enrichment is a shared-dispensability artifact. If AMR genes still enrich uniquely among fitness-matched genes, the co-regulation interpretation is supported. 1
A second proposed test computes cofitness separately for antibiotic conditions and for standard growth. If AMR–flagella cofitness is specifically elevated under antibiotic stress, and not only under standard growth, that would support a regulatory connection rather than shared dispensability. 1
The report also proposes checking flagellar gene dispensability directly, by testing whether flagellar gene knockouts show positive mean fitness across Fitness Browser (FB) experiments. Positive values would make the shared-dispensability explanation plausible. Near-zero or negative values would strengthen the co-regulation interpretation. This check has not yet been done. 1
Pfam domain annotations cover 88% of genes, compared with 68% for GO. The report therefore proposes domain-level enrichment as a way to reveal more specific support-network functions than broad GO terms can. 1
A final proposal extends the test to other dispensable gene classes, such as phage-defense genes, secondary-metabolite genes, or other condition-specific classes. If those classes show the same cofitness patterns as AMR genes, the signal is a general feature of dispensable genes under laboratory conditions rather than something specific to AMR. 1
Data Sources and Outputs
- kbase-ke-pangenome supplied InterProScan GO terms and Pfam domains (
interproscan_go,interproscan_domains) plusbakta_annotations(KEGG orthology) for FB gene clusters. 1 - kescience-fitnessbrowser supplied fitness profiles for cofitness computation through cached matrices. 1
- The AMR gene catalog (
amr_fitness_cost/data/amr_genes_fb.csv) and per-gene fitness costs (amr_fitness_cost/data/amr_fitness_noabx.csv) came from theamr_fitness_costproject. 1 - ICA module membership came from
fitness_modules/data/modules/. 1 - The FB-to-pangenome cluster mapping came from
conservation_vs_fitness/data/fb_pangenome_link.tsv. 1
Generated tables and their row counts were as follows. 1
amr_cofitness_partners.csv: 180,370 rows, covering all cofitness partners at |r|>0.3 with annotations.amr_module_membership.csv: 818 rows of AMR gene-to-ICA-module assignments.amr_modules_characterized.csv: 209 rows of AMR-containing modules with their properties.fb_interproscan_go.csv: 438,000 rows of InterProScan GO terms for FB gene clusters.fb_interproscan_pfam.csv: 228,672 rows of InterProScan Pfam domains.fb_bakta_kegg.csv: 41,611 rows of Bakta KEGG orthology.go_enrichment_interproscan.csv: 3,193 rows of per-organism GO enrichment results.mechanism_go_enrichment.csv: 9,244 rows of per-mechanism GO enrichment results.go_conservation_by_mechanism.csv: 1,078 rows of GO-term presence by mechanism × organism.hub_support_genes.csv: 47,327 rows of hub genes, meaning genes that partner multiple AMR genes.jaccard_go_within_mechanism.csv: 956 rows of cross-organism, within-mechanism GO Jaccard values.jaccard_go_cross_mechanism.csv: 71 rows of within-organism, cross-mechanism GO Jaccard values.
The notebook record shows three analysis outcomes. 03_support_networks.ipynb ran the H1/H3 support-network analysis with old SEED annotations and produced a null result. 03b_enrichment_interproscan.ipynb reran H1 with InterProScan GO and found flagellar and biosynthesis enrichment. 04b_cross_organism_interproscan.ipynb ran H4 with InterProScan GO and confirmed organism-specificity. 1
Report figures: 1
amr_module_coverage.png: ICA module coverage of AMR genes by organism.amr_module_analysis.png: AMR versus non-AMR module sizes, and mechanism coverage.cofitness_threshold_sensitivity.png: network size against cofitness threshold.support_network_enrichment.png: the old SEED-based enrichment heatmap (null result).go_enrichment_interproscan.png: InterProScan GO enrichment (significant result).network_size_vs_fitness.png: H3 scatter of network size against fitness cost.go_conservation_heatmap.png: GO-term conservation by mechanism across organisms.jaccard_go_comparison.png: organism-specific versus mechanism-specific Jaccard similarity.conserved_kegg_by_mechanism.png: old KEGG conservation by mechanism.
Slots Into
- condition-specific-fitness — cofitness neighborhoods may capture condition-specific shared dispensability rather than direct co-regulation, and the report specifies fitness-matched and condition-specific tests to resolve this. 1
- gene-essentiality — AMR, flagellar, and biosynthetic gene fitness phenotypes under laboratory conditions are central to interpreting the enrichment and the null network-size–cost relationship. 1
- pangenome-integration — InterProScan GO annotation of pangenome cluster representatives improved coverage and transformed legacy annotation null results into detectable functional enrichment. 1
- cofitness-network-architecture — AMR genes sit in larger, cross-organism conserved ICA modules and have many extra-operon cofitness partners. Their support networks are organized more by organism than by mechanism. 1
- fitness-matched-null-models — the permutation matched conservation class but not mean fitness. The report names a fitness-matched permutation as the key test separating co-regulation from shared dispensability. 1
- ontology-and-category-schema-sensitivity — old SEED/KEGG annotations gave 0/280 significant enrichment tests versus 35/3,193 with InterProScan GO. The annotation switch also moved the organism-specificity comparison from p = 1.0 to p = 4.3×10⁻¹³. 1
- cross-species-fitness-transferability — the same AMR mechanism shares fewer cofitness GO terms across organisms (0.207) than different mechanisms within one organism (0.375), which limits how well support networks transfer across species. 1
- antimicrobial-resistance-fitness-cost — support-network size does not predict AMR fitness cost, and the report ties cost to organism context rather than mechanism. 1