Raw report: phb_granule_ecology Feeds into: cultivation-collection-bias-in-ecological-genomics, environment-embedding-geography, functional-marker-validation, gene-function-acquisition-depth, genomic-under-representation, homology-search-negative-evidence, horizontal-gene-transfer-driven-innovation, metabolic-capacity-specialization, occurrence-versus-catabolic-activity, ontology-and-category-schema-sensitivity, pangenome-integration, phb-granule-ecology, phylogenetic-confounding-of-pangenome-associations, sampling-depth-and-downsampling-effects, subsurface-bacillota-specialization, taxonomic-resolution-dependent-functional-inference, two-speed-bacterial-genome
Overview
This report evaluates polyhydroxybutyrate (PHB) biosynthesis across 27,690 GTDB species using pangenome annotations, taxonomy, environmental metadata, AlphaEarth embeddings, and NMDC metagenomes. It finds that phaC and complete PHB pathways are phylogenetically concentrated, enriched in environmentally variable habitats, associated with larger genomes, and frequently accessory in phylogenetically discordant lineages, supporting environmental selection and widespread horizontal gene transfer (HGT) while qualifying the apparent PHB–niche-breadth association as largely genome-size driven. 1
Key Findings
Phylogenetic distribution and pathway completeness
Across 27,690 GTDB species, 21.9% carry phaC, the PHA synthase committed step, and 21.7% have a complete PHB pathway defined as phaC plus phaA/phaB. A total of 118,513 PHB-related gene clusters were identified across 19,496 species using eggNOG annotations. The near-identical phaC-only and complete-pathway prevalence indicates that nearly all phaC-carrying species also possess upstream biosynthetic enzymes. 1
PHB prevalence is highest in Pseudomonadota at 60.9% (4,544/7,456 species), followed by Myxococcota at 52.9% (83/157), Halobacteriota at 34.4% (89/259), Thermoproteota at 27.9% (65/233), Desulfobacterota at 21.9% (70/319), and Actinomycetota at 18.5% (587/3,172). Campylobacterota (0/271), Gemmatimonadota (0/102), Nanoarchaeota (0/135), and Marinisomatota (0/90) were entirely devoid of PHB, while Patescibacteria had 0.4% prevalence (4/981). 1
The 6,067 phaC-carrying species span 95 of 142 GTDB phyla. Pseudomonadota accounts for 74.9% of phaC-carrying species (4,544/6,067), and the five most PHB-enriched phyla—Pseudomonadota, Myxococcota, Halobacteriota, Thermoproteota, and Desulfobacterota—account for 85.5% of phaC-positive species while comprising 30.4% of total species diversity. At order level, 23 orders with more than 20 species exceed 50% phaC prevalence; Azospirillales and Rhodospirillales are both at 100%, Caulobacterales at 99.3%, and Sphingomonadales at 95.9%, whereas 117 orders are below 10%. 1
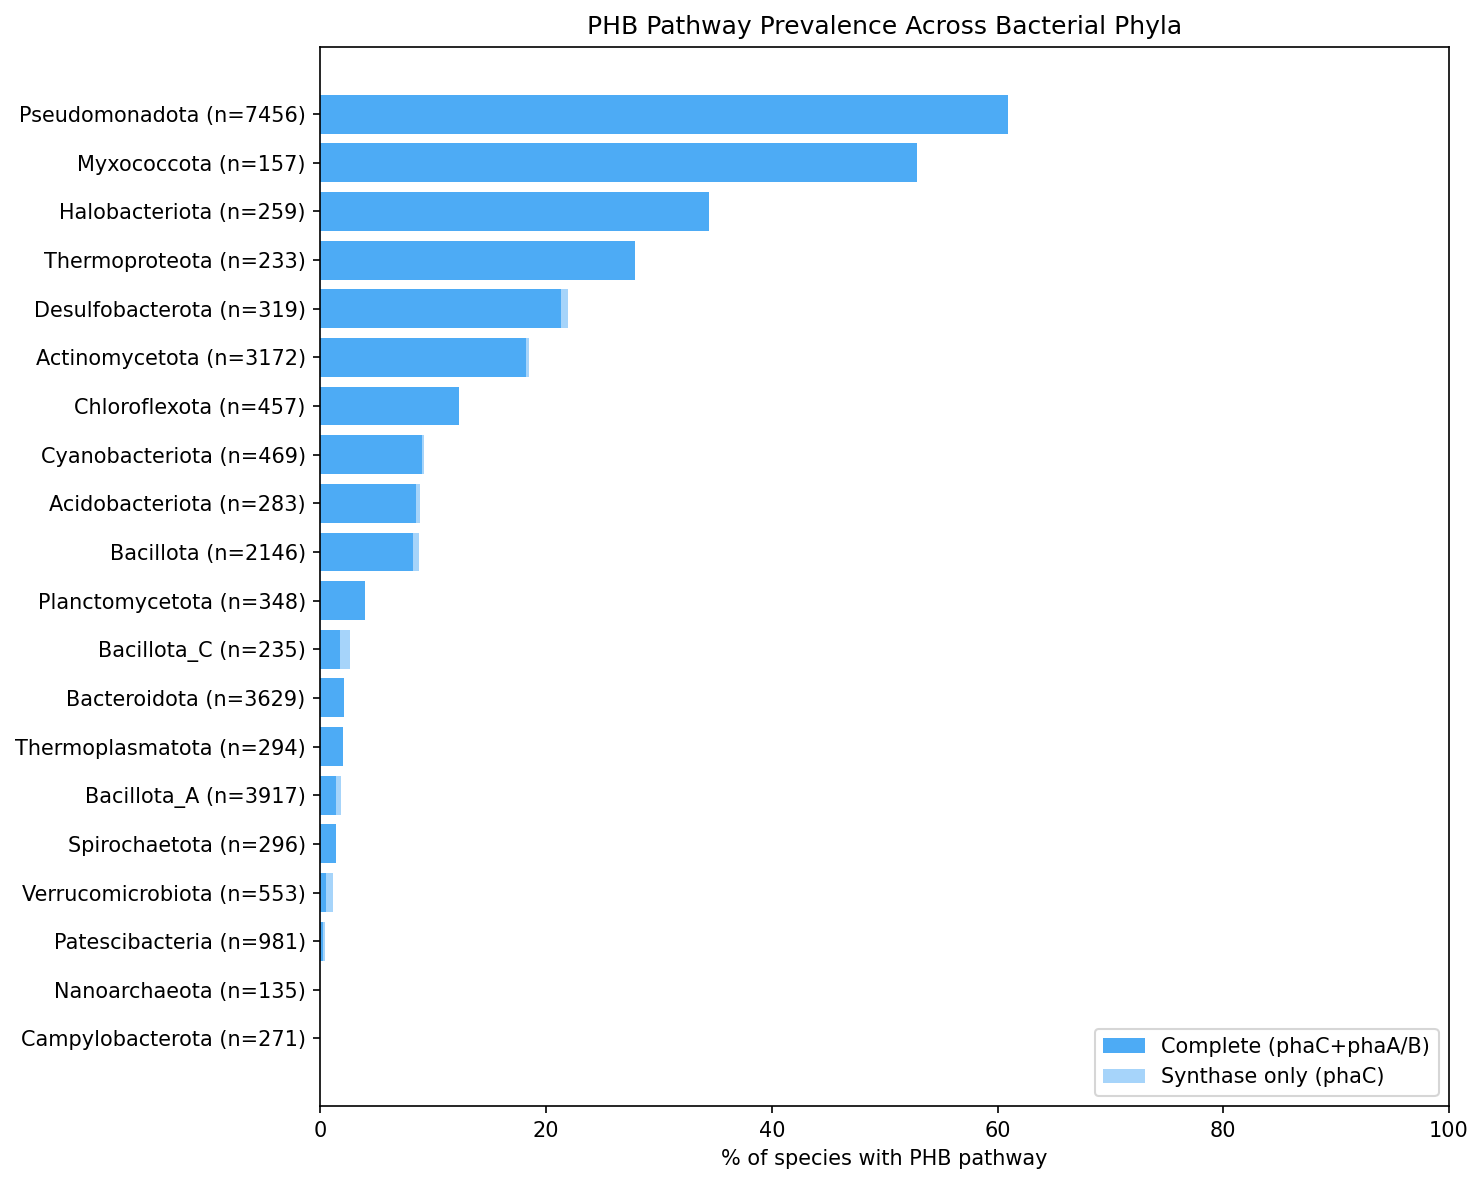 PHB pathway prevalence across 20 major bacterial phyla, showing Pseudomonadota, Myxococcota, and Halobacteriota as the most enriched. From phb_granule_ecology.
The gene-level census identified 86,318 phaA clusters across 17,969 species, 11,792 phaC clusters across 6,067 species, 9,617 phaB clusters across 6,977 species, 6,130 phaP clusters across 4,571 species, 4,656 phaZ clusters across 3,151 species, and 0 phaR clusters across 0 species. Species-level categories were complete (6,005), synthase-only (62), precursors-only (12,869), accessory-only (555), and absent (8,199). The 46.5% precursors-only category reflects the pleiotropic roles of phaA and phaB in general fatty-acid and thiolase metabolism, while the absence of phaR suggests incomplete annotation or misassignment of K18080. 1
Environmental enrichment and the feast/famine hypothesis
PHB prevalence follows an environmental gradient: plant-associated species, 625 total, have 44.0% phaC prevalence; soil species, 1,484 total, have 43.6%; wastewater/engineered species, 1,124 total, have 34.5%; freshwater species, 3,263 total, have 25.5%; sediment species, 1,020 total, have 20.1%; marine species, 3,010 total, have 18.7%; human-associated species, 1,237 total, have 11.1%; human clinical species, 2,472 total, have 7.4%; and animal-associated species, 3,711 total, have 3.3%. 1
A chi-squared test of PHB presence against environmental variability category yielded chi2 = 1,656.36, p ~ 0, dof = 2. This strongly supports the report’s H1a hypothesis that PHB genes are enriched in temporally variable “feast/famine” environments and depleted in stable or host-associated environments. 1
The environmental enrichment remains after genome-size stratification. In the smallest-genome quartile, Q1 (0.4–1.8 Mbp), high-variability environments had 10.7% phaC-positive species versus 2.5% in low-variability environments, a 4.4x enrichment with p = 1.18 x 10^-11. Q2 had 18.5% versus 4.0%, a 4.6x enrichment with p = 3.25 x 10^-47; Q3 had 34.3% versus 10.9%, a 3.1x enrichment with p = 4.17 x 10^-70; and Q4 (3.7–14.0 Mbp) had 50.9% versus 37.4%, a 1.4x enrichment with p = 3.21 x 10^-14. 1
Niche breadth and genome-size confounding
Among 2,008 species with sufficient AlphaEarth environmental-embedding representation, PHB-positive species had median embedding variance of 0.3295 (n = 531), compared with 0.2472 for PHB-negative species (n = 1,477); the Mann–Whitney U statistic was 446,546 with p = 1.88 x 10^-6. The raw PHB–niche-breadth association was rho = 0.106 with p = 1.77 x 10^-06. 1
PHB-positive species had median genome size of 4.34 Mbp versus 2.44 Mbp for PHB-negative species, with rank-biserial r = -0.592 and p ~ 0. Genome size correlated with niche breadth at rho = 0.302 with p = 1.5e-43. After controlling for genome size using partial Spearman correlation, the PHB–niche-breadth association became partial rho = -0.047 with p = 0.037, a 56.3% reduction in effect size and a sign reversal. The report therefore treats genome size, rather than PHB specifically, as the primary correlate of the apparent niche-breadth association. 1
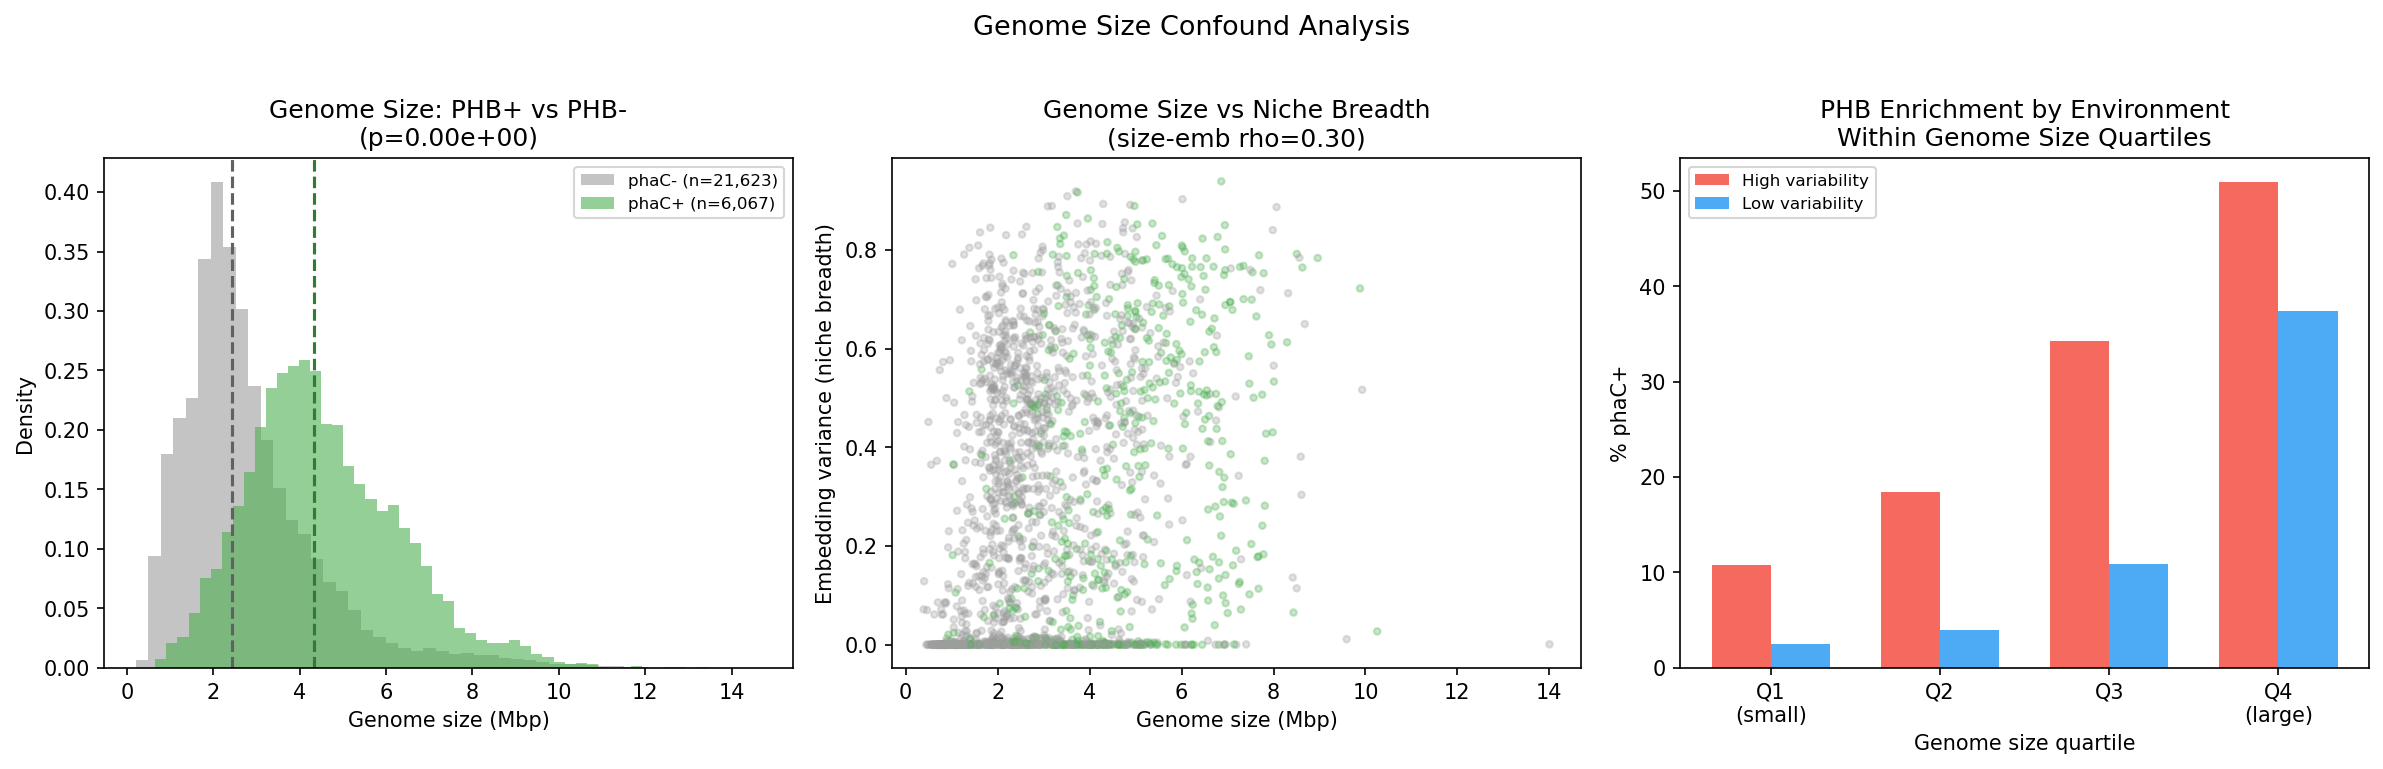 Genome size confound analysis: size distributions (left), size vs niche breadth colored by PHB status (center), and PHB enrichment by environment within genome size quartiles (right). From phb_granule_ecology.
Subclade heterogeneity and horizontal transfer
Among 248 families tested with Fisher’s exact tests and Bonferroni correction at alpha = 0.05, 41 were PHB-enriched, 62 were depleted, and 145 were not significant. Enriched families included Burkholderiaceae, Burkholderiaceae_B, Rhodocyclaceae, Caulobacteraceae, Sphingomonadaceae, Xanthobacteraceae, Rhodanobacteraceae, Legionellaceae, Mycobacteriaceae, Nocardioidaceae, Haloarculaceae, Natrialbaceae, Nitrosopumilaceae, Microcystaceae, and Bacillaceae_G. Enriched families skewed toward freshwater (5/41) and wastewater (3/41), whereas depleted families skewed toward marine (18/62) and host-associated environments (12/62). The interpretation is limited because “other_unknown” represented 30/41 enriched families and 26/62 depleted families. 1
Phylogenetically discordant phaC distribution identified 311 potential HGT acquisition events in species carrying phaC despite belonging to families with less than 20% phaC prevalence, and 278 potential HGT loss events in species lacking phaC despite belonging to families with more than 80% prevalence. Among the 311 discordant phaC-positive species, 60.1% carried phaC as accessory genome, compared with 32.3% of all phaC-carrying species. This elevated accessory fraction supports ongoing horizontal acquisition, although the analysis uses core/accessory status as a proxy rather than a directly reconstructed gene tree. 1
The principal putative recipient families were Lachnospiraceae with 38 acquisitions and 3.1% family phaC prevalence, Chitinophagaceae with 22 and 12.4%, Pelagibacteraceae with 13 and 5.3%, Enterobacteriaceae with 11 and 2.3%, and Planococcaceae with 10 and 12.8%. Overall, 5,371 species carried phaC as core and 1,959 as accessory, with some species carrying both core and accessory copies. 1
NMDC metagenomic cross-validation
A two-tier taxonomy mapping connected 3,014/3,492 NMDC taxon columns (86.3%) to GTDB genera with known PHB status: 2,336 columns through the gtdb_metadata NCBI-taxid-to-GTDB-genus bridge and 678 additional columns through direct genus-name matching. PHB inference scores were calculated for 6,365 NMDC metagenomic samples as abundance-weighted sums of genus-level phaC prevalence, with a median 87.2% of taxonomic abundance matched to pangenome genera. In the output file data/nmdc_phb_prevalence.tsv, the 6,365 NMDC sample PHB inference scores have mean 201.5 and median 137.7, with 87.2% median coverage. 1
PHB inference scores correlated with depth at rho = -0.119 and p = 1.14 x 10^-21, temperature at rho = +0.088 and p = 1.86 x 10^-12, maximum depth at rho = +0.076 and p = 1.15 x 10^-9, minimum depth at rho = -0.055 and p = 1.05 x 10^-5, pH at rho = +0.049 and p = 7.95 x 10^-5, and ammonium nitrogen at rho = +0.044 and p = 4.49 x 10^-4. These effect sizes are modest, with |rho| < 0.12, and are consistent with but do not directly measure temporal environmental variability. The abiotic-correlation output contains 21 Spearman correlations of PHB score with abiotic variables, 6 of them significant at p<0.001. 1
In a genus-level cross-validation, 693 genera were matched between pangenome and NMDC metagenomes. PHB-high genera, defined as having at least 50% phaC prevalence, had significantly higher NMDC abundance than PHB-low genera by Mann–Whitney testing (p = 8.41 x 10^-22). The most abundant PHB-high genera included Mycobacterium, Pseudomonas, Cupriavidus, Burkholderia, and Methylobacterium. 1
The attempted PHA synthase class analysis classified all 11,792 phaC clusters as “other_pfam” because the eggNOG PFAMs column contained domain names such as Abhydrolase_1 and PhaC_N rather than the expected Pfam accession IDs PF00561 and PF07167. This is a null result for class assignment: the class-distribution output (data/phaC_class_distribution.tsv) covers 6,067 phaC-carrying species, all assigned “other_pfam”. 1
Interpretation and literature context
The report frames its survey as the first pan-bacterial genomic test, across 27,690 species, of the classical feast/famine hypothesis (Dawes & Senior 1973), which proposes that PHB is most advantageous under temporal carbon fluctuation, and states that its data strongly support that hypothesis. 1
In its discussion the report summarizes PHB prevalence as a gradient from high-variability environments (plant 44%, soil 43.6%, wastewater 34.5%) to low-variability environments (marine 18.7%, clinical 7.4%, animal 3.3%). PHB-enriched families skew toward freshwater/wastewater environments and depleted families toward marine/host-associated environments. In NMDC metagenomes, inferred PHB capacity correlates negatively with sample depth (rho = -0.12, p = 1.1e-21) and positively with temperature (rho = 0.09, p = 1.9e-12). 1
PHB+ species appear to occupy broader environmental niches (raw p = 1.88e-06), but the report concludes that this association is largely explained by genome size: the PHB–niche-breadth association collapses after controlling for genome size (partial rho = -0.047 vs raw rho = 0.106), and niche breadth, as measured by AlphaEarth embedding variance, scales with genome size (rho = 0.302). By contrast, environmental PHB enrichment holds across all four genome size quartiles with 1.4–4.6x enrichment. 1
Cited prior work reports that PHB confers multi-stress resistance (UV, osmotic, oxidative, temperature, freezing) beyond simple carbon storage. A cited methanotroph study found lineage-specific PHB capacity (all Type II positive, all Type I negative), and the report’s own data show PHB is phylogenetically structured even at fine taxonomic scales (41 enriched, 62 depleted families within phyla). 1
On horizontal transfer, the report places its 311 potential phaC acquisition events, with a 60.1% accessory rate (vs 32.3% overall), alongside cited work on PHA-pathway horizontal transfer that names Halomonas, and describes extensive HGT across diverse families including Lachnospiraceae, Chitinophagaceae, Pelagibacteraceae, and Enterobacteriaceae. These acquisitions remain putative, inferred from phylogenetic discordance and core/accessory status rather than gene trees. The report also highlights that the archaeal phylum Halobacteriota carries 34.4% phaC prevalence. 1
As mechanistic context for the genome-size confound, the report cites work showing that genome size scales linearly with metabolic enzyme count (r > 0.9; Vieira-Silva & Rocha 2010) and predicts habitat breadth in soil bacteria (Barberán et al. 2014), that fluctuating environments select for larger genomes (Bentkowski et al. 2015), and that stable oligotrophic environments select for streamlined genomes that shed “optional” pathways including PHB, glycogen, and polyphosphate storage (Giovannoni et al. 2005, 2014). 1
From this the report proposes, as a hypothesis rather than a directly tested result, a causal chain — environment variability → genome size → metabolic pathway count → PHB presence — in which PHB presence is partially a downstream consequence of genome size rather than an independent adaptation. 1
The report also states that PHB+ species have 1.9 Mbp larger genomes “on average”, but the values it reports are medians (PHB+ median 4.34 Mbp vs PHB- median 2.44 Mbp); a mean difference is not established by those medians. 1
Caveats and Limitations
NMDC cross-validation correlations were statistically significant but small (|rho| < 0.12). NMDC abiotic measurements are point-in-time values rather than measures of temporal variability, and the studies are biased toward terrestrial and soil environments, limiting direct testing of the feast/famine hypothesis. 1
PHA synthase class analysis failed because Pfam accession IDs were not mapped to eggNOG domain names; mapping PF00561 to Abhydrolase_1 for Class I/II and PF07167 to PhaC_N for Class III/IV is required to classify the 11,792 phaC clusters. 1
Environment metadata are sparse: 34.9% of species have “other_unknown” as their primary environment, so environmental enrichment may be underestimated. AlphaEarth coverage is also limited: 83K/293K genomes, or 28%, have embeddings, and the 2,008 species analyzed represent 7.2% of total species diversity, potentially biasing niche-breadth analyses toward better-sampled lineages. 1
Because phaA and phaB participate in general metabolism beyond PHB biosynthesis, the 46.5% precursors-only category likely overestimates partial PHB capability. The pangenome includes complete genomes and metagenome-assembled genomes (MAGs), with variable genome quality and gene-detection rates. 1
PHB presence is correlated with phylogeny and genome size, and the PHB–niche-breadth association falls from raw rho = 0.106 with p = 1.77e-06 to partial rho = -0.047 with p = 0.037 after controlling for genome size. The report’s interpretation states that PHB environmental enrichment persists within all genome-size quartiles with 1.4–4.6x enrichment and all p < 1e-11; this conflicts with its own quartile table, where Q1 has p = 1.18 x 10^-11, which is not below 1e-11, so both statements are retained here without reconciliation. Shared ancestry also remains a potential confound: phylogenetic logistic regression or phylogenetic independent contrasts are still needed to account for shared ancestry. 1
PHB has functions beyond carbon storage, including stress resistance, redox balance, and cryoprotection, so environmental variability is supported as a selective force but is not necessarily the sole driver of PHB distribution. The HGT inference is likewise based on phylogenetic discordance and core/accessory status; a directly reconstructed phaC gene tree is needed to identify incongruent branches. 1
Data Sources
From the KBase Data Lakehouse pangenome collection (kbase_ke_pangenome), the project used the eggnog_mapper_annotations, gene_cluster, gtdb_species_clade, pangenome, genome, ncbi_env, and alphaearth_embeddings_all_years tables, supplying eggNOG annotations, gene clusters, GTDB clades, genomes, environment metadata, and AlphaEarth embeddings. 1
From the NMDC Arkin collection (nmdc_arkin), the project used the study_table, abiotic_features, taxonomy_features, taxonomy_dim, kegg_ko_terms, metabolomics_gold, trait_features, and embedding_metadata tables. 1
Figures
phb_prevalence_by_phylum.png— horizontal bar chart of PHB pathway prevalence across 20 major phyla. 1phb_pathway_completeness.png— bar chart of pathway completeness categories across all 27K species. 1phb_core_vs_accessory.png— stacked bar chart of phaC core vs accessory status by phylum. 1phb_by_environment.png— PHB prevalence by environment type, color-coded by expected variability. 1embedding_variance_phb.png— box plots of AlphaEarth embedding variance for PHB+ vs PHB- species. 1genome_size_confound.png— three-panel analysis of genome size distributions (PHB+ vs PHB-), genome size vs niche breadth, and PHB enrichment by environment within genome size quartiles. 1phb_enrichment_heatmap.png— PHB prevalence by order within six major phyla. 1nmdc_phb_by_environment.png— NMDC PHB inference score distribution and pangenome matching coverage. 1nmdc_phb_vs_abiotic.png— PHB score vs top abiotic correlates (depth, temperature, max depth, min depth). 1pangenome_vs_metagenome.png— genus-level pangenome PHB prevalence vs NMDC metagenomic abundance. 1
Proposed Future Work
The report proposes, but has not performed, using the full 64-dimensional AlphaEarth embeddings rather than variance alone, with dimensionality reduction, to map PHB+ vs PHB- species in environmental space and identify specific environmental axes that differentiate them. 1
It also proposes richer environmental classification of NMDC samples using the study_table ecosystem columns (ecosystem, ecosystem_category, ecosystem_type, ecosystem_subtype, specific_ecosystem) and env_triads_flattened ENVO terms; this is planned work, not a completed analysis. 1
Slots Into
- phb-granule-ecology — Central synthesis of PHB pathway distribution, environmental selection, genome-size confounding, and HGT; this finding requires a dedicated cross-project concept.
- environment-embedding-geography — AlphaEarth embedding variance, environmental breadth, and the genome-size-controlled interpretation of PHB–niche association.
- pangenome-integration — Pangenome-scale PHB prevalence, core/accessory phaC status, and NMDC metagenomic cross-validation.
- gene-function-acquisition-depth — Putative phaC acquisition and loss events, elevated accessory status among discordant species, and the need for gene-tree validation.
- horizontal-gene-transfer-driven-innovation — Putative phaC acquisitions with elevated accessory rate across diverse recipient families.
- phylogenetic-confounding-of-pangenome-associations — PHB is phylogenetically structured and phylogenetic logistic regression is still needed.
- ontology-and-category-schema-sensitivity — PHA synthase class assignment failed because eggNOG uses Pfam domain names rather than accession IDs.
- cultivation-collection-bias-in-ecological-genomics — Sparse species environment metadata and terrestrial/soil bias of NMDC studies.
- sampling-depth-and-downsampling-effects — Limited AlphaEarth embedding coverage may skew niche-breadth analysis toward better-sampled lineages.
- functional-marker-validation — phaA/phaB pleiotropy makes precursor genes weak markers of partial PHB capability.
- genomic-under-representation — Mixed complete genomes and metagenome-assembled genomes with variable gene detection rates.