Raw report: harvard_forest_warming Feeds into: callability-limited-comparative-inference, confirmatory-exploratory-ecological-association-discordance, ecotype-environment-gene-content, environment-embedding-geography, functional-marker-validation, long-term-soil-warming-microbial-response, multi-omics-integration, occurrence-versus-catabolic-activity, soil-horizon-response-heterogeneity, study-batch-confounding-of-environmental-associations, taxonomic-resolution-dependent-functional-inference
Overview
A 25-year +5°C soil-warming experiment at Harvard Forest Barre Woods (NMDC nmdc:sty-11-8ws97026; 42 biosamples) produced a real but modest community-level response that reproduced the published Actinobacteria-up/Acidobacteria-down signal and a structured functional-gene response of approximately 12% R² in DNA and 10–11% in RNA. Once the horizon × incubation confound was removed, DNA and RNA responses were comparable, so the proposed hypothesis that RNA shifts more than DNA was not supported. All analyses used nmdc_metadata and nmdc_results tables and did not use nmdc_arkin. 1
Key findings
-
In 14 control and 14 heated direct samples, kraken2 read-based relative abundance showed Actinobacteria increasing from 0.249 to 0.315 in organic soil (log2 FC +0.341, q=0.049) and Acidobacteria decreasing from 0.035 to 0.024 (log2 FC −0.549, q=0.049). Cyanobacteria changed from 0.0032 to 0.0026 (log2 FC −0.305, q=0.072), Proteobacteria from 0.654 to 0.605 (log2 FC −0.111, q=0.088), and Verrucomicrobia from 0.0058 to 0.0041 (log2 FC −0.513, q=0.088); mineral soil showed no phylum-level changes after false-discovery-rate (FDR) correction. Figure
03_phylum_bars.pngshows stacked bars of phylum-level community composition per sample. 1 -
PERMANOVA (permutational multivariate analysis of variance) on Bray–Curtis genus distances attributed 7.6% of variance to treatment (p=0.069), 30.6% to horizon (p=0.0002), and 41% to the treatment × horizon four-cell factor (p=0.0002). The mineral horizon showed no phylum-level changes after FDR correction. 1
-
In the paired n=25 subset, treatment pseudo-F was 3.12 in DNA (R²=11.9%, p=0.020) and 0.76 in RNA (R²=3.2%, p=0.60), but this subset confounded horizon with incubation because every organic sample was incubated and every mineral sample was direct. In direct-sample sensitivity analyses, DNA × mineral had n=14, F=1.75, R²=12.7%, p=0.081; RNA × mineral had n=11, F=1.15, R²=11.4%, p=0.254; and RNA × organic had n=14, F=1.33, R²=10.0%, p=0.190. The paired result seemingly contradicted H1 (RNA composition shifts more than DNA under warming) in the opposite direction, but once the confound is removed DNA and RNA pools show comparable treatment R² (10-13%), so H1 is not supported and these results do not support the premise that the transcript pool is more sensitive to long-term warming. Figure
04_dna_vs_rna_pcoa.pngshows side-by-side PCoA (principal coordinates analysis) panels for DNA-pool and RNA-pool KO compositions. 1 -
A curated 62-KO (KO = KEGG Orthology gene family) carbon-cycling list covering CAZymes, peptidases, TCA, β-oxidation, aromatic catabolism, methane and C1 was tested for enrichment among heated-up KOs (q<0.10, log2 FC > 0), and was enriched among heated-up DNA KOs in organic soil: 5 of 57 carbon-cycling hits versus 428 of 12,806 other hits, Fisher odds ratio 2.78 and one-sided p=0.042. DNA × mineral had 0 of 57 carbon-cycling hits and 2 of 12,806 other hits (odds ratio 0.0, p=1.0); RNA × organic had 0 of 57 and 0 of 14,245 (NaN, p=1.0); and RNA × mineral had 0 of 57 and 0 of 14,245 (NaN, p=1.0). 1
-
No individual RNA KO survived FDR (q<0.10) at n=11+11 across 14K KOs, so the significant DNA-organic set enrichment has no individual-KO counterpart in the transcript pool; the report treats only the direction of the strongest RNA signals as biologically interpretable. Figure
05_c_cycling_volcano.pngdisplays per-KO heated-versus-control differential abundance with carbon-cycling KOs highlighted. 1 -
RNA signals for particulate methane monooxygenase were directionally positive across both horizons: pmoA (K10944) had log2 FC +0.730 in organic soil (p=0.009) and +0.743 in mineral soil (p=0.029), while pmoB (K10945) had +0.669 in organic soil (p=0.012) and +0.880 in mineral soil (p=0.054). These individual signals were nominal and did not survive FDR across 14K KOs. Figure
08_synthesis.pngspotlights the pmoA/pmoB and glyoxylate-cycle signals in the RNA pool. The glyoxylate-cycle genes isocitrate lyase aceA/icl (K01637) and malate synthase aceB/glcB (K01638) increased in heated mineral RNA, with log2 FC +0.460 and +0.268, respectively, and p=0.037 for each. Chitinase chiA (K01183) increased in heated organic RNA (log2 FC +0.236, p=0.074), whereas lpdA (K00382), associated with TCA/pyruvate dehydrogenase metabolism, decreased (log2 FC −0.161, p=0.021). These carbon-cycling RNA-pool p-values are all nominal; none survives FDR across 14K KOs. 1 -
Warming responses were mostly horizon-specific. Organic-versus-mineral KO log2 FC correlations were Pearson r=0.075 (p=1.78e-17) and Spearman ρ=0.216 (p=2e-134) for DNA, and Pearson r=0.034 (p=6e-5) and Spearman ρ=0.120 (p=4e-47) for RNA. Approximately 39% of DNA KOs were organic-only, mineral-only, or sign-flipping; however, the curated carbon-cycling list was not differentially enriched in horizon-specific classes (odds ratio <1, p>0.87 everywhere), so the curated carbon-cycling categories are not the primary driver of the horizon × warming interaction. Figure
06_horizon_interaction.pngplots per-KO organic versus mineral warming log2 fold changes with carbon-cycling KOs highlighted. 1 -
Heated mineral samples had significantly fewer detectable metabolites (a ~7% drop), with 155 ± 4 ChEBI identifications per sample versus 167 ± 9 in control mineral samples (Mann–Whitney p=0.012). Organic samples showed the same direction but not significance: 160 ± 13 in heated soil versus 173 ± 6 in control soil (p=0.209). No individual metabolite passed BH-FDR; nominal signals included ChEBI:71028, present in 11/11 heated versus 6/11 control samples (p=0.035), ChEBI:30918, present in 0/11 heated versus 6/11 control samples (p=0.012), and ChEBI:27967, present in 10/11 heated versus 5/11 control samples (odds ratio 12, p=0.063). Figure
07_metabolite_heatmap.pngshows the presence pattern of the top 30 differential ChEBI identifications across 22 samples, and07_metabolite_scatter.pngplots heated-positive versus control-positive sample counts for the top differential ChEBI identifications. 1 -
The sample design contained 42 biosamples across treatment, organic versus mineral horizon, and direct versus laboratory-incubated conditions. The DNA cohort contained n=28 samples and the RNA cohort n=39; organic-horizon DNA samples were all laboratory-incubated, while the NMDC pipeline did not produce metagenomes from organic-direct or some mineral-direct samples, so direct organic DNA is absent and coverage is unbalanced, which drives the direct-sample sensitivity caveat on the DNA-versus-RNA comparison. The metatranscriptome recovered 14,302 distinct KOs versus 12,863 in the metagenome. Figure
01_design.pngis a sample-by-omics-layer coverage matrix. 1 -
Figure
08_synthesis.pngcombines the six key findings in a multi-panel synthesis: phylum-level treatment effect (A), PERMANOVA R² by factor × pool (B), H1 (RNA-more-sensitive hypothesis) sensitivity in direct samples (C), carbon-cycling enrichment (D), RNA spotlight on methanotrophy and glyoxylate (E), and per-sample metabolite richness (F). 1
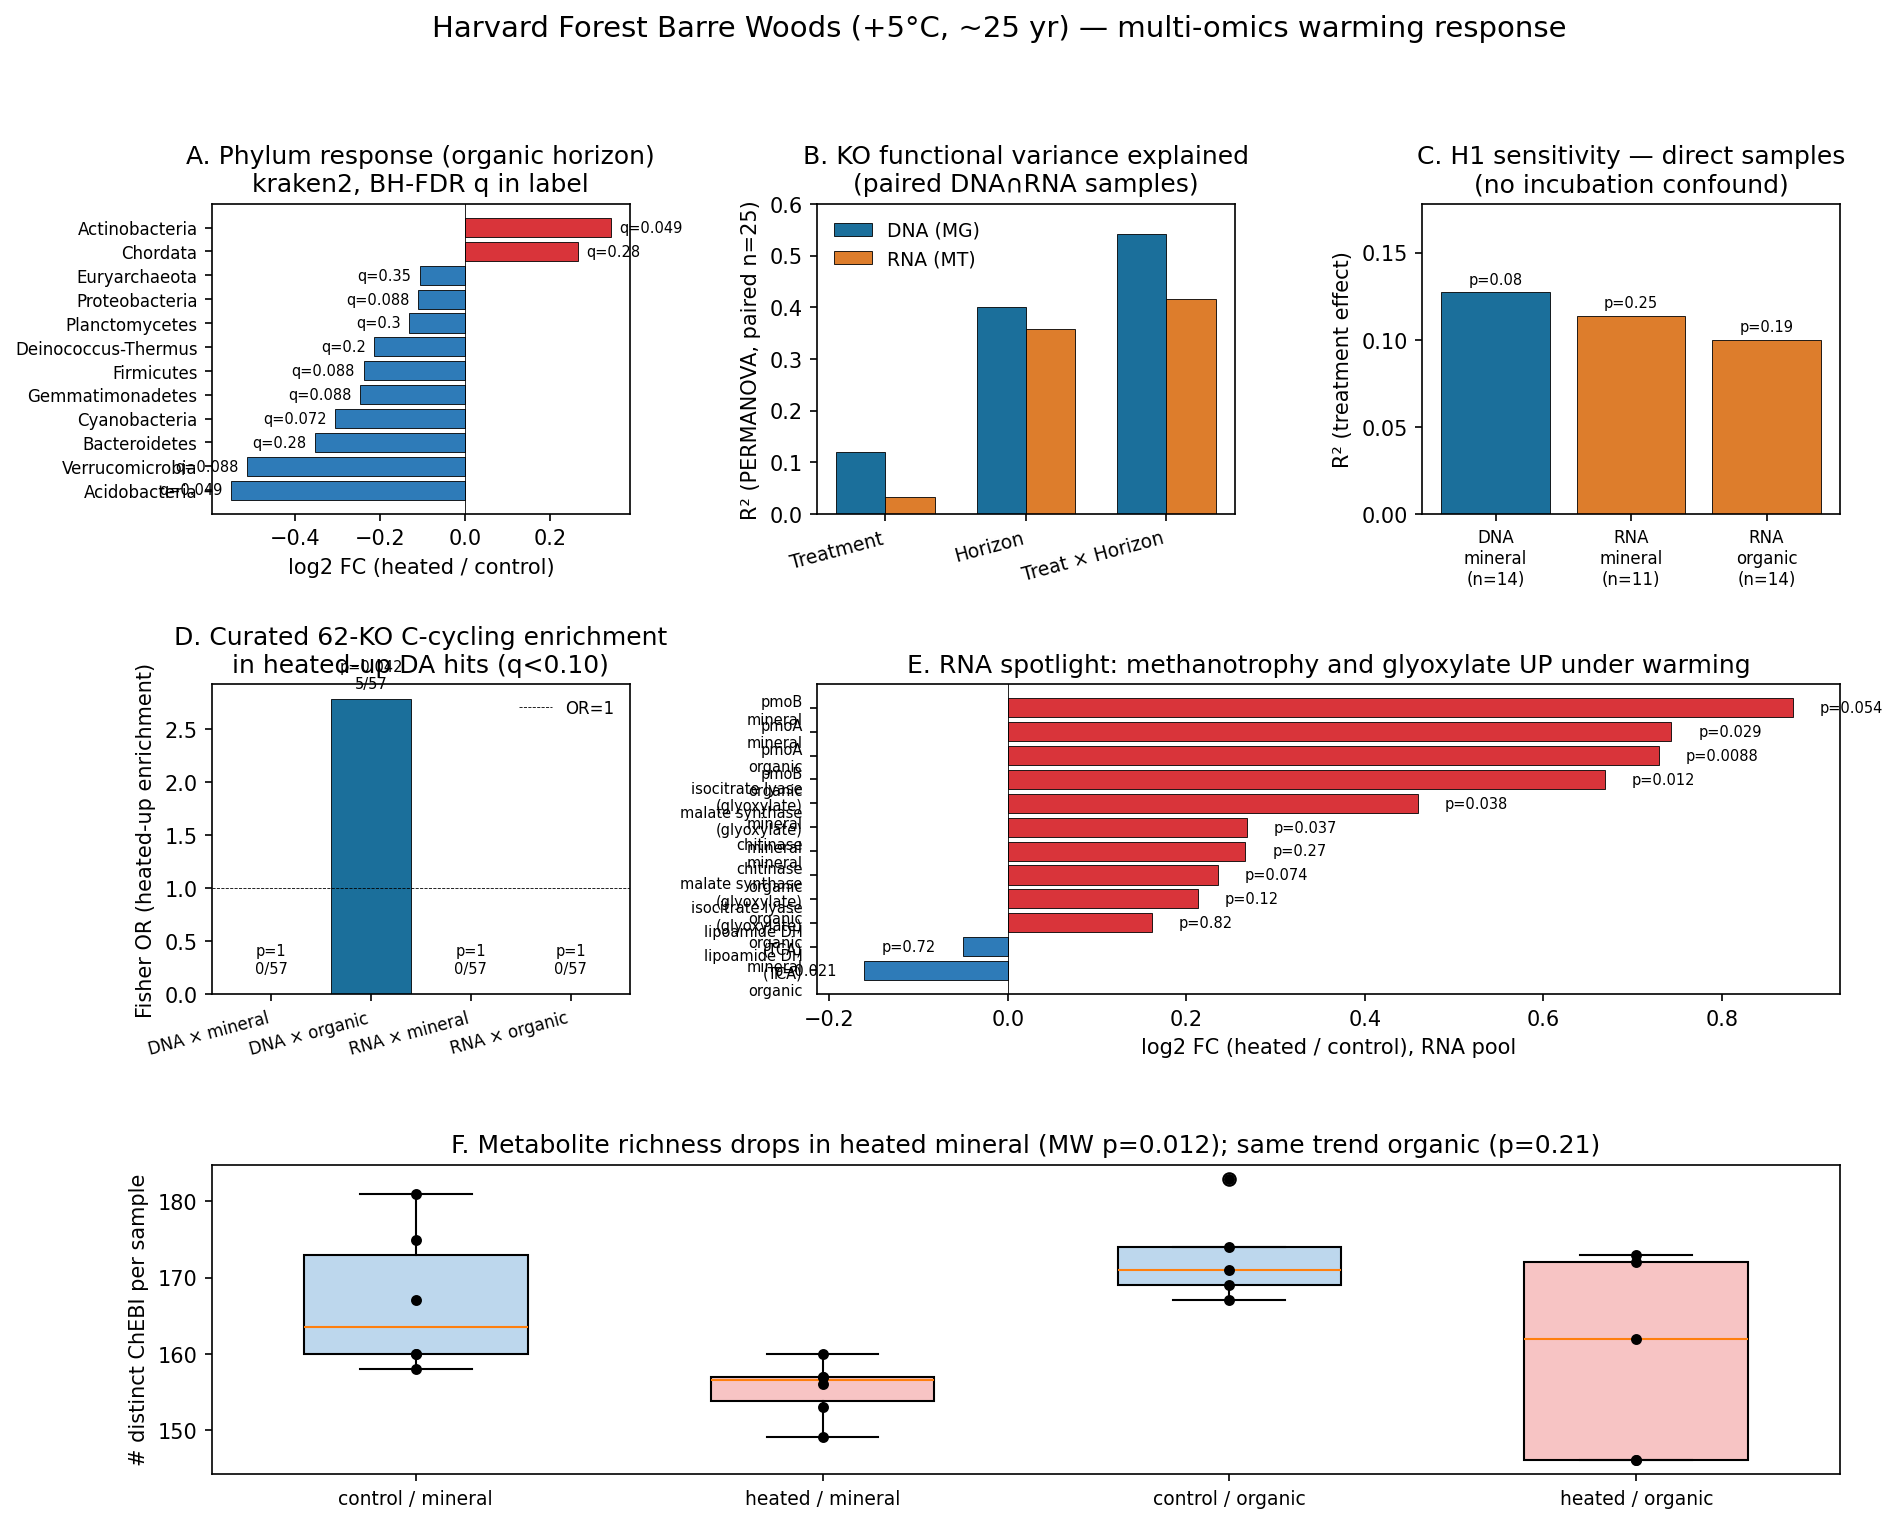 Spotlight on pmoA/pmoB and glyoxylate cycle in RNA pool. From harvard_forest_warming.
Interpretation and literature context
The report proposes compositional dilution as one reason the RNA pool lacked a dominant treatment axis: the metatranscriptome recovered 14,302 distinct KOs versus 12,863 in the metagenome, and this richer rare-organism repertoire increases per-KO variance under a relative-abundance framework and reduces power to detect treatment-level shifts in any single category. This is an author-proposed explanation, not a tested result. 1
A second proposed explanation is hypothetical: if chronic warming reduced substrate quantity and quality (citing Domeignoz-Horta et al. 2022), the active transcriptome may be globally down-shifted across many functional categories rather than redistributed, leaving no preferred axis of treatment-driven variance in the RNA pool even as the underlying community diverges. The report did not measure this mechanism. 1
A further author-proposed explanation is that compositional turnover has caught up: H1 assumes transcript-level regulatory response precedes genome-content turnover, an asymmetry plausible on weeks-to-years timescales, but the Barre Woods plots have been heated since ~1991, and the report argues 25 years is enough for genome content to reflect warming-selected lineages, citing DeAngelis et al. (2015) and Pold et al. (2016) for strong genome-content shifts at the site. Once the DNA-level community has equilibrated, the RNA/DNA ratio of warming sensitivity would collapse toward 1. This is proposed, not demonstrated. 1
The organic-horizon Actinobacteria-up/Acidobacteria-down signal (q=0.049) is described as reproducing the 16S-amplicon and metagenome warming signature from the same Harvard Forest research team: DeAngelis et al. (2015) reported Actinobacteria, Alphaproteobacteria and Acidobacteria as the phyla with the strongest warming responses across 5/8/20-year warmed plots, most pronounced in the organic horizon, and Pold et al. (2016) reported that warming increases the fraction of carbohydrate-degrading genes affiliated with Actinobacteria. 1
The report links the heated-mineral metabolite-richness drop (155 vs 167 ChEBI, p=0.012) qualitatively to a substrate-depletion narrative: Melillo et al. (2017, Science), a long-term soil-carbon feedback study at the sister site Prospect Hill rather than a measurement from this analysis, documented a 4-phase oscillating soil-carbon loss trajectory under +5°C warming, and Domeignoz-Horta et al. (2022), in 28-year warmed plots, attributed the apparent warming response to reduced substrate quantity and quality rather than thermal acclimation. The report calls its finding the molecular signature this model predicts, but the link is interpretive rather than quantitative metabolomics evidence. 1
Tension with prior metatranscriptomics: Roy Chowdhury et al. (2021), the closest methodological precedent at the same site, reported a larger treatment effect on KEGG transcripts than on CAZymes and ~68% of differentially expressed CAZyme transcripts upregulated in heated soils. The comparable DNA and RNA responses here (10-13% R²) are in tension with their larger transcript-level effect, although the comparison is complicated by different sampling timepoint, replication and analytical pipeline; their CAZyme up-direction is consistent with the chitinase up-result here. 1
Choudoir et al. (2025) reported that pangenomes of Harvard Forest heated-plot isolates are enriched in central carbohydrate and nitrogen metabolism and show reduced codon usage bias; the report offers this as context suggesting the hypothesis that the DNA-level Actinobacteria enrichment reflects sub-clade selection rather than only a compositional shift. 1
The pmoA/pmoB upregulation in both horizons is described as unexpected for an aerated temperate forest; Zhang et al. (2024, Sci. Total Environ.), cited as an external forest-warming methanotroph-activation precedent rather than evidence generated here, reported, in subtropical forest +4°C warming experiments, a 12-61% increase in net CH₄ uptake across soil depths and a rise in high-affinity USCα methanotrophs at 0-10 cm. The report’s mechanism, that warming-induced moisture decrease increases CH₄ availability for methanotrophs, is interpretive and not a direct flux measurement at Harvard Forest. 1
Aliyu et al. (2016, FEMS Microbiol. Ecol.) is cited as an external glyoxylate-shunt induction precedent for coordinated icl/aceA and aceB/glcB upregulation as a signature of stress or C2-substrate utilization in Actinobacteria; the report calls the heated-mineral RNA glyoxylate signal mechanistically self-consistent with Actinobacteria enrichment at this site, which is context rather than proof of mechanism. 1
The authors describe this as, to their knowledge, the first explicit comparison of DNA-pool and RNA-pool warming response variance in a paired-sample design at Harvard Forest, including the H1 sensitivity check showing that the apparent DNA-versus-RNA imbalance is largely a horizon × incubation artifact; they call the methanotrophy-up plus glyoxylate-up RNA signature previously unreported at this site, while acknowledging published precedents elsewhere. 1
Caveats
-
The study used a single sampling date, 2017-05-24, so it cannot detect seasonal effects, which the report notes Shinfuku et al. 2024 show are substantial at this site. 1
-
Omics-rich layers had limited sample sizes (n=28 metagenomes and n=39 metatranscriptomes), reducing per-KO FDR power across 12–14K KOs. 1
-
Metatranscriptome KO counts came from contig annotations and represent transcript-pool composition rather than TPM-quantified expression; contig-level annotation counts approximately represent relative transcript abundance but are biased by assembly quality. 1
-
The paired DNA/RNA comparison is affected by the horizon × incubation confound, and organic-horizon DNA lacks direct samples, preventing incubation from being factored cleanly out of that DNA analysis. 1
-
Because all samples were collected on a single date (2017-05-24), the single-timepoint RNA pool may include diurnal and microspatial variation from moisture pulses, root-exudate availability, and temperature conditions that are unrelated to chronic warming. The report therefore treats comparable long-term DNA and RNA response magnitude as compatible with, but not excluding, an earlier transient in which RNA could lead DNA. 1
-
abiotic_featureswas all zeros for these samples because of an NMDC parsing artifact, so the analysis lacked in-lakehouse soil temperature, pH, and nitrogen measurements; the +5°C treatment label was the only environmental contrast. 1 -
The project excluded
nmdc_arkin, so it had no quantitative NOM (natural organic matter), metabolomics, or proteomics layers, although equivalent quantitative layers exist innmdc_arkin.{nom_gold, metabolomics_gold, proteomics_gold}and could be added if scope expands. The ChEBI labels for the differential metabolite hits were not resolved through external ontologies. 1 -
The pmoA/pmoB and glyoxylate-cycle findings are directional gene-level signals, and the individual RNA signals did not survive FDR across 14K KOs. The report interprets the heated-mineral metabolite-richness decrease as consistent with faster substrate turnover, but it is not quantitative metabolomics evidence. 1
Data products and provenance
NMDC study nmdc:sty-11-8ws97026 is the data source, with PI Jeffrey Blanchard of the University of Massachusetts Amherst; the report lists chris-mungall (Chris Mungall, Lawrence Berkeley National Laboratory, ORCID 0000-0002-6601-2165) as an author. 1
data/sample_design.tsvhas 42 rows of per-biosample treatment × horizon × incubation × plot factors plus an omics-layer presence matrix;data/workflow_runs.tsvhas 477 rows linking all 42 biosamples to workflow run ids and types.data/ko_counts_by_sample.tsv.gzhas 561,330 rows of KEGG KO counts per biosample, source (DNA or RNA) and KO;data/pfam_counts_by_sample.tsv.gzhas 257,988 rows of Pfam domain counts per biosample (DNA only).data/kraken2_taxa_by_sample.tsv.gzhas 189,465 rows of read-based taxonomy abundances per biosample, rank and taxon;data/mags_by_sample.tsv.gzhas 298 rows of GTDB-Tk MAG (metagenome-assembled genome) taxonomy per biosample.data/metabolite_ids_by_sample.tsv.gzhas 4,367 ChEBI metabolite identifications per biosample with similarity scores — identifications, not quantitative concentrations.data/05_*files hold per-KO differential abundance by pool × horizon (54K rows), carbon-cycling enrichment, and the H1 direct-sample sensitivity results. 1
Notebook 04_dna_vs_rna_divergence.ipynb ran the paired n=25 PERMANOVA on DNA and RNA KO pools plus a Procrustes alignment test, and 05_c_cycling_enrichment.ipynb ran per-KO differential abundance per pool × horizon, Fisher’s exact enrichment of the curated 62-KO list, and the H1 sensitivity check in direct samples. 1
01_design.png: sample × omics-layer coverage matrix with treatment/horizon color bars.03_taxa_pcoa.png: PCoA on Bray–Curtis distances of kraken2 genus relative abundance (treatment × horizon).03_phylum_bars.png: stacked bars of phylum-level community composition per sample.04_dna_vs_rna_pcoa.png: side-by-side PCoA panels for DNA-pool and RNA-pool KO compositions.05_c_cycling_volcano.png: 4-panel volcano plot per pool × horizon with curated carbon-cycling KOs highlighted.06_horizon_interaction.png: scatter of per-KO log2 FC (organic vs mineral) for DNA and RNA.07_metabolite_heatmap.png: top 30 differential ChEBI presence pattern across 22 samples.07_metabolite_scatter.png: heated-positive vs control-positive sample counts for top differential ChEBI.08_synthesis.png: 6-panel synthesis of phylum effect, PERMANOVA R², H1 sensitivity, carbon-cycling enrichment, RNA spotlight and metabolite richness. 1
Follow-up directions proposed in the report
A cross-study meta-analysis linking to other NMDC warming studies — SPRUCE peatland nmdc:sty-11-33fbta56 and Alaskan permafrost thaw nmdc:sty-11-db67n062 — is proposed to test whether the methanotrophy-up signature is reproducible across sites; that reproducibility is untested here. 1
MAG-level pmoA tracking is left open: which specific MAGs in the 298-MAG cohort carry the upregulated pmoA/pmoB, and whether they are USCα methanotrophs (per Zhang et al. 2024) or distributed across phyla, is unresolved. 1
The report proposes, as an explicit hypothesis rather than a finding, a “ruderal subset” in which warming activates a community fraction characterized by Actinobacteria, glyoxylate-cycle-active organisms and methanotrophy, to be tested by cross-linking these results to Choudoir et al. 2025 pangenome data. 1
Slots Into
- multi-omics-integration — compares DNA and RNA functional-pool responses while integrating taxonomy, KO composition, and metabolite richness; 1
- ecotype-environment-gene-content — links long-term warming, horizon-specific community composition, and functional-gene content, including Actinobacteria enrichment and carbon-cycling responses; 1
- environment-embedding-geography — provides a Harvard Forest soil-warming case in which organic versus mineral horizon structures the observed environmental response; 1
- pangenome-integration — supplies genome-content and functional-gene evidence that can be compared with Harvard Forest pangenome-level adaptation findings; 1
- long-term-soil-warming-microbial-response — organic-horizon Actinobacteria-up/Acidobacteria-down shift, DNA-organic carbon-cycling enrichment, nominal pmoA/pmoB and glyoxylate RNA signals, and substrate-depletion literature context; 1
- soil-horizon-response-heterogeneity — horizon dominates PERMANOVA variance, KO warming responses correlate weakly across horizons, and metabolite-richness loss is significant only in mineral soil; 1
- functional-marker-validation — a curated 62-KO carbon-cycling marker list used as an enrichment test set; 1
- confirmatory-exploratory-ecological-association-discordance — set-level enrichment and nominal gene and metabolite signals that do not survive per-feature FDR at small n; 1
- cross-condition-metabolic-comparability — ChEBI metabolite hits left without resolved labels because no external ontology was queried; 1
- callability-limited-comparative-inference — missing organic-direct metagenomes and a single timepoint constrain which DNA/RNA and seasonal comparisons can be made; 1
- study-batch-confounding-of-environmental-associations — the horizon × incubation confound produced an apparent DNA-over-RNA imbalance that vanished in direct-sample sensitivity tests; 1
- taxonomic-resolution-dependent-functional-inference — community-level pmoA/pmoB transcript signals not yet assigned to specific MAGs in the 298-MAG cohort; 1
- occurrence-versus-catabolic-activity — pmoA/pmoB transcript signals interpreted as methanotrophy without direct CH₄ flux measurement at the site; 1