Key Findings
Finding 1 — Black Queen dynamics are detectable at community scale
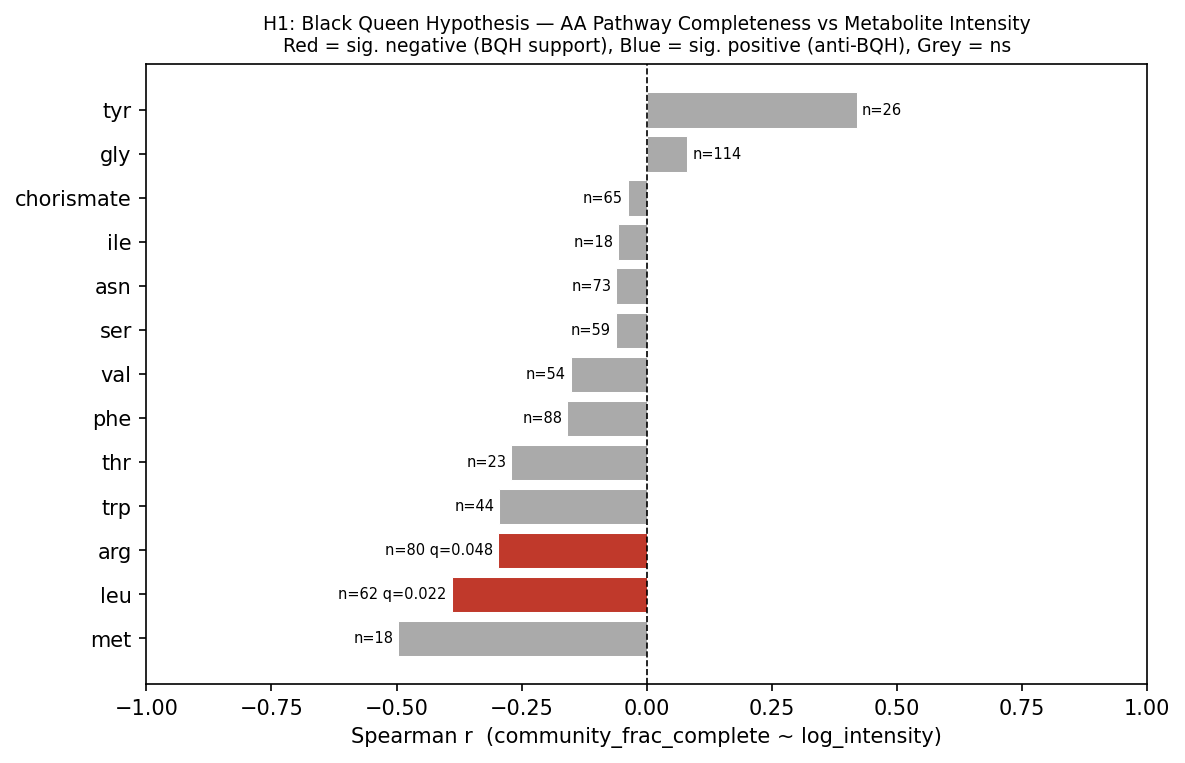
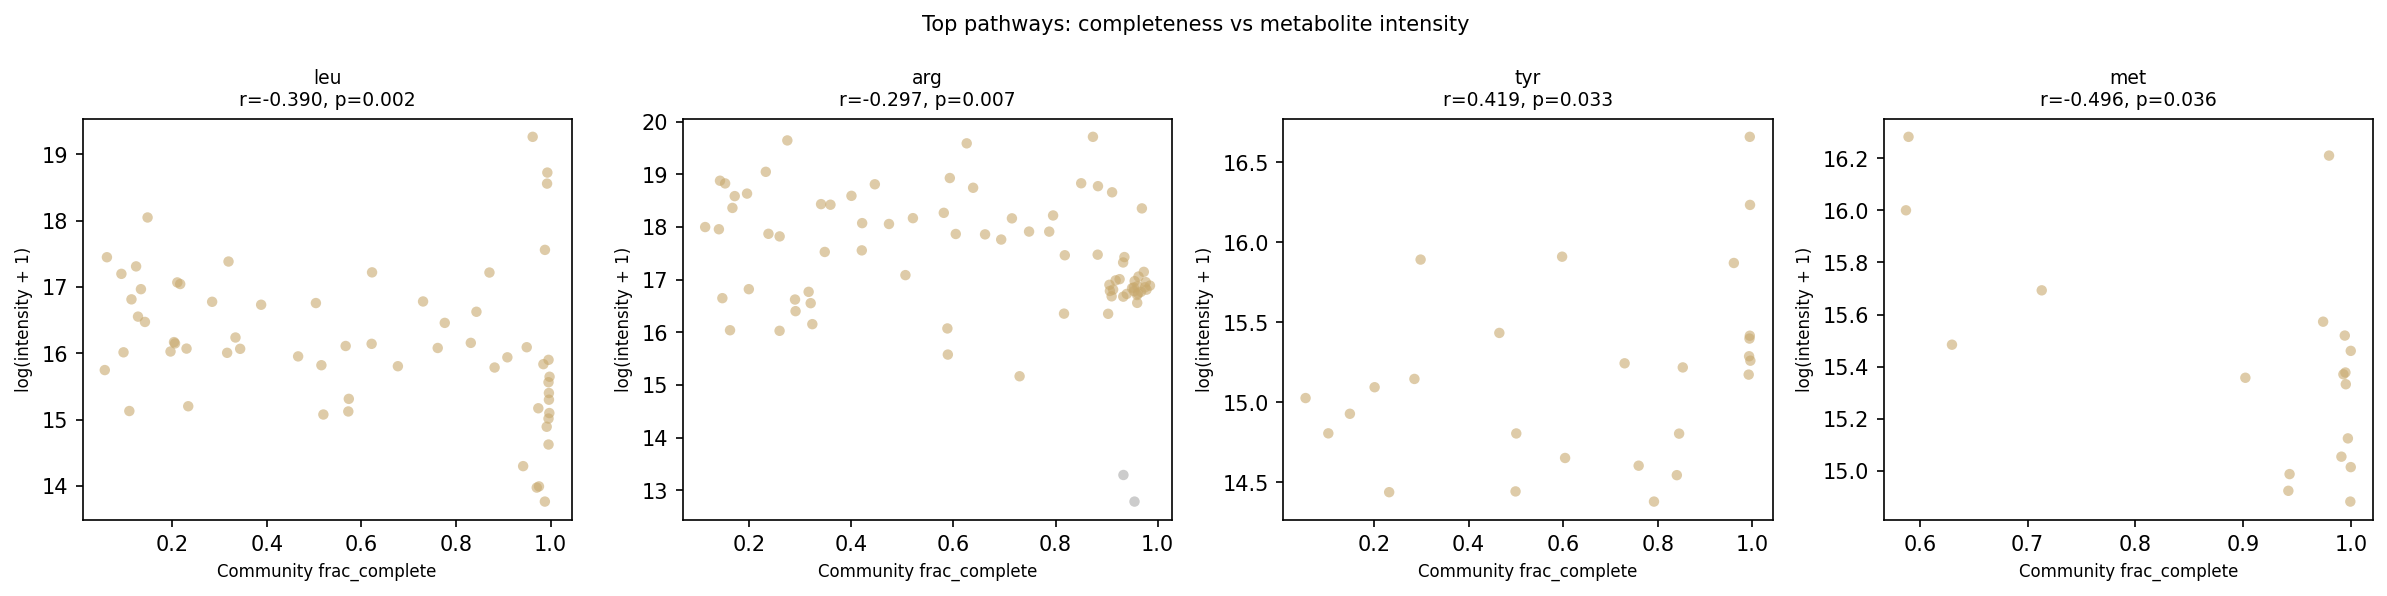
Across 13 testable amino acid biosynthesis pathways, 11 of 13 (85%) showed negative Spearman correlations between community pathway completeness and ambient amino acid metabolite intensity — the direction predicted by the Black Queen Hypothesis (BQH). Two pathways reached significance after Benjamini-Hochberg FDR correction (q < 0.05): leucine biosynthesis (r = −0.390, q = 0.022, n = 62) and arginine biosynthesis (r = −0.297, q = 0.049, n = 80). Methionine biosynthesis showed the largest effect (r = −0.496) but was limited by sample size (n = 18, q = 0.117). A binomial sign test confirmed that the majority-negative direction is significantly non-random (p = 0.011), indicating a weak but consistent community-scale BQH signal.
One outlier was tyrosine (r = +0.419, ns), whose anti-BQH direction may reflect alternative tyrosine sources (e.g., phenylalanine hydroxylation) complicating the biosynthesis-vs-availability relationship. Isoleucine biosynthesis (r = −0.057, n = 18, q = 0.823) is testable as the 13th pathway but shows no BQH signal at this sample size.
(Notebook: 05_statistical_analysis.ipynb)
Finding 2 — Community metabolic potential separates strongly by ecosystem type
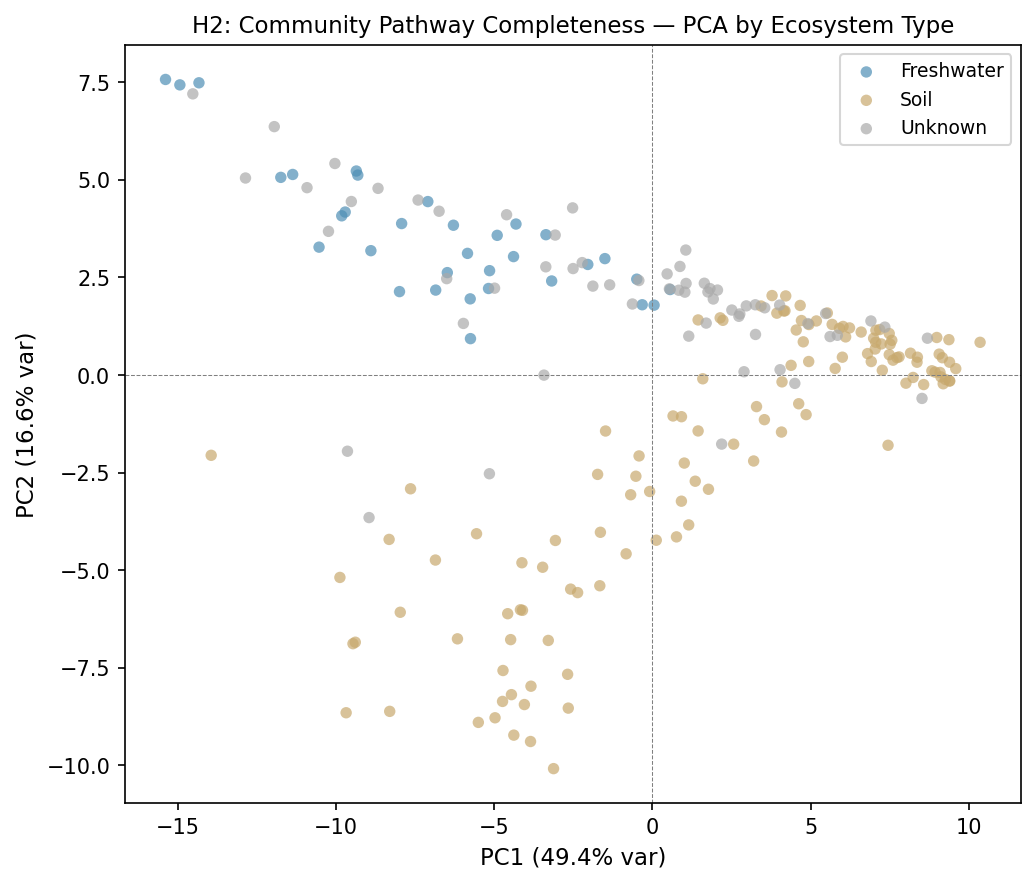
PCA of the 220-sample × 80-pathway completeness matrix captured 49.4% of variance in PC1 and 16.6% in PC2 (83% total in PC1–5). Soil and Freshwater communities occupied nearly non-overlapping regions of PC space: Kruskal-Wallis across three ecosystem types was highly significant on both PC1 (H = 52.98, p < 0.0001) and PC2 (H = 123.74, p < 0.0001). The pairwise Soil vs. Freshwater separation was extreme (Mann-Whitney U = 3,674, p < 0.0001; median PC1 Soil = +3.86, Freshwater = −6.28).
PC1 is loaded almost entirely on carbon utilization pathways (glucuronate, fumarate, succinate, cellobiose, galactose) with near-uniform positive loadings — indicating that Soil communities have broadly higher carbon substrate completeness than Freshwater communities. Amino acid pathways load more strongly on PC2, separating within the Soil cluster.
(Notebook: 05_statistical_analysis.ipynb)
Finding 3 — Amino acid pathway completeness differs across ecosystem types for 17 of 18 pathways
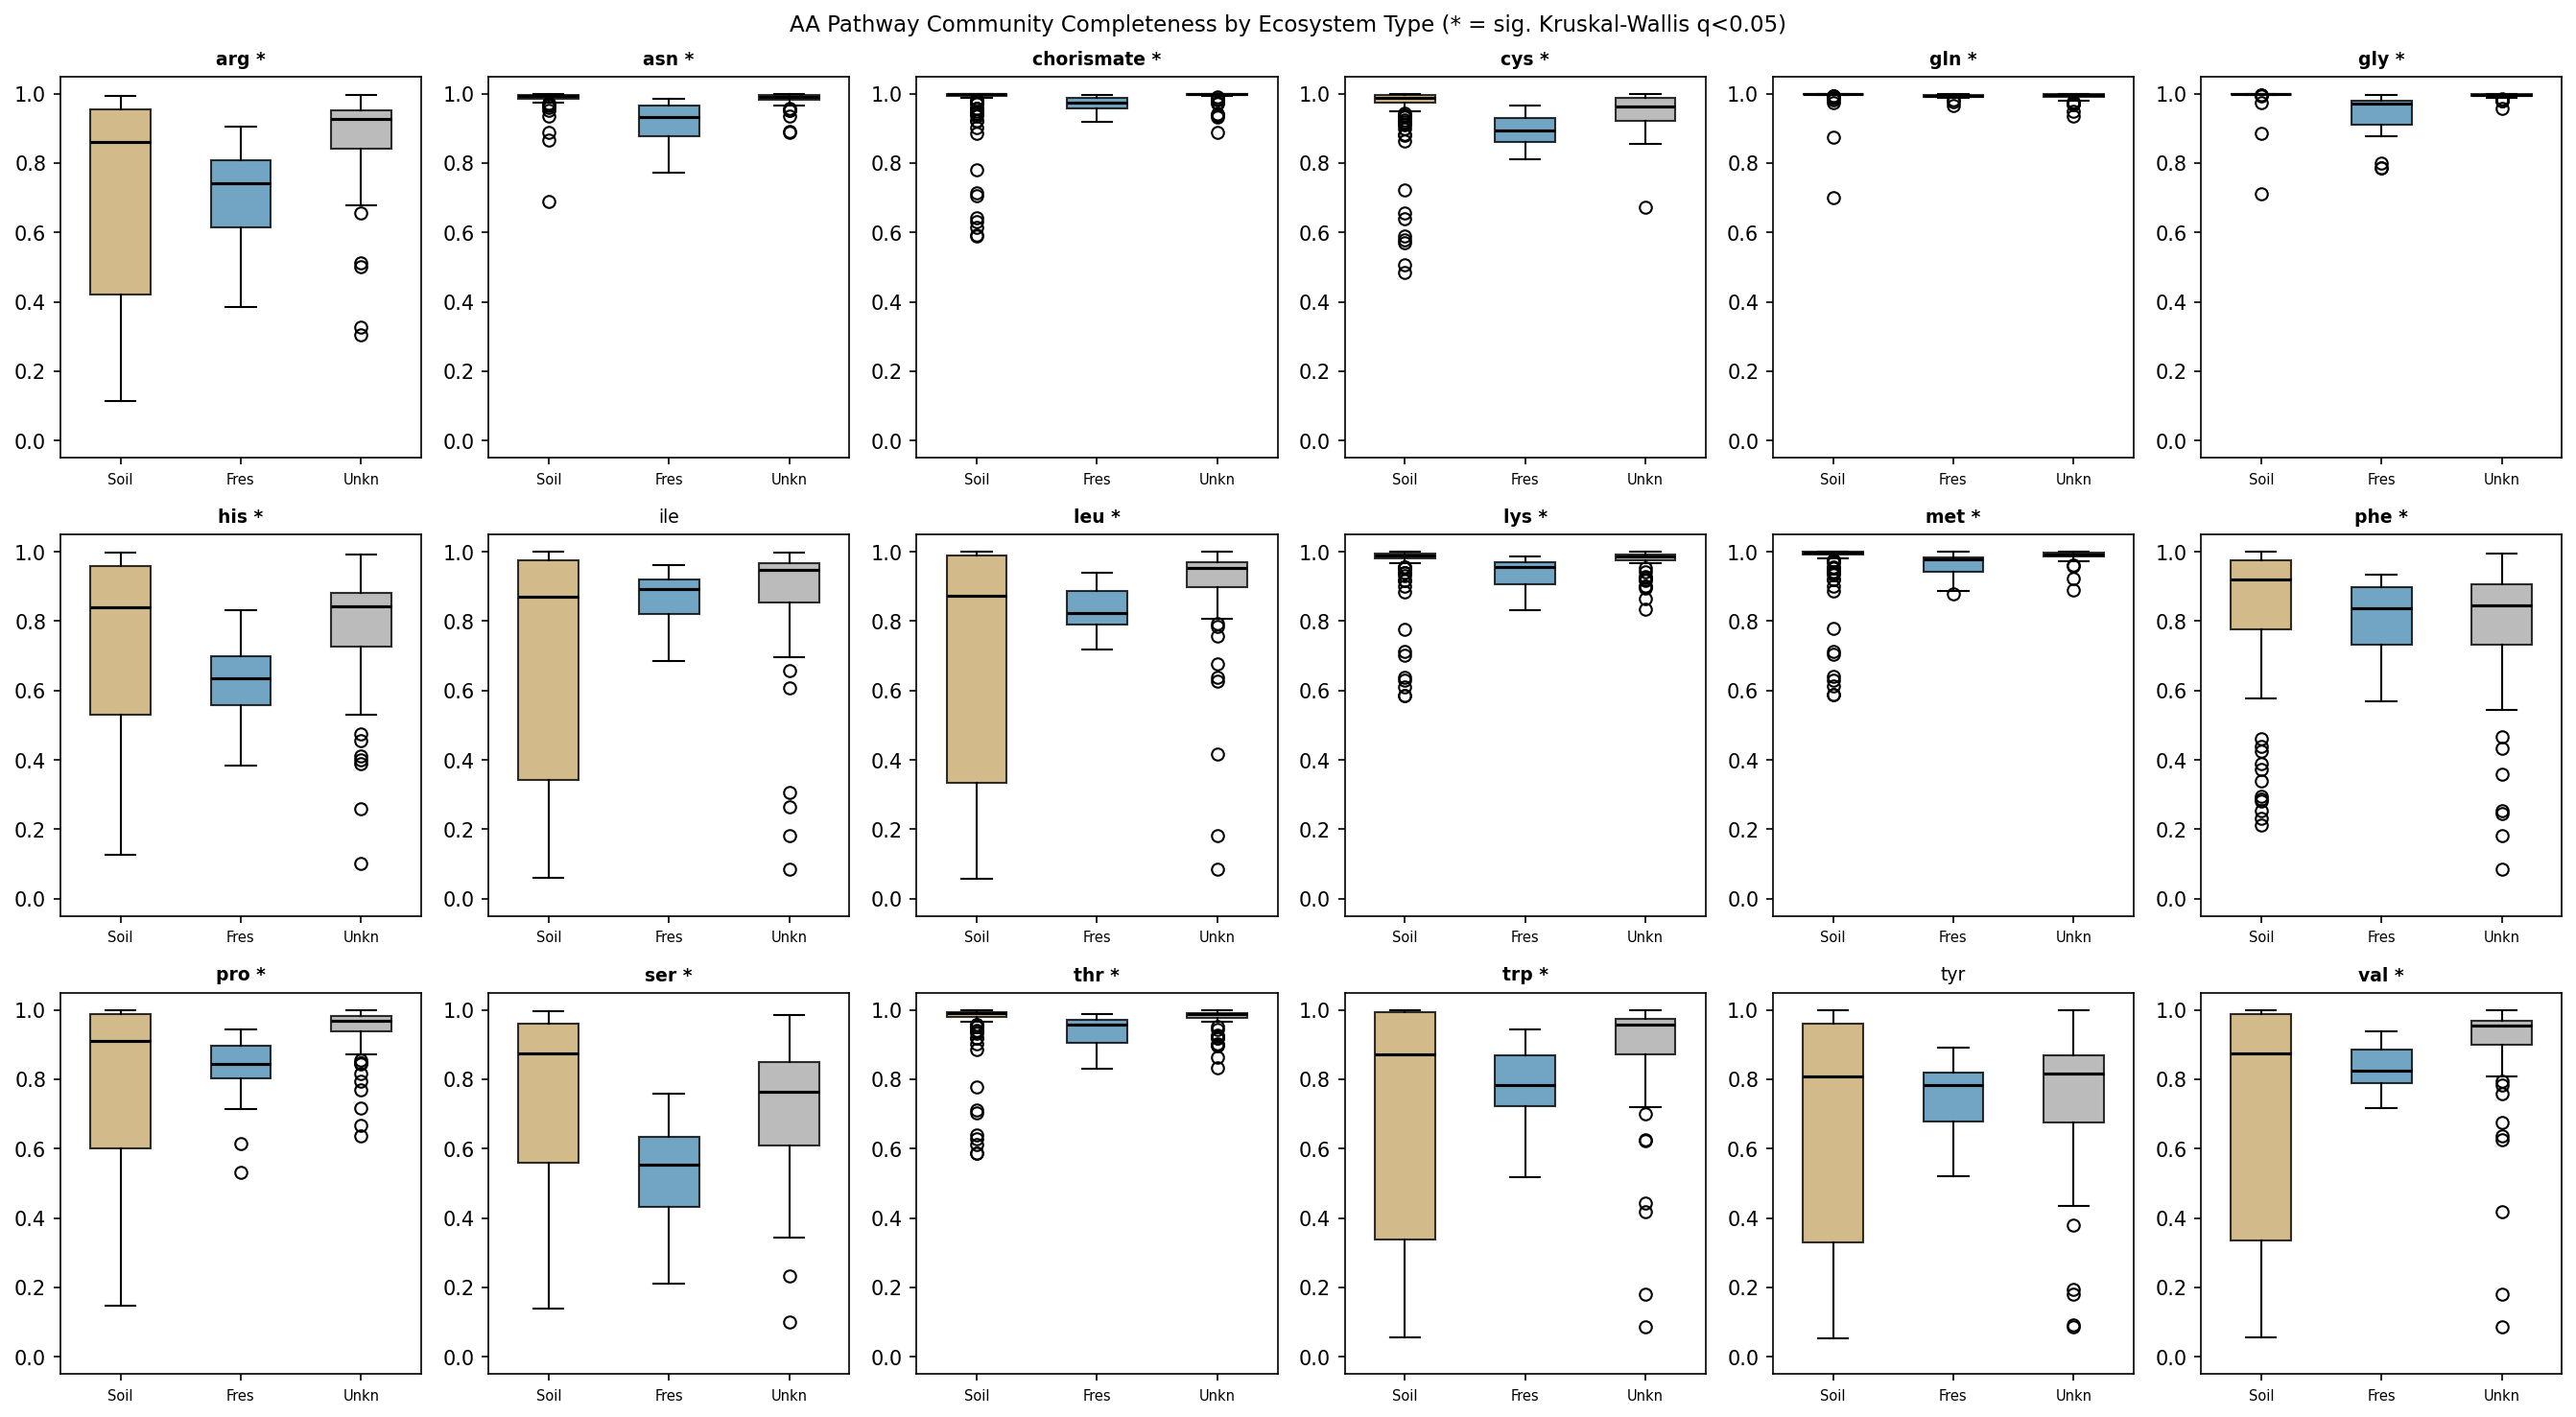
Per-pathway Kruskal-Wallis tests (BH-FDR corrected) showed that 17 of 18 amino acid pathways have significantly different community completeness levels across ecosystem types (q < 0.05). The most extreme differences were in glycine (H = 92.98, q = 1.2×10⁻¹⁹), asparagine (H = 66.19, q = 3.8×10⁻¹⁴), and cysteine (H = 62.66, q = 1.5×10⁻¹³) biosynthesis. Only tyrosine was not significantly differentiated (q = 0.71).
(Notebook: 05_statistical_analysis.ipynb)
Results
Data Overview
| Dataset | Samples | Notes |
|---|---|---|
| Community pathway matrix | 220 | 80 GapMind pathways (18 aa, 62 carbon) |
| Metabolomics overlap | 175 | Samples with at least one metabolomics file |
| H1 analysis matrix | 131 | Samples with both aa pathway completeness and metabolomics |
| Analysis-ready matrix | 174 | Full merged matrix (pathway + metabolomics + abiotic) |
Ecosystem distribution in the full 220-sample cohort: 126 Soil, 33 Freshwater, 61 with unrecorded ecosystem type. All 33 Freshwater samples lacked paired metabolomics data in NMDC and were therefore excluded from H1 testing; they were retained for H2 (PCA) using pathway completeness alone.
Taxonomy bridge quality was high: mean bridge coverage 94.6% (all 220 samples passed the 30% QC threshold), with 92% of samples mapping ≥85% of community abundance to GTDB pangenome species.
H1: Black Queen Hypothesis
Community pathway completeness was computed using the binary frac_complete metric
(fraction of taxa in the community whose GapMind score ≥ 5, i.e., “complete” with no
missing steps). This threshold was chosen over frac_likely_complete (score ≥ 4)
because a score of 5 reflects GapMind’s unambiguous “complete” call — the taxon
possesses all required pathway steps — which maps directly onto the BQH prediction that
taxa without a complete pathway are the ones expected to depend on environmental supply.
The frac_likely_complete metric is computed in NB03 for sensitivity comparisons.
| Pathway | n | Spearman r | p | q (BH) | FDR sig? |
|---|---|---|---|---|---|
| met | 18 | −0.496 | 0.036 | 0.117 | — |
| leu | 62 | −0.390 | 0.002 | 0.022 | Yes |
| arg | 80 | −0.297 | 0.007 | 0.049 | Yes |
| trp | 44 | −0.294 | 0.052 | 0.136 | — |
| thr | 23 | −0.271 | 0.211 | 0.393 | — |
| phe | 88 | −0.159 | 0.140 | 0.303 | — |
| val | 54 | −0.151 | 0.275 | 0.446 | — |
| ser | 59 | −0.061 | 0.645 | 0.762 | — |
| asn | 73 | −0.061 | 0.610 | 0.762 | — |
| ile | 18 | −0.057 | 0.823 | 0.823 | — |
| chorismate | 65 | −0.038 | 0.765 | 0.823 | — |
| gly | 114 | +0.081 | 0.389 | 0.562 | — |
| tyr | 26 | +0.419 | 0.033 | 0.117 | — |
| gln | 4 | — | — | — | skipped |
| pro | 9 | — | — | — | skipped |
Scatter plots for the four lowest-p pathways:
Sensitivity: Soil-only stratification
To control for the strong ecosystem-type effect (Finding 2), H1 was re-run on the 125 Soil-ecosystem samples only (excluding the 6 Unknown-ecosystem samples in the H1 dataset). Results: leu remains FDR-significant (r = −0.390, q = 0.022, n = 62 — identical to the full-cohort result, since the leu samples are all Soil); arg loses FDR significance (r = −0.264, q = 0.117, n = 78) but remains directionally consistent. The binomial sign test (11/13 negative, p = 0.011) is unchanged, confirming the majority-negative direction is robust to ecosystem stratification.
Sensitivity: Study-level blocking
Study-level analysis of the H1 dataset reveals that 95% of samples (125/131) originate from a single NMDC study (nmdc:sty-11-r2h77870); the remaining 6 samples are from a second study (nmdc:sty-11-547rwq94). This means cross-study LC-MS protocol heterogeneity is effectively absent as a confounder for leu: all leu samples (n = 62) are from one study with consistent analytical methods. For arg, excluding the 6-sample second study gives r = −0.264, p = 0.019 (n = 78), confirming the arginine signal is not driven by the minor study.
(Sensitivity analyses: 05_statistical_analysis.ipynb Part 6)
H2: Ecosystem Differentiation
| Component | Variance explained | KW across ecosystem types |
|---|---|---|
| PC1 | 49.4% | H = 52.98, p < 0.0001 |
| PC2 | 16.6% | H = 123.74, p < 0.0001 |
| PC3 | 7.9% | — |
| PC4 | 5.2% | — |
| PC5 | 3.9% | — |
| Total PC1–5 | 83.0% | — |
Top PC1 loadings (most positive = Soil direction): glucuronate (0.146), fumarate (0.144), succinate (0.143), lysine (0.140), cellobiose (0.139). These are all carbon-utilization pathways with uniformly high positive loadings, indicating that Soil communities have substantially higher predicted carbon metabolic diversity than Freshwater communities.
Interpretation
H1: Black Queen Signal
The results provide weak but consistent support for community-scale Black Queen dynamics in environmental soil microbiomes. The finding that 11 of 13 tested pathways trend in the BQH-predicted direction (p = 0.011 binomial test) is notable, and the signal is robust in two sensitivity checks: it is unchanged when the analysis is restricted to Soil-ecosystem samples (soil-only: 11/13 negative, binomial p = 0.011; leu q = 0.022), and the dataset is effectively single-study — 95% of H1 samples come from one NMDC study (nmdc:sty-11-r2h77870), so cross-study LC-MS protocol heterogeneity is not a confounder for leu.
The two FDR-significant pathways — leucine and arginine — are both energetically expensive to synthesise (leucine: 37 ATP equivalents; arginine: 26 ATP equivalents), consistent with the BQH prediction that costly functions are most likely to be lost when environmental supply is reliable. Methionine shows the largest effect size (r = −0.50) but is underpowered (n = 18, q = 0.117); a larger metabolomics dataset would likely reach significance for this pathway. The leucine signal was strengthened by the isoleucine/leucine compound-mapping bug fix (r −0.326 → −0.390, q 0.045 → 0.022): three isoleucine compounds that had been misassigned to leucine had near-zero completeness-vs-metabolite correlation, diluting the true leucine signal.
The tyrosine outlier (r = +0.42) merits caution: tyrosine can be produced from
phenylalanine via non-biosynthetic hydroxylation, so communities with high
phenylalanine biosynthesis completeness — not captured in our tyr completeness
score — may still supply tyrosine, decoupling the biosynthesis-vs-pool relationship.
H2: Ecosystem Metabolic Niche
The strong ecosystem separation in PC space is consistent with the metabolic niche hypothesis: habitat physicochemistry (aquatic vs. terrestrial) selects for fundamentally different community metabolic configurations, not just different taxa. The dominance of carbon utilization pathways on PC1 (not amino acid pathways) suggests that carbon substrate availability is the primary axis differentiating ecosystem metabolic type at the community level, with amino acid biosynthesis playing a secondary (PC2-level) role.
The finding that 17/18 aa pathways differ by ecosystem type is consistent with Ramoneda et al. (2023), who found that auxotrophy rates for amino acids are taxonomically structured and environmentally distributed; freshwater taxa may be under different selective pressures regarding amino acid biosynthesis retention than their soil counterparts.
Literature Context
-
H1 direction aligns with Morris et al. (2012), who proposed that biosynthetic gene loss is selectively favoured when the environment reliably supplies the metabolite (“Black Queen”). Our data extend this to community-weighted scores at the landscape scale across diverse NMDC soil samples.
-
H1 is consistent with Mallick et al. (2019) and Noecker et al. (2016), both of which demonstrated that community metabolomics is partially predictable from genomic/metagenomic functional profiles. Our approach using GapMind pathway completeness as the predictor is methodologically distinct (pathway-level completeness rather than flux-based or PICRUSt-style models) but arrives at comparable conclusions.
-
H2 aligns with Danczak et al. (2020), who established a meta-metabolome ecology framework showing that community assembly processes govern which metabolites accumulate. Our PCA result extends this to genome-predicted metabolic potential: not just what metabolites are present, but what the resident taxa are capable of making, clusters strongly by ecosystem.
-
Ramoneda et al. (2023) used GapMind to show that amino acid auxotrophy distributions are non-random across bacterial phyla and environments. Our community-weighted extension shows that these taxon-level patterns aggregate into measurable ecosystem-level signals in the NMDC dataset.
-
Gowda et al. (2022) showed that metabolite dynamics in model communities are predictable from gene content. Our result for leucine (r = −0.33) and arginine (r = −0.30) at environmental scale, though weaker, is directionally consistent with this finding from controlled communities.
Novel Contribution
This study is, to our knowledge, the first application of GapMind community-weighted pathway completeness scores to predict environmental metabolomics across a large cross-habitat NMDC dataset. The integration of 305M GapMind pathway records (27,690 GTDB species × 80 pathways) with NMDC multi-omics for 220 samples spanning two habitat types establishes a scalable approach for testing metabolic ecological hypotheses from public data lakehouses.
The finding that community-level amino acid biosynthesis completeness negatively predicts ambient amino acid concentrations — even in noisy, cross-study environmental data — suggests that community metabolic potential is a meaningful predictor of ecosystem chemistry beyond taxonomic composition alone.
Limitations
-
Metabolomics technical heterogeneity: The 175 metabolomics samples derive from multiple NMDC studies. However, study-level analysis of the H1 subset reveals that 95% of H1 samples (125/131) originate from a single NMDC study (nmdc:sty-11-r2h77870), so cross-study LC-MS protocol heterogeneity is largely absent as a confounder for leu and arg. The second study (n = 6) does not materially affect the results. For future analyses with broader multi-study coverage, study-level random effects could be modelled to improve power.
-
Freshwater samples absent from H1: All 33 Freshwater samples lacked paired metabolomics in NMDC, so H1 is effectively a soil-only test. Whether BQH dynamics operate in freshwater communities at the same scale is untested.
-
Abiotic feature coverage: Abiotic features (pH, temperature, total organic carbon, etc.) were absent (all NaN) for the 174-sample analysis matrix, preventing partial correlation tests controlling for environmental gradients. These variables could confound both H1 and H2 results.
-
GapMind represents genomic potential, not expression: Pathway completeness indicates whether the genes are present, not whether they are actively expressed. Transcriptomic data would be needed to determine whether expressed biosynthesis correlates more strongly with metabolite pools.
-
Compound identification: Metabolite-to-pathway matching relied on string-based compound name matching. A substring collision bug (isoleucine compounds matching the “leucine” pattern) was identified by automated review and corrected in NB04 cell-14 using first-match-wins; results reflect the corrected run. Isoleucine is now included as a 13th testable pathway (r = −0.057, ns). KEGG compound IDs in the NMDC data are sparsely populated (2% annotation rate), limiting KEGG-based matching; cysteine, histidine, and lysine remain untestable due to absent compound detections.
-
Chorismate metabolomics proxy: Shikimic acid and 3-dehydroshikimic acid are used as metabolomics proxies for chorismate pathway activity. These are upstream intermediates, not chorismate itself; their ambient concentrations reflect precursor availability rather than chorismate pool size. The chorismate BQH correlation (r = −0.038) should be interpreted cautiously.
-
Genus-proxy-ambiguous taxon assignment: For ~1,352 Centrifuge taxa that match multiple GTDB clades (same genus, multiple species), one representative clade was selected by alphabetical tiebreaking on
gtdb_species_clade_id. This is now documented in NB03 cell-17. The sensitivity of community completeness scores to this choice is bounded: genus_proxy_ambiguous taxa account for ~6.5% of mapped abundance. -
Sample size imbalance: Glutamine (n = 4) and proline (n = 9) could not be tested due to insufficient metabolomics coverage. These pathways would be informative given their biological importance.
Data
Sources
| Collection | Tables Used | Purpose |
|---|---|---|
nmdc_arkin | centrifuge_gold, omics_files_table, study_table, abiotic_features | Community taxonomic profiles (species-level Centrifuge classifications), sample-to-file bridge, study metadata, environmental measurements |
nmdc_arkin | metabolomics_gold | Per-sample LC-MS metabolomics (3.1M records across 48 studies) |
kbase_ke_pangenome | gapmind_pathways, gtdb_species_clade, pangenome | GapMind pathway completeness scores (305M rows), GTDB taxonomy bridge, per-species statistics |
Generated Data
| File | Rows | Description |
|---|---|---|
data/nmdc_sample_inventory.csv | ~220 | NMDC samples with taxonomy + metabolomics coverage per study |
data/nmdc_classifier_comparison.csv | 3 | Per-classifier summary statistics (kraken, centrifuge, gottcha): total rows, species-rank fraction, file counts |
data/nmdc_metabolomics_coverage.csv | 0 | 0 rows — saved before the omics_files_table bridge was found; superseded by analysis_ready_matrix.csv |
data/bridge_quality.csv | 220 | Per-sample GTDB species bridge coverage (all pass QC) |
data/species_pathway_completeness.csv | ~27,690 × 80 | GapMind completeness per GTDB species per pathway |
data/community_pathway_matrix.csv | 220 | Community-weighted pathway completeness (220 samples × 86 cols) |
data/community_pathway_matrix_long.csv | ~17,600 | Long-format version of above |
data/metabolomics_matrix.csv | 175 | Normalised metabolite intensities (175 samples × 476 compounds) |
data/amino_acid_metabolites.csv | 737 | Sample × aa pathway log-intensities for 15 matched aa pathways |
data/analysis_ready_matrix.csv | 174 | Merged: pathway completeness + metabolomics + abiotic features |
data/h1_bqh_correlations.csv | 15 | Spearman r, p, BH-FDR q per aa pathway (13 testable + 2 skipped: gln n=4, pro n=9) |
data/h2_pca_scores.csv | 220 | PCA coordinates (PC1–5) per sample with ecosystem label |
data/h2_pca_loadings.csv | 80 | PCA loadings for all 80 pathways on PC1 and PC2 |
Supporting Evidence
Notebooks
| Notebook | Purpose |
|---|---|
01_nmdc_exploration.ipynb | NMDC schema exploration; sample inventory; taxonomy classifier comparison; metabolomics annotation rates |
02_taxonomy_bridge.ipynb | Map NMDC Centrifuge taxa to GTDB pangenome species; compute per-sample bridge coverage |
03_pathway_completeness.ipynb | Extract GapMind species-level pathway completeness; compute community-weighted scores for 220 samples × 80 pathways |
04_metabolomics_processing.ipynb | Extract and normalise NMDC metabolomics; match compounds to aa pathways; merge with pathway matrix and abiotic features |
05_statistical_analysis.ipynb | H1 Spearman/BH-FDR correlation test; H2 PCA + Kruskal-Wallis ecosystem separation; per-pathway boxplots |
Figures
| Figure | Description |
|---|---|
figures/nmdc_sample_coverage_SUPERSEDED.png | Sample overlap figure — note: generated before the omics_files_table bridge was discovered (NB01); shows 0 overlap. Superseded by bridge_quality_distribution.png from NB02 which reflects the correct 220-sample cohort. Renamed with _SUPERSEDED suffix to signal its status. |
figures/bridge_quality_distribution.png | Distribution of GTDB bridge coverage across 220 samples |
figures/pathway_completeness_heatmap.png | Mean community pathway completeness by pathway × ecosystem type |
figures/metabolomics_distribution.png | Compound intensity distributions across samples |
figures/h1_bqh_barplot.png | H1 result: Spearman r per aa pathway; red = FDR-significant negative (BQH support) |
figures/h1_scatter_top.png | Scatter plots for the 4 pathways with lowest p-values in H1 |
figures/h2_pca.png | PCA biplot of 220 samples × 80 pathways, coloured by ecosystem type |
figures/pathway_completeness_boxplot.png | Per-aa-pathway completeness distributions by ecosystem type (KW significance marked) |
Future Directions
-
Abiotic gradient controls and multi-study replication: The H1 signal could be strengthened (or confounders identified) by including available abiotic variables (pH, temperature, total organic carbon) in a partial correlation or mixed-effects model once NMDC abiotic data is populated for the metabolomics-overlap samples. The current H1 dataset is effectively single-study; replicating this analysis across additional NMDC studies with paired taxonomy + metabolomics would test whether the leu/arg signals generalise beyond the current cohort.
-
Extend to Freshwater samples: Obtaining or generating metabolomics data for the 33 Freshwater NMDC samples would allow a direct test of whether BQH dynamics differ between aquatic and terrestrial communities — a key open question given their strikingly different pathway completeness profiles.
-
Transcript-based validation: Pairing metatranscriptomics with metabolomics for a subset of NMDC samples would allow comparison of expressed pathway completeness vs. genomic potential vs. metabolite abundance, directly testing whether expression (not just gene presence) drives the BQH signal.
-
KEGG compound ID expansion: Improving KEGG compound annotations in
metabolomics_gold(3 currently missing aa pathways: cys, his, lys) would expand the H1 test set from 13 to 16 testable pathways, improving statistical power. -
Cross-habitat partial correlation (soil subtype analysis): The 61 “Unknown” ecosystem samples likely represent a mix of soil subtypes or sediment environments; resolving their habitat identity (via NMDC ENVO annotations or study-level metadata) could improve H2 power and reveal finer-scale metabolic niche structure.
References
-
Morris JJ, Lenski RE, Zinser ER (2012). “The Black Queen Hypothesis: Evolution of Dependencies through Adaptive Gene Loss.” mBio. 3(2):e00036-12. DOI: 10.1128/mBio.00036-12
-
Noecker C, Eng A, Srinivasan S, Theriot CM, Young VB, Jansson JK, et al. (2016). “Metabolic model-based integration of microbiome taxonomic and metabolomic profiles elucidates mechanistic links between ecological and metabolic variation.” mSystems. 1(1):e00013-15. DOI: 10.1128/mSystems.00013-15
-
Mallick H, Franzosa EA, McIver LJ, Banerjee S, Sirota-Madi A, Kostic AD, et al. (2019). “Predictive metabolomic profiling of microbial communities using amplicon or metagenomic sequences.” Nature Communications. 10(1):3136. PMID: 31316056
-
Danczak RE, Chu RK, Fansler SJ, Goldman AE, Graham EB, Tfaily MM, et al. (2020). “Using metacommunity ecology to understand environmental metabolomes.” Nature Communications. 11(1):6369. PMID: 33311510. DOI: 10.1038/s41467-020-19989-y
-
Price MN, Deutschbauer AM, Arkin AP (2020). “GapMind: Automated Annotation of Amino Acid Biosynthesis.” mSystems. 5(3):e00291-20. DOI: 10.1128/mSystems.00291-20
-
Price MN, Deutschbauer AM, Arkin AP (2022). “Filling gaps in bacterial catabolic pathways with computation and high-throughput genetics.” PLOS Genetics. 18(7):e1010156. DOI: 10.1371/journal.pgen.1010156
-
Ramoneda J, Jensen TBN, Price MN, Fierer N, Braendle C (2023). “Taxonomic and environmental distribution of bacterial amino acid auxotrophies.” Nature Communications. 14(1):7608. DOI: 10.1038/s41467-023-43435-4
-
Gowda K, Ping D, Mani M, Kuehn S (2022). “Genomic structure predicts metabolite dynamics in microbial communities.” Cell. 185(3):530-546. PMID: 35085485. DOI: 10.1016/j.cell.2021.12.036
-
Danczak RE, Goldman AE, Chu RK, Toyoda JG, Borton MA, et al. (2021). “Ecological theory applied to environmental metabolomes reveals compositional divergence despite conserved molecular properties.” Science of the Total Environment. 788:147409. DOI: 10.1016/j.scitotenv.2021.147409
-
Arkin AP, Cottingham RW, Henry CS, Harris NL, Stevens RL, Maslov S, et al. (2018). “KBase: The United States Department of Energy Systems Biology Knowledgebase.” Nature Biotechnology. 36(7):566-569. DOI: 10.1038/nbt.4163