Key Findings
Multiplicity and sample-size context (primary panel)
Model-family sample counts from data/model_family_sample_counts.tsv frame how much data each analysis used:
| Mode | Base Spearman n | Adj+Cov n | Adj+Fraction n | High-coverage subset n |
|---|---|---|---|---|
relaxed_all_clades | 108 | 108 | 212 (sample-fraction rows) | 68 |
strict_single_clade | 108 | 108 | 212 (sample-fraction rows) | 68 |
species_proxy_unique_genus | 108 | 108 | 212 (sample-fraction rows) | 1 |
This keeps exploratory interpretation calibrated: coverage-aware models increase effective rows (fraction-level), while species-proxy high-coverage tests are underpowered (n=1).
(Notebook: 03_contamination_functional_models.ipynb; data: model_family_sample_counts.tsv)
Confirmatory Spearman tests remain null with confidence intervals and global FDR
Predeclared confirmatory tests (site_defense_score Spearman vs contamination in genus-level modes) remained non-significant:
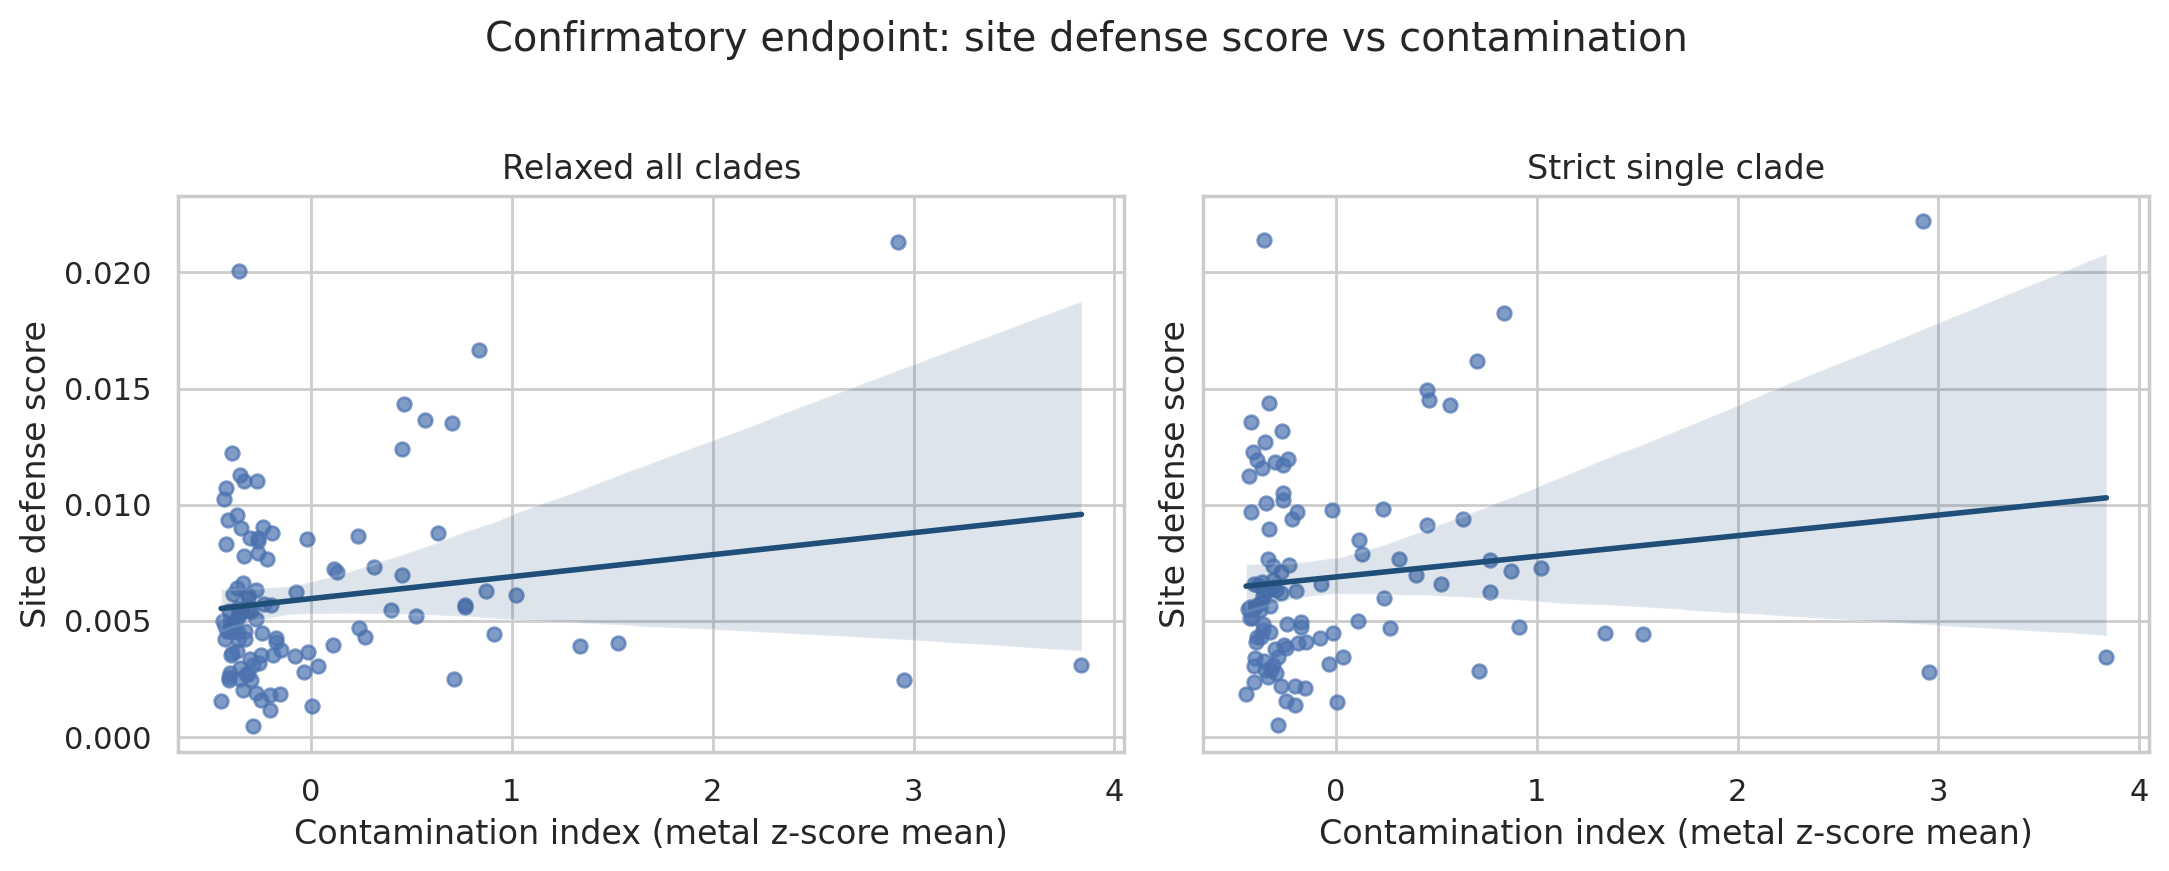
relaxed_all_clades: rho = 0.0587, 95% bootstrap CI [-0.128, 0.250], Spearman p = 0.546, FDR q = 0.862strict_single_clade: rho = 0.0682, 95% bootstrap CI [-0.111, 0.253], Spearman p = 0.483, FDR q = 0.849
Compact summary table (data/confirmatory_family_summary.tsv), where Spearman columns are confirmatory and adjusted-model columns are exploratory sensitivity analyses:
| Mode | Endpoint | n | Confirmatory Spearman rho (95% CI) | Confirmatory Spearman p / q | Exploratory Adj+Cov beta (95% CI) | Exploratory Adj+Cov p / q |
|---|---|---|---|---|---|---|
relaxed_all_clades | site_defense_score | 108 | 0.0587 [-0.128, 0.250] | 0.546 / 0.862 | 0.000751 [0.000224, 0.001779] | 0.000398 / 0.0462 |
strict_single_clade | site_defense_score | 108 | 0.0682 [-0.111, 0.253] | 0.483 / 0.849 | 0.000640 [0.000169, 0.001538] | 0.00354 / 0.130 |
(Notebook: 03_contamination_functional_models.ipynb)
Exploratory defense signal remains strongest in coverage-aware models
Exploratory sensitivity models still show strongest positive defense associations in coverage-aware adjustments:
- Coverage-adjusted OLS (
contamination + depth + latitude + longitude + mapped_abundance_fraction):relaxed_all_clades: beta = 0.000751, 95% bootstrap CI [0.000224, 0.001779], p = 0.000398, FDR q = 0.0462strict_single_clade: beta = 0.000640, 95% bootstrap CI [0.000169, 0.001538], p = 0.00354, FDR q = 0.130
- Fraction-aware adjusted model (
contamination + mapped_abundance_fraction + C(community_fraction_type)):relaxed_all_clades: beta = 0.000607, 95% bootstrap CI [0.000213, 0.001221], p = 0.00144, FDR q = 0.0838strict_single_clade: beta = 0.000566, 95% bootstrap CI [0.000214, 0.001113], p = 0.00548, FDR q = 0.130
- High-coverage subset (
mapped_abundance_fraction >= 0.25):site_defense_score: Spearman p = 0.0207 (relaxed), 0.00980 (strict)- After global FDR: q = 0.301 (relaxed), 0.189 (strict)
Most non-defense outcomes remained non-significant in these sensitivity tests, with one exploratory exception:
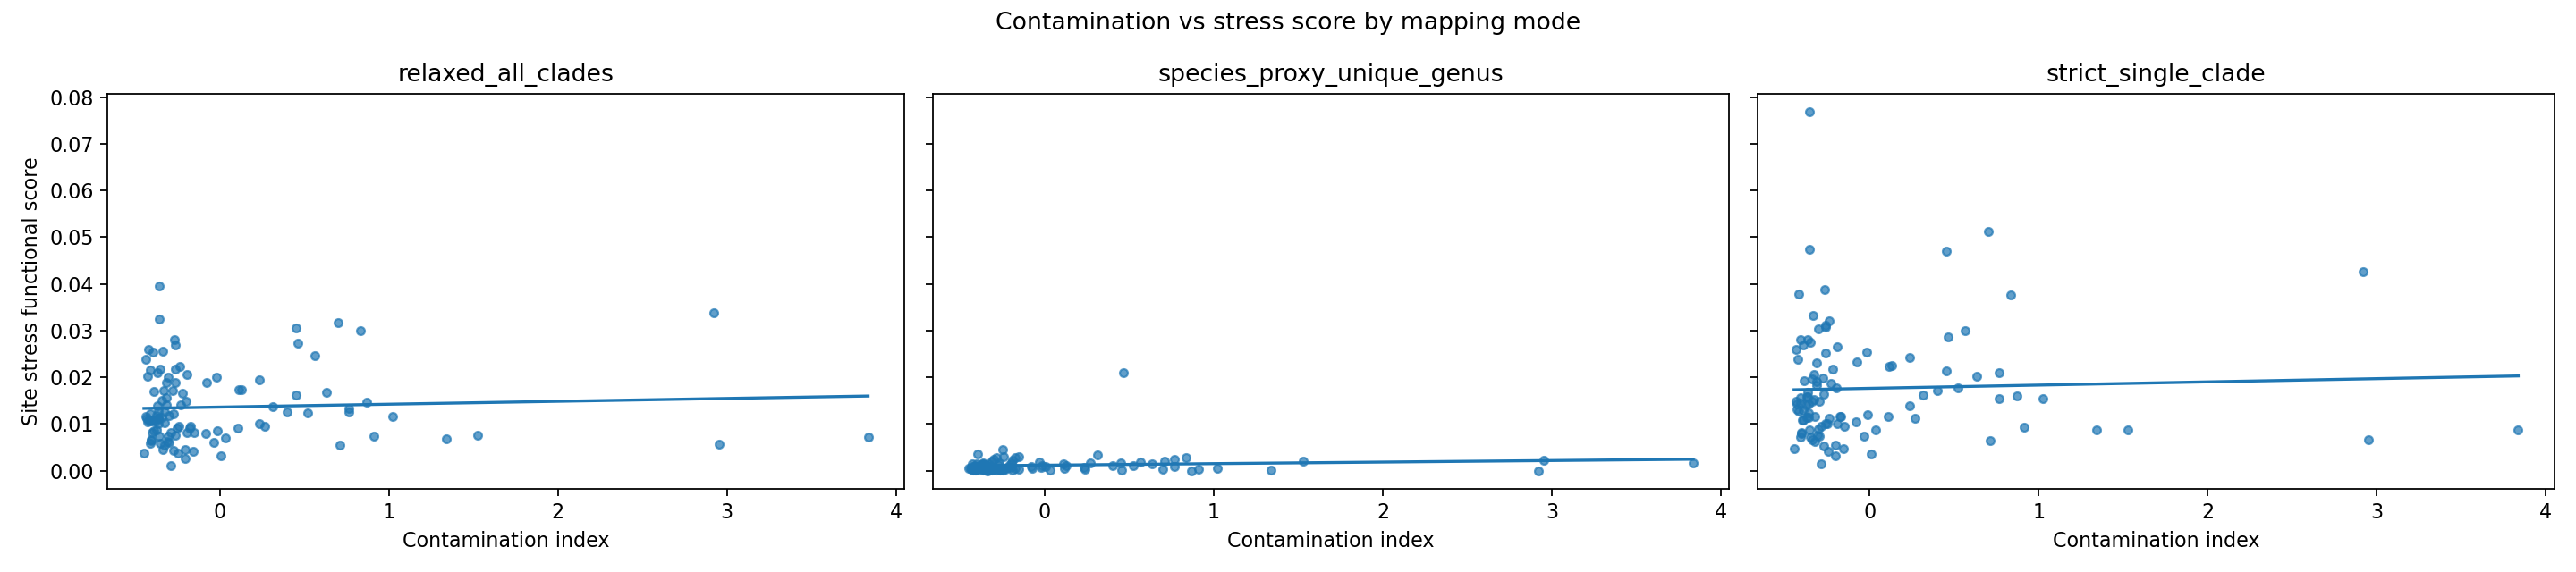
strict_single_clade, high-coverage subset (mapped_abundance_fraction >= 0.25),site_stress_score: Spearman rho = 0.2489, p = 0.0407.
Community-fraction robustness does not show strong within-fraction monotonic signal
To address potential confounding from collapsing multiple community fractions, NB03 now retains community_fraction_type parsed from sdt_community_name and runs fraction-aware robustness analyses.
- Fraction-aware adjusted models use
n = 212sample-fraction rows (106 for0.2_micron_filter, 106 for10_micron_filter). - Within-fraction Spearman tests for defense were non-significant:
relaxed_all_clades: p = 0.767 (0.2micron), p = 0.898 (10micron)strict_single_clade: p = 0.780 (0.2micron), p = 0.793 (10micron)
This supports the conclusion that strong monotonic defense signal is not robustly reproducible inside individual fraction strata.
(Notebook: 03_contamination_functional_models.ipynb)
Contamination-index sensitivity does not change confirmatory outcome
Confirmatory endpoint was re-tested under four contamination index variants:
- Composite all-metals (current primary index)
- Uranium-only
- Top-3 variance metals
- PCA first component of metal z-scores
Across both confirmatory mapping modes, all index variants remained non-significant after FDR (q = 0.546 across the 8 confirmatory-variant tests), including uranium-only.
(Notebook: 03_contamination_functional_models.ipynb; data: contamination_index_sensitivity.tsv)
Species-proxy resolution sensitivity is limited by mapped coverage
To approximate higher taxonomic resolution despite ENIGMA taxonomy stopping at genus, NB02 added species_proxy_unique_genus mode (only genera mapping to exactly one GTDB species clade).
- Unique-clade genera: 150 (vs 530 mapped genera total)
- Ambiguous multi-clade genera: 380
- Mean mapped abundance fraction in species-proxy mode: 0.031 (vs 0.343 in strict/relaxed)
site_defense_scoretrend is positive but not significant: rho = 0.169, Spearman p = 0.081- No high-coverage subset test was feasible at the existing threshold (
mapped_abundance_fraction >= 0.25) due low retained coverage.
This suggests that with current ENIGMA taxonomy granularity, stricter taxonomic resolution sharply reduces analyzable signal and does not strengthen inference yet.
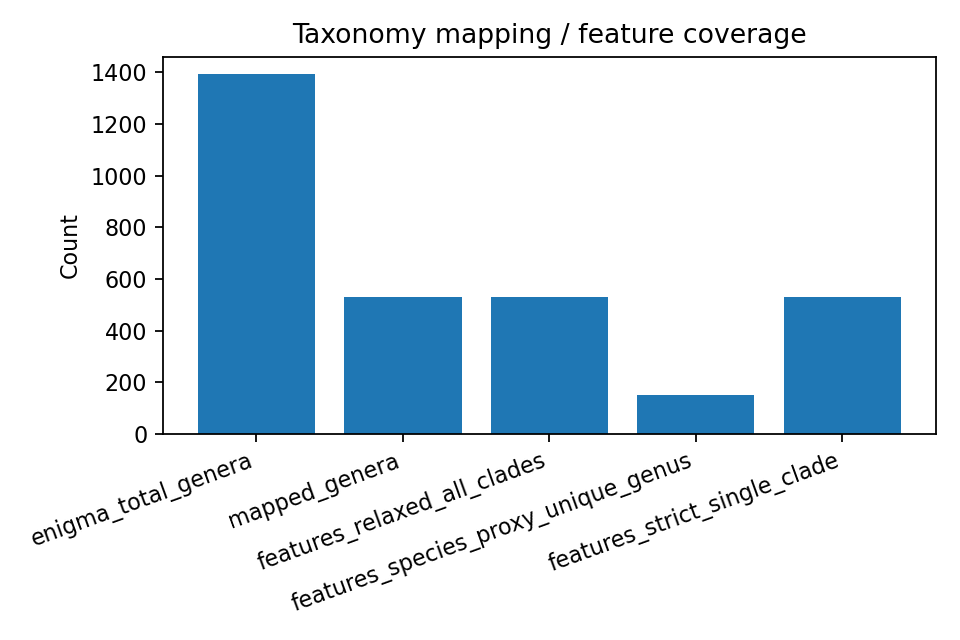
Coverage diagnostics from upstream outputs:
- 1,392 ENIGMA genera observed
- 530 mapped genera, 862 unmapped genera
- Of mapped genera, 150 were unique-clade (species-proxy resolvable) and 380 were multi-clade ambiguous
- Bridge table rows: 8,242 (many-to-many genus-to-clade expansion)
- Functional feature rows: 3,630 across 3 mapping modes (
strict_single_clade,relaxed_all_clades,species_proxy_unique_genus) - Mean mapped abundance fraction: 0.343 in strict/relaxed modes (range 0.031 to 0.854) and 0.031 in species-proxy mode (range 0.0002 to 0.543)
Bridge-quality diagnostics now exported explicitly:
- Summary metrics (
data/bridge_quality_summary.tsv): mapped genera 530, unmapped 862, unique-clade 150, ambiguous multi-clade 380. - Clade-count distribution (
data/bridge_clade_count_distribution.tsv): long right tail; max clades per genus = 433. - Top ambiguous genera (
data/bridge_top_ambiguous_genera.tsv):pseudomonas(433),streptomyces(378),prevotella(358),streptococcus(214),mycobacterium(186).
(Notebook: 02_taxonomy_bridge_functional_features.ipynb; data: taxon_bridge.tsv, taxon_functional_features.tsv)
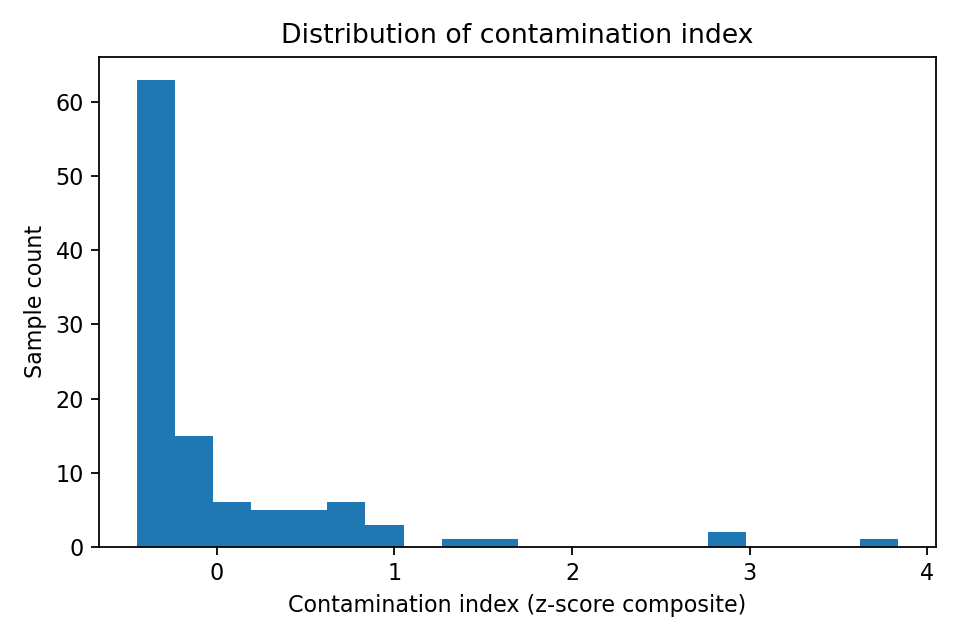
Contamination index was broad but right-skewed
NB03 built contamination index from 8 metal columns (arsenic, cadmium, chromium, copper, lead, nickel, uranium, zinc) using per-metal log1p z-scoring and row-wise mean.
- n = 108 samples
- min = -0.448, max = 3.836
- median = -0.271, IQR = [-0.363, 0.053]
(Notebook: 03_contamination_functional_models.ipynb)
Results
NB01 extracted and QC-filtered overlap data to 108 samples with both geochemistry and community composition:
- Geochemistry matrix shape:
(108, 49) - Community taxon rows:
41,711 - Distinct communities:
212 - Distinct genera:
1,392
NB02 built a genus-normalized bridge to pangenome clades:
- GTDB species rows parsed for genus mapping:
27,690 - Mapped genera:
530 - Unmapped genera:
862 - Strict clades:
530, relaxed clades:7,380 - Species-proxy clades (unique genus->single clade):
150 - Functional features now computed independently for strict, relaxed, and species-proxy mapping modes.
NB03 produced:
- Site functional score rows:
324(108 samples x 3 mapping modes) - Model result rows:
12(4 outcomes x 3 mapping modes) - Expanded model diagnostics in
model_results.tsv: confirmatory/exploratory labels, bootstrap CIs for key effect sizes, adjusted coordinates/depth models, coverage-adjusted models, site-structure models (location_prefix), fraction-aware models (community_fraction_type), within-fraction correlations, high-coverage subset correlations, and global BH-FDR q-values across all reported p-values. - Additional robustness tables:
data/contamination_index_sensitivity.tsv(8 confirmatory variant rows)data/mapped_coverage_deciles.tsv(30 decile strata rows)data/model_family_sample_counts.tsv(96 model-family count rows)
Overall, confirmatory evidence remains null and robust to index definition; exploratory coverage-aware defense associations persist with positive effect estimates, but are attenuated under global multiple-testing control.
Interpretation
Within this ENIGMA subset, contamination gradients did not translate into a robust community-level shift in inferred stress-related functional potential when features are aggregated at genus resolution from broad COG categories. This is compatible with contamination-driven taxonomic turnover that is functionally redundant or too fine-scale (species/strain/pathway level) for the present mapping.
Literature Context
- Directionally aligned with Hemme et al. (2015; PMID: 26583008), which reported strong contamination-linked taxonomic restructuring in Oak Ridge groundwater with reduced functional breadth in stressed communities. Our confirmatory null Spearman results at genus-aggregated score level are consistent with contamination effects that do not collapse into one robust monotonic community-wide proxy.
- Also consistent with Fan et al. (2025), who reported pronounced compositional shifts but only modest functional-diversity decline in a mixed waste-contaminated Oak Ridge aquifer. This matches the pattern here: ecological differentiation is detectable, while broad functional summaries show weaker confirmatory monotonic response.
- Relative to Carlson et al. (2019; PMID: 30523276), this project extends from taxa-abundance association to reproducible bridge-aware functional sensitivity modeling (strict, relaxed, and species-proxy modes), quantifying where inference remains coverage-limited.
- The bridge/annotation stack depends on GTDB and eggNOG conventions (Parks et al. 2022; Cantalapiedra et al. 2021); at genus-level aggregation, broad COG-style signals can dilute pathway-specific metal-response effects.
Novel Contribution
This project contributes a reproducible ENIGMA-to-BERDL functional inference workflow with independent strict-vs-relaxed feature construction, mapped-coverage diagnostics, a species-proxy unique-clade sensitivity mode, and multi-tier modeling beyond basic univariate association tests.
Limitations
- ENIGMA taxonomy table
ddt_brick0000454currently provides labels throughGenus(no species/strain labels), so true species-level bridge testing is not directly possible in this dataset slice. - Genus-level mapping may mask strain-level adaptation.
- 862/1,392 observed genera were unmapped to current pangenome bridge.
- COG-fraction proxies are coarse summaries, not curated resistance pathways.
- Exploratory sensitivity-model significance is concentrated in defense and depends on coverage/covariate specification; broader effect across outcomes is not yet established.
- Site structure is represented by coarse
location_prefixeffects rather than full hierarchical/random-effects modeling.
Data
Sources
| Collection | Tables Used | Purpose |
|---|---|---|
enigma_coral | ddt_brick0000010, ddt_brick0000459, ddt_brick0000454, sdt_sample, sdt_community, sdt_location | Geochemistry, community composition, taxonomy linkage, and sample metadata |
kbase_ke_pangenome | gtdb_species_clade, pangenome, gene_cluster, eggnog_mapper_annotations | Taxonomy bridge and COG-derived functional feature construction |
Generated Data
| File | Rows | Description |
|---|---|---|
data/geochemistry_sample_matrix.tsv | 108 | Per-sample geochemistry matrix used for contamination index |
data/community_taxon_counts.tsv | 41,711 | Sample-community-genus abundance table |
data/sample_location_metadata.tsv | 108 | Location/depth metadata for overlapping samples |
data/taxon_bridge.tsv | 8,242 | Genus-to-GTDB species-clade bridge with mapping tier |
data/taxon_functional_features.tsv | 3,630 | Per-genus functional proxy features across three mapping modes |
data/site_functional_scores.tsv | 324 | Site-level functional scores by mapping mode |
data/model_results.tsv | 12 | Confirmatory/exploratory labels, Spearman/permutation, adjusted model coefficients with bootstrap CIs, fraction-aware/coverage/site sensitivities, and global FDR q-values |
data/contamination_index_sensitivity.tsv | 8 | Confirmatory endpoint results across contamination index variants |
data/mapped_coverage_deciles.tsv | 30 | Defense association diagnostics by mapped-coverage decile and mapping mode |
data/model_family_sample_counts.tsv | 96 | Sample-count table for each modeling family and endpoint |
data/confirmatory_family_summary.tsv | 2 | Compact confirmatory endpoint summary with effect sizes, CIs, p, q, and n |
data/bridge_quality_summary.tsv | 6 | Bridge-level mapped/unmapped/ambiguity summary metrics |
data/bridge_clade_count_distribution.tsv | 71 | Distribution of species-clade counts per mapped genus |
data/bridge_top_ambiguous_genera.tsv | 20 | Most ambiguous mapped genera by species-clade multiplicity |
Supporting Evidence
Notebooks
| Notebook | Purpose |
|---|---|
notebooks/01_enigma_extraction_qc.ipynb | ENIGMA overlap extraction and QC export |
notebooks/02_taxonomy_bridge_functional_features.ipynb | Taxonomy bridge and functional feature engineering |
notebooks/03_contamination_functional_models.ipynb | Contamination index construction, modeling, and diagnostics |
Figures
| Figure | Description |
|---|---|
figures/confirmatory_defense_vs_contamination.png | Confirmatory defense score vs contamination index, faceted by strict/relaxed mapping mode |
figures/contamination_vs_functional_score.png | Exploratory stress score vs contamination index, faceted by mapping mode |
figures/contamination_index_distribution.png | Histogram of contamination index values across 108 samples |
figures/mapping_coverage_by_mode.png | Number of feature-covered genera per mapping mode |
Future Directions
- Replace COG-fraction proxies with curated metal-stress gene sets and pathway-level summaries.
- Increase taxonomic resolution where possible (species/strain-level bridge from metagenomic or higher-resolution ENIGMA taxonomy) and quantify gains over genus and species-proxy modes.
- Fit adjusted models with explicit covariates (depth, location cluster, sampling date) and compositional modeling controls.
- Investigate unmapped genera contribution to contamination gradients and bridge expansion opportunities.
- Add mixed-effects or hierarchical site models (well/location-level random effects) to test whether defense associations persist under richer structure control.
References
- Carlson HK et al. (2019). The selective pressures on the microbial community in a metal-contaminated aquifer. ISME J 13:937-949. PMID: 30523276.
- Hemme CL et al. (2010). Metagenomic insights into evolution of a heavy metal-contaminated groundwater microbial community. ISME J 4:660-672. DOI: 10.1038/ismej.2009.154.
- Hemme CL et al. (2015). Comparative metagenomics reveals impact of contaminants on groundwater microbiomes. Front Microbiol 6:1205. PMID: 26583008.
- Fan Y et al. (2025). Modest functional diversity decline and pronounced composition shifts of microbial communities in a mixed waste-contaminated aquifer. Microbiome 13:106. DOI: 10.1186/s40168-025-02105-x.
- Parks DH et al. (2022). GTDB: an ongoing census of bacterial and archaeal diversity through a phylogenetically consistent, rank normalized and complete genome-based taxonomy. Nucleic Acids Res 50:D785-D794.
- Cantalapiedra CP et al. (2021). eggNOG-mapper v2: Functional annotation, orthology assignments, and domain prediction at the metagenomic scale. Mol Biol Evol 38:5825-5829.